Implications
Relative production responses to supplementary protein are markedly smaller in growing cattle compared with dairy cows. The amount of protein supplements strongly affects the production costs in beef production, since the prices of these supplements are high compared to silage and grain. In addition, feeding supplementary protein increases the N and P emissions, and decreasing dietary protein inputs in the diets of growing cattle could potentially decrease environmental impacts.
Introduction
Ruminants have two types of N requirements, the N requirements of ruminal fermentation and the amino acid (AA) requirements of the host animal. A shortage of rumen-degradable feed protein (RDP) has been shown to reduce microbial digestion of carbohydrates (Griswold et al., Reference Griswold, Apgar, Bouton and Firkins2003; Klevesahl et al., Reference Klevesahl, Cochran, Titgemeyer, Wickersham, Farmer, Arroquy and Johnson2003), reduce synthesis of microbial protein (Martín-Orue et al., Reference Martín-Orue, Balcells, Vicente and Castrillo2000; Griswold et al., Reference Griswold, Apgar, Bouton and Firkins2003), decrease feed intake (Wheeler et al., Reference Wheeler, Lalman, Horn, Redmon and Lents2002) and decrease weight gain of growing cattle (Zinn et al., Reference Zinn, Borquez and Plascenia1994 and Reference Zinn, Barrajas, Montano and Ware2003). A shortage of absorbed AA by cattle, either because of decreased synthesis of microbial protein or less than required intakes of rumen-undegraded protein (RUP), decreases weight gain of growing cattle (Lammers and Heinrichs, Reference Lammers and Heinrichs2000). Even though individual studies have examined the influence of protein supplementation on the intake and performance of growing cattle, limitations in the number of observations and basal diet composition do not allow for definitive conclusions. It has been reported that the inclusion of rapeseed meal (RSM) in the barley grain-based concentrate with grass silage (Huuskonen et al., Reference Huuskonen, Khalili and Joki-Tokola2007 and Reference Huuskonen, Khalili and Joki-Tokola2008) or whole-crop barley silage (Huuskonen, Reference Huuskonen2013) -based diets did not affect performance of growing dairy bulls. However, inclusions of RSM in the grass silage plus barley-based diet had positive effects on the performance of young bulls and bull calves in some feeding experiments (Aronen and Vanhatalo, Reference Aronen, Toivonen, Ketoja and Öfversten1992; Aronen et al., Reference Aronen and Vanhatalo1992), and including RUP increased the BW gain (BWG) of young steers offered grass silage plus low levels of concentrate (Moloney, Reference Moloney1991; Rouzbehan et al., Reference Rouzbehan, Galbraith, Topps and Rooke1996).
Decreasing dietary protein inputs in diet could potentially decrease environmental impacts related to air and water quality (Cole et al., Reference Cole, Greene, McCollum, Montgomery and McBride2003). The P content in some protein supplements, especially in RSM, is high compared with the basal diet based on forages and grains (MTT, 2014). According to literature, N and P are routinely overfed to ruminants, which leads to nutrient surpluses (Jonker et al., Reference Jonker, Kohn and High2002; Ondersteijn et al., Reference Ondersteijn, Beldman, Daatselaar, Giesen and Huirne2002; Dou et al., Reference Dou, Ferguson, Fiorini, Toth, Alexander, Chase, Ryan, Knowlton, Kohn, Peterson, Sims and Wu2003). Therefore, it is important to evaluate if protein supplements can be reduced or excluded from grass silage-based diets without compromising animal performance.
The objective of this meta-analysis was to develop empirical equations predicting the performance responses of growing cattle to supplementary protein intake. The modelling was based on treatment mean data from growing cattle experiments in which the nutrient supply was manipulated by wide ranges of forage and concentrate factors. A mixed model regression analysis was used to develop equations allowing an estimation of marginal responses to the changes in protein supply. In this paper, the model development and implications for practical application are presented and discussed.
Material and methods
Data
A data set was collected from feeding experiments with growing cattle (bulls, steers and heifers) fed ad libitum total mixed ration or ad libitum grass silage, or whole-crop silages (barley, oats or wheat), hay or straw partly or completely substituted for grass silage. The concentrate feeds consisted of cereal grains, fibrous by-products and various protein supplements (mainly RSM, soybean meal (SBM) and fish meal (FM)). Approximately half of the studies were conducted with pure dairy breeds (Ayrshire, Friesian, Holstein and Nordic Red) and the remainder with beef breeds or dairy×beef crossbred animals. Approximately half of the experiments were conducted in the United Kingdom and Ireland and the remainder in the Nordic countries. Variation in the design of experiments, animal performance, experimental diets, feeding routines, etc. between the experiments was substantial covering most practical on-farm feeding alternatives.
The minimum prerequisite for an experiment to be included in the data set was that forage and total dry matter (DM) intakes and initial and final BW were available, and adequate forage characterisation (plant species, DM and CP concentration, in vivo or in vitro digestibility of organic matter and fermentation quality) and adequate concentrate characterisation (proportion of ingredients, DM, CP concentration) were available. Experiments published before 1980 and studies using hormonal growth promoters were not included in the data set. Overall, the data set comprised 199 diets in 80 studies. The list of references used for the meta-analysis is given in Supplementary Material S1.
Calculations
For the forages the concentration of total acids (TA) was calculated by summing the concentrations of lactic acid and volatile fatty acids (VFA). For the Finnish data, silage D-values (digestible organic matter (DOM) in DM) based on in vitro pepsin-cellulase method were calculated with forage-specific equations (primary growth and regrowth grass, legume and whole-crop silages) (Huhtanen et al., Reference Huhtanen, Rinne and Nousiainen2006). When silage NDF was not reported, estimates derived from regression equations developed from the Finnish data sets (Huhtanen et al., Reference Huhtanen, Rinne and Nousiainen2006) were used. Fat (analysed as ether extract) and NDF concentrations of the concentrates were entered when reported; otherwise tabulated values (MTT, 2014) for each ingredient were used. Concentration of metabolisable energy (ME) of silages was calculated from the concentration of DOM for grass and legume silages as:
 $$\eqalignno {{\rm ME}\left( {{\rm MJ}/{\rm kg DM}} \right)={\rm 16}.0{\rm }\left( {{\rm MJ}/{\rm kg DM}} \right){\rm } \cr \ \quad{\times}{\rm DOM }\left( {{\rm kg}/{\rm kg DM}} \right){\rm }\left( {{\rm MAFF},{\rm 1984}} \right)$$
For whole-crop silages and straws, coefficients of 15.5 and 14.0 instead of 16.0 were used, respectively (MAFF, 1984). For hays the ME concentration was calculated using equation
 $${\rm ME }\left( {{\rm MJ}/{\rm kg DM}} \right)={\rm 16}.{\rm 9 }{\times}{\rm DOM }\left( {{\rm kg}/{\rm kg DM}} \right){\rm }-{\rm 1}.0{\rm 5 }\left( {{\rm MAFF},{\rm 1984}} \right)$$
For the concentrate feeds the ME concentration was calculated using tabulated digestibility coefficients (MTT, 2014) and analysed chemical composition. In the Scandinavian feed protein evaluation system (Madsen et al., Reference Madsen, Hvelplund, Weisbjerg, Bertilsson, Olsson, Spörndly, Harstad, Volden, Tuori, Varvikko, Huhtanen and Olafsson1995), the protein value of the diet is expressed as AA absorbed from the small intestine (metabolisable protein, MP) and the protein balance value (PBV) in the rumen, which describes the balance between the dietary supply of RDP and the microbial requirements for RDP. In the present meta-analysis MP and PBV were calculated using the Finnish version (Tuori et al., Reference Tuori, Kaustell and Huhtanen1998; MTT, 2014) of the Scandinavian system.
If the BWG was not available, it was calculated as the difference between initial and final BW divided by the number of growing days. Dressing proportions were calculated as the ratio of carcass weight to final BW. In the majority of the feeding experiments used in the present meta-analysis the carcasses were classified for conformation and fatness using the EUROP quality classification (EC, 2006). For conformation, the development of the carcass profiles, in particular the essential parts (round, back, shoulder), was taken into consideration according to the EUROP classification (E: excellent, U: very good, R: good, O: fair, P: poor). Each level of the conformation scale was subdivided into three sub-classes (e.g. O+, O and O−) to produce a transformed scale ranging from 1 to 15, with 15 being the best conformation. For fat cover degree, the amount of fat on the outside of the carcass and in the thoracic cavity was taken into account using a classification range from 1 to 5 (1: low, 2: slight, 3: average, 4: high, 5: very high). In few old experiments, different national carcass quality classifications were used. However, in all cases the smallest conformation and fat score number described the poorest conformation and leanest fat score, respectively.
Statistical analysis
The whole data set was analysed to evaluate the effects of different dietary variables on BWG and carcass traits with a MIXED model regression analysis of SAS (Littell et al., Reference Littell, Milliken, Stroup and Wolfinger1996): Y=B 0+B 1X1ij +b 0+b 1X1ij +e ij , where B 0 and B 1X1ij are the fixed effects (intercept and effects of independent variables) and b 0, b 1 and e ij are the random experiment effects (intercept and slope), where i=1,…, n studies and j=1,…, n i values. Unstructured variance–covariance matrix for the intercepts and slopes (TYPE=UN option) was used in the random statement. The analyses were conducted both comprehensively for all studies and also separately for studies in which SBM (n=71 diets/28 studies), FM (27/12) and RSM (74/35) were used as a protein supplement. The significance of the differences in the slope of dependent variable was tested with t-test. Root mean squared errors presented in the tables are adjusted for random study effects as described by St-Pierre (Reference St-Pierre2001). The effects of different animal and dietary variables on BWG responses to increased dietary CP concentration were evaluated by plotting the random slope effect (B 1+b 1) in each study against observed animal and diet variables on the control diet in each study (lowest dietary CP concentration). The responses to increased dietary MP concentration were also analysed, but because the trends were similar to responses to CP the results are not presented.
Deviating properties of the data were investigated from leverage and influence by the diagnostic DFFITS and DFBETAS (Belsley et al., Reference Belsley, Kuh and Welsch1980). Cut off values suggesting that an observation is an outlier were set at |DFFITS|>2√(p/n) and |DFBETAS|>2√n, where p is the parameter estimated in the model and n the total number of observations.
Results
Description of the data set
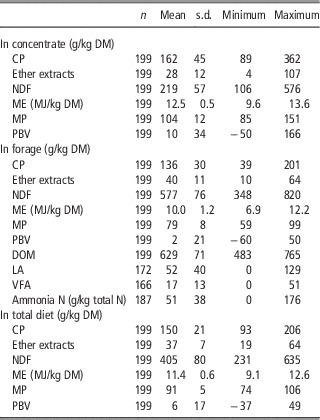
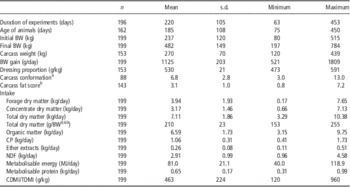
As expected, the forage and concentrate components of the diets as well as the total diets displayed wide ranges in chemical composition and calculated feeding values (Table 1). On average, the silages were well fermented, but the maximum values of silage ammonia N and VFA concentrations indicate that the data sets also included both extensively and poorly fermented silages. Total dry matter intake (DMI) ranged from 3.3 to 10.4 kg/day reflecting, for example, differences in BW of the animals and the intake potential of the diets (Table 2). The large variation in BWG (from 521 to 1809 g/day) reflects differences in genetic potential of the animals and nutritive value and intake potential of the diets.
Description of the experimental feeds and diets in the data set used for evaluation of protein supplementation for growing cattle

DM=dry matter; ME=metabolisable energy; MP=metabolisable protein; PBV=protein balance value in rumen; DOM=digestible organic matter in dry matter; LA=lactic acid; VFA=volatile fatty acids.
Mean feed and nutrient intake, BWs, BW gain and carcass characteristics in the data set used for evaluation of protein supplementation for growing cattle

TDMI=total dry matter intake; CDMI=concentrate dry matter intake.
a Conformation score: 1=poorest; 15=excellent.
b Fat score: 0=leanest; 10=fattest.
BWG responses
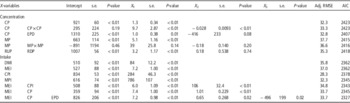
In the comprehensive analysis with all studies increasing dietary CP concentration increased (P<0.01) BWG (Table 3). The BWG responses were not different for bulls v. steers and heifers (1.4 v. 1.3 g per 1 g/kg DM increase in dietary CP concentration) and for dairy v. beef breeds (1.2 v. 1.7 g per 1 g/kg DM, respectively). The response showed diminishing responses with increased CP concentration (negative quadratic effect P<0.01). In terms of Akaike’s information criteria (AIC) the MP model performed slightly better than the CP model (Table 3). When RUP and RDP were used in a bivariate model, only RUP had a positive effect on BWG and the slope was markedly greater than for CP. The BWG response to increased dietary CP concentration increased with decreased effective protein degradability (EPD). In terms of the smaller AIC the intake models performed better than the models based on protein concentrations. The model based on ME intake, CP concentration and EPD was the best on the basis of the smallest AIC (Table 3).
Relationships between diet/intake parameters and BW gain in growing cattle estimated by mixed model regression analysis

Adj. RMSE=residual mean squared error adjusted for random study effects; AIC=Akaike’s information criteria; CP=crude protein (g/kg DM); EPD=effective protein degradability (kg/kg); MP=metabolisable protein (g/kg DM); RUP=rumen-undegraded protein (g/kg DM); RDP=rumen degraded protein (g/kg DM); DMI=dry matter intake (kg/day); MEI=metabolisable energy intake (MJ/day); CPI=CP intake (kg/day); MPI=metabolisable protein intake (kg/day).
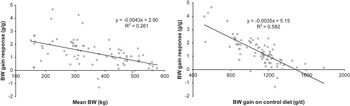
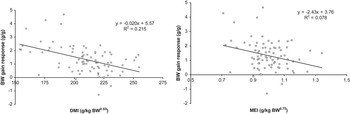
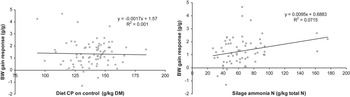
The effect of increased diet CP concentration on BWG declined (P<0.01) with increasing mean BW of the animals and with improved BWG of the control animals (the lowest CP diet in each study) (Figure 1). The BWG responses to increased protein supplementation were negatively related to DMI (P<0.01) and ME intake (P<0.01) (Figure 2). Surprisingly, BWG responses to protein supplementation were not related to the CP concentration in the diet of animals fed the control diet (Figure 3). The responses increased (P<0.05) with increased ammonia N concentration in silage N, and declined marginally (P>0.10) with increasing proportion of concentrate in the diet and increasing dietary concentrations of ME and MP. The BWG responses to protein supplementation were not related to the digestibility or TA concentration of the forages (data not shown).
The effects of mean BW and BW gain of the control group (the lowest CP in each study) on BW gain response (g/day per 1 g CP/kg DM) to increased CP concentration in the diet.

The effects of dry matter intake (DMI) and metabolisable energy intake (MEI) of the control group (the lowest CP in each trial) on BW gain response (g/day per 1 g CP/kg DM) to increased CP concentration in the diet.

The effects of dietary CP concentration of the control group (the lowest CP in each trial) and silage ammonia N concentration on BW gain response (g/day per 1 g CP/kg DM) to increased CP concentration in the diet.

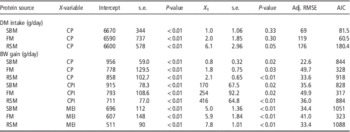
The effects of different protein sources on DMI and BWG are shown in Table 4. Only RSM increased DMI significantly (P<0.05). All protein supplements increased BWG significantly, but responses (g BWG/day per g/kg DM increment in CP) were greater for RSM (P<0.01) and FM (P<0.05) than for SBM. When expressed as per kg CP intake the BWG responses were greater for RSM than for SBM (P<0.01) and FM (P<0.05), respectively. Also the response per unit of ME intake was greater for RSM than for SBM (P<0.05).
The effects of different protein sources on dry matter intake and BW gain in growing cattle estimated by mixed model regression analysis

Adj. RMSE=residual mean squared error adjusted for random study effects; AIC=Akaike’s information criteria; SBM=soybean meal; FM=fish meal; RSM=rapeseed meal; CP=crude protein (g/kg DM); CPI=CP intake (kg/day); MEI=metabolisable energy intake (MJ/day).
Feed efficiency and carcass traits
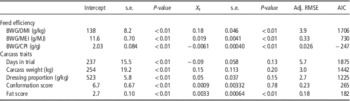
In the comprehensive analysis with all studies increasing dietary CP concentration improved (P<0.01) feed efficiency, expressed as BWG/kg DMI or MJ ME intake, whereas BWG/kg CP intake decreased markedly with increased dietary CP concentration (Table 5). Assuming CP concentration of 170 g/kg BW (ARC, 1980), the marginal efficiency of the utilisation of incremental CP intake was only 0.05 (s.e.=0.008).
The effects of protein supplementation on feed efficiency and carcass traits in growing cattle estimated by mixed model regression analysis

Adj. RMSE=residual mean squared error adjusted for random study effects; AIC=Akaike’s information criteria; BWG=BW gain (kg/day); DMI=dry matter intake (kg/day); MEI=metabolisable energy intake (MJ/day); CP=crude protein (g/kg DM).
Increased dietary CP concentration had no significant (P>0.10) effect on days in study, carcass weight, dressing proportion or carcass conformation score, but it increased (P<0.01) carcass fat score (Table 5). However, although significant, the effect on fat score was quantitatively minimal.
Discussion
In the present meta-analysis the protein responses were not related to the breed or sex of experimental animals. Evaluation of breed and sex effects is, however, uncertain because there was no cross-classification, that is, the effects of these factors can be confounded with other random experimental effects. In the literature, some differences between sexes and also among breeds have been documented. According to the review by Hussein and Jordan (Reference Hussein and Jordan1991), bulls responded more to FM supplementation than steers and heifers. Geay (Reference Geay1984) stated that net protein requirements seem to be less important than energy requirements for early maturing growing steers (Hereford or Aberdeen Angus) because they retain only 12% to 15% of their energy as protein and have only 12% protein in BWG. Instead, according to Geay (Reference Geay1984), protein requirements are relatively higher for growing bulls of late maturing breeds (Simmental, Charolais or Limousin), which retain 35% to 45% of their energy as protein. However, in a more recent feeding experiment, Pesonen et al. (Reference Pesonen, Honkavaara, Kämäräinen, Tolonen, Jaakkola, Virtanen and Huuskonen2013) observed no interactions in intake or gain variables between breed (Hereford and Charolais) and RSM supplementation with grass silage-based diets.
In general, the effect of protein supplementation on BWG has been rather inconsistent in feeding experiments (Huuskonen, Reference Huuskonen2009a). However, as in the present analysis, the greatest responses have been measured with young cattle (Jaakkola et al., Reference Jaakkola, Huhtanen and Vanhatalo1990; Steen, Reference Steen1992) and often the positive effect on BWG was restricted to only the early phase of the growth period (BW below 300 kg) (Huhtanen et al., Reference Huhtanen, Nousiainen and Rinne1989; Aronen, Reference Aronen1990). Huuskonen (Reference Huuskonen2009b and Reference Huuskonen2011) reported that RSM had a positive effect on BWG of growing bulls only during the first sub-experimental periods (up to BW of 250 to 350 kg). In addition, calculations by Titgemeyer and Löest (Reference Titgemeyer and Löest2001) showed that while AA were the limiting factor with lighter weight calves offered grass silage, energy availability was the limiting factor with heavier steers. In several studies, a large proportion of the advantage of protein supplementation of young cattle was lost during the finishing period owing to compensatory growth (Titgemeyer and Löest, Reference Titgemeyer and Löest2001; McGee, Reference McGee2005).
The differences between protein variables in predicting BW differences were generally small. Negative influence of EPD and greater positive effect of RUP compared with RDP suggest that the small positive responses to supplementary protein were associated with increased supply of RUP. There was no relationship between dietary CP concentration on the control diet (the lowest CP in the study) and BWG response to supplementary protein suggesting that the requirements of RDP were met by all diets or that recycling compensated for the limited supply from the control diet. The Finnish recommendation for growing cattle above 200 kg BW is that PBV is above −10 g/kg DM (MTT, 2014). Deleting studies in which PBV of the control diet was below −20 g/kg DM had only a minimal influence on BWG response to increased CP (1.1 v. 1.3 g/g CP per kg DM) suggesting that recommended PBV can even be reduced without adverse effects on BWG. The amounts of N recycled into the gastrointestinal tract was 27 g/kg DMI in cattle fed low CP (80 g/kg DM) diet and ~40 g/kg DMI in cattle fed high CP diets (Marini and Van Amburgh, Reference Marini and Van Amburgh2003). These values indicate that in growing cattle rumen PBV can be negative with minimal, if any, adverse effects on the BWG. Advantages of using MP in estimating protein supply and requirements are questionable at least for growing cattle above 200 kg BW; microbial protein and RUP from high quality forages and energy supplements (grain) can meet the requirements. The strong negative relationship between BWG/feed intake in cattle fed the low CP control diet and responses in BWG to supplementary protein (Figure 2) indicates that protein can be more limiting when the diet characteristics are limiting intake and performance.
In the present analysis, the protein responses increased with increased ammonia N concentration in silage N that is in accordance with Hussein and Jordan (Reference Hussein and Jordan1991), who concluded that with poorly preserved silage the response in animal performance to protein supplementation is greater than with well-preserved silage. The positive relationship between silage ammonia N concentration and BWG response to supplementary protein indicate that silage protein value was negatively related to ammonia N. This is consistent with the observations in dairy cows (Huhtanen et al., Reference Huhtanen, Hetta and Swensson2008). Proportion of ammonia N in silage had a negative effect on milk protein yield (MPY), but soluble non-ammonia N had no influence on MPY, and consequently on the true silage MP concentration.
The protein responses declined marginally with increasing proportion of concentrate in the diet and increasing dietary concentration of ME in the present analysis. Also Aronen (Reference Aronen1992) concluded that the responses to protein supplements seem to be related to the level of concentrate supplement, greater effects being observed with small proportions of concentrates. Consistently, supplementation of grass silage alone with a rumen-degradable source of protein has increased the gain of growing steers (Veira et al., Reference Veira, Petit, Proulx, Laflamme and Butler1995; Scollan et al., Reference Scollan, Sargeant, McAllan and Dhanoa2001). Hagemeister et al. (Reference Hagemeister, Lüpping and Kaufmann1980) reported a tendency towards lower rumen protein synthesis with rations containing very low (0 to 200 g/kg DM) or very high (700 to 1000 g/kg DM) proportions of concentrate. According to Aronen (Reference Aronen1992), a medium level of concentrates together with well-preserved grass silage can sustain efficient microbial protein production. Therefore, it is likely that a greater response to protein supplementation can be expected when grass silage-based diets fed to growing cattle are supplemented with small rather than large amounts of concentrates.
Using RSM as a protein supplement resulted in better BWG responses than SBM per unit of increases in dietary CP concentration or CP intake. According to our knowledge low glucosinolate RSM and SBM have not recently been compared in the silage-based diets of growing cattle. In the study of Olsson (Reference Olsson1987) BWG was numerically greater (60 g/day) in cattle fed SBM compared with those fed high glucosinolate RSM, but there was no difference between the control diet without supplementary protein and SBM diet. The results of the study by Aronen and Vanhatalo (Reference Aronen, Toivonen, Ketoja and Öfversten1992) suggest that the effects of RSM on BWG can be more related to the concentration of glucosinolates than to protein degradability.
Greater BWG responses to incremental CP intake with RSM compared with SBM is consistent with two recent meta-analyses of the data from milk production trials (Huhtanen et al., Reference Huhtanen, Näsi and Khalili2011; Martineau et al., Reference Martineau, Quellet and Lapierre2013). In the study of Huhtanen et al. (Reference Huhtanen, Näsi and Khalili2011), marginal responses to additional CP intake were ~30% greater for RSM diets compared with SBM diets, but RSM treated to reduce ruminal CP degradability had no effect compared with untreated RSM. Part of the greater production responses to RSM protein compared with SBM protein can be associated with greater increases in feed intake, both in growing and lactating cattle. However, the reasons for the greater intake responses with RSM are not clear. Huhtanen et al. (Reference Huhtanen, Näsi and Khalili2011) suggested that DMI may increase more with RSM than with SBM in response to a greater energy demand due to increased milk yield (pull effect) induced by a greater supply of AA or a more balanced profile of AA. Whether this is the mechanism in growing cattle is difficult to evaluate because both intake and production responses to supplementary protein are markedly smaller in growing cattle compared with dairy cows.
Meta-analyses of the data from feeding trials in dairy cows (Huhtanen et al., Reference Huhtanen, Näsi and Khalili2011; Martineau et al., Reference Martineau, Quellet and Lapierre2013) and the current analysis in growing cattle suggest that the MP value of RSM is underestimated compared with SBM. Martineau et al. (Reference Martineau, Quellet and Lapierre2013) reported that positive changes in MPY in cows fed RSM diets were coupled with negative changes in estimated MP supply. In addition, greater increases in plasma concentrations of essential AA in cows fed graded levels of RSM compared with cows fed isonitrogenous SBM-containing diets (Shingfield et al., Reference Shingfield, Vanhatalo and Huhtanen2003) indicated a greater supply of absorbed AA from RSM.
In accordance with earlier feeding experiments (Huuskonen et al., Reference Huuskonen, Khalili and Joki-Tokola2007 and Reference Huuskonen, Khalili and Joki-Tokola2008; Huuskonen, Reference Huuskonen2009a and Reference Huuskonen2011; Pesonen et al., Reference Pesonen, Honkavaara, Kämäräinen, Tolonen, Jaakkola, Virtanen and Huuskonen2013) protein supplementation had no effects on the dressing proportion or carcass conformation score. Consistently, with the present meta-analysis, Steen (Reference Steen1996) reported that there was a tendency for steers given concentrates containing SBM to produce fatter carcasses than those given barley alone. In addition, Steen (Reference Steen1988b) and Steen and Moore (Reference Steen and Moore1988 and Reference Steen and Moore1989) found that increasing protein intake tended to increase carcass fatness, although the effects only reached significance when the combined results of a series of experiments were analysed together (Steen, Reference Steen1988a). Lowman et al. (Reference Lowman, Neilson and Hunter1985) reported that supplementation of grass silage with a mixture of barley and FM rather than with barley alone reduced the lean content of the forerib joint of steers by 3%. Information on the reasons for increased fat deposition with increased protein intake is limited. However, daily carcass gain at finishing and BWG at the calf stage are positively correlated with carcass fat score (Herva et al., Reference Herva, Huuskonen, Virtala and Peltoniemi2011), which could partly explain increased fat score with higher protein intakes in the present meta-analysis. Furthermore, increase in dietary CP is often associated with extra dietary fat (from protein meals) and gluconeogenic AAs as well as slightly improved diet digestibility (Nousiainen et al., Reference Nousiainen, Rinne and Huhtanen2009), possibly contributing to extra energy that can result in increased carcass fat. In wether sheep, Waghorn et al. (Reference Waghorn, Flux and Ulyatt1987) found that increasing protein intake reduced circulating growth hormone concentrations and increased fat synthesis. According to the literature, the effects of protein intake on carcass fatness may also be related to the growth potential of the cattle as the higher protein intakes have increased carcass fatness in the animals of lower growth potential, but not in those of higher growth potential (Lowman et al., Reference Lowman, Neilson and Hunter1985; Steen, Reference Steen1988a and Reference Steen1991).
Assuming a CP concentration of 170 g/kg BW, the marginal efficiency of CP utilisation was 0.05. Efficiency of N utilisation (N retention/N intake) decreased by 1.02 (s.e.=0.05; P<0.01) g/kg per 1 g/kg DM increase in dietary CP concentration. These numbers indicate a poor utilisation of supplementary protein in growing cattle, and consequently increased N emissions to the environment. True CP digestibility of RSM and SBM estimated by the Lucas test was on average 0.95 in dairy cows (Huhtanen et al., Reference Huhtanen, Näsi and Khalili2011). These numbers suggest that about 90% of incremental N intake would be excreted in urine in growing cattle fed supplementary protein. As urinary N is more susceptible to both leaching and evaporation, the adverse effects to the environment increase proportionally more than N output in manure. In addition, the concentration of P in protein supplements is usually high, especially in RSM (12 to 14 g/kg DM). Consequently, supplementary protein feeding also increases P emissions, since the basal diet based on forages and grain typically contains 3.0 to 3.5 g P/kg DM that exceeds the requirements of growing cattle (MTT, 2014).
Conclusions
This meta-analysis demonstrated that the relative production responses to supplementary protein are smaller in growing cattle compared with dairy cows. However, increasing dietary CP concentration increased BWG in the present meta-analysis, although the small overall effects are difficult to demonstrate in a single study owing to lack of statistical power. The BWG responses were not related to the CP concentration in animals fed the control diet. Responses were greater in cattle fed diets with low nutritive value or intake potential. Owing to small production responses, increased feed costs and emissions of N and P, there is generally no benefit for using protein supplementation for growing cattle fed grass silage-based diets, provided that the supply of RDP is not limiting digestion in the rumen.
Acknowledgement
The authors wish to thank the Centre for Economic Development, Transport and the Environment for Northern Ostrobothnia for partial funding of the project.