Exercise often exhibits some changes in the heart.Reference Pelliccia and Maron1 The changes in cardiac parameters due to dynamic exercise are different in many published studies.Reference Pelliccia and Maron1, Reference Longhurst, Kelly, Gonyea and Mitchell2 P wave dispersion and P-wave maximal duration reflect the activation of atrial muscle and may depend primarily upon the mass of tissue excited. They are used in the assessment of risk for atrial fibrillation which is characterised by non-homogeneous and discontinuous atrial conduction.Reference Dilaveris, Gialafos and Sideris3, Reference Dilaveris, Gialafos and Andrikopoulos4 The primary objective of this study was to investigate P-wave dispersion, P-wave durations, and related factors in different healthy genders applying for registration to the School of Physical Education and Sports. In addition, we evaluated the resting electrocardiogram findings between these groups.
Methods
Patient population
From 2006 to 2009, a total of 2093 students – 1674 boys with a mean age of 19.8 plus or minus 1.9 years and 419 girls with a mean age of 19.1 plus or minus 1.8 years – who applied for registration to the School of Physical Education and Sports of Sakarya University with a training history of some years were included in the study. In the past 6 weeks, all students had moderate-intensity aerobic, endurance, physical activity for a minimum of 30 minutes on 5 days each week (American College of Sports Medicine/American Heart Association Class I(A)).Reference Haskell, Lee and Pate5 A detailed history was taken and each participant underwent a systemic physical examination to exclude cardiovascular or other relevant disease before attending to the study. Patients who had a history of cardiovascular or any other systemic disorders and those on medications, and alcohol consumption, known to alter cardiac conduction were excluded from the study. All patients gave their informed consent for inclusion in the study. The Community Health Centre approved the study. The investigation conforms to the principles outlined in the Declaration of Helsinki.
Body mass index measurement
Body weight was measured in kilograms, and height was measured with students wearing light clothes and no shoes. Body mass indices (kilogram per square metres) were calculated dividing body weight in kilograms by square of body height in metres.
Blood pressure measurement
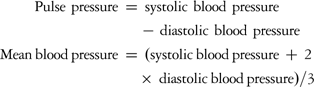
In each patient, the arterial blood pressure was measured by the same observer in each patient in the supine position after at least 20 minutes of rest. Clinic blood pressure was measured, using a mercury sphygmomanometer with a cuff appropriate to the arm circumference, Korotkoff phase I for systolic blood pressure and V for diastolic blood pressure. In each patient, two blood pressure measurements were taken, and their mean was considered for analysis.
Assessment of P wave dispersion and electrocardiogram abnormalities
P wave duration was calculated in all 12 leads of the surface electrocardiogram, which were simultaneously recorded. All recordings were performed in the same quiet room during spontaneous breathing, following 20 minutes of adjustment in the supine position. P wave duration measurements were obtained manually by two of the investigators using calipers and magnifying lens for accurate definition of the electrocardiogram deflection as defined in a previous study.Reference Dilaveris, Gialafos and Sideris3 The onset of P wave was defined as the point of the first visible upward departure of the trace from the bottom of the baseline. The return to the baseline of the bottom of the trace in wave was considered to be the end of the P wave. P maximum in any of the 12 lead surface electrocardiograms was calculated and used as a marker of prolonged atrial conduction time. The difference between P wave maximum and P wave minimum durations was defined as P wave dispersion.
Each resting electrocardiogram was evaluated for sinus arrhythmia, sinus bradycardia, sinus tachycardia, ventricular extrasystol, left atrial enlargement, right atrial enlargement, right axis deviation, voltage criteria for left ventricular hypertrophy – defined as the greatest measured depth of the S wave in leads V1 or V2 added to the greatest height of the R wave in lead V5 or V6 greater than or equal to 35 millimetres – early repolarisation, interventricular conduction delay, non-specific ST segment and T wave changes, incomplete right bundle branch block, complete right bundle branch block, incomplete left bundle branch block, complete left bundle branch block, left posterior hemiblock, left anterior hemiblock, short PR, long QT, and atrioventricular block. All electrocardiogram patterns were evaluated according to commonly adopted clinical criteria.Reference Friedman6
Statistical analysis
Statistics were obtained using the ready-to-use program of SPSS version 8.0. Chi-square analysis was used to test for significance of gender differences in the frequency of selected electrocardiogram findings. Independent samples of t-tests were used to examine gender differences in measured anthropometric, haemodynamic, and electrocardiogram variables including P wave dispersion, P wave maximal duration, and P wave minimal duration. Relations between variables were calculated using Pearson's correlation tests and multivariable linear regression analysis. p-Value less than 0.05 was considered significant.
Results
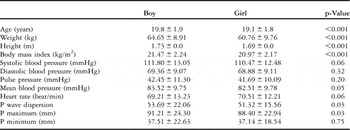
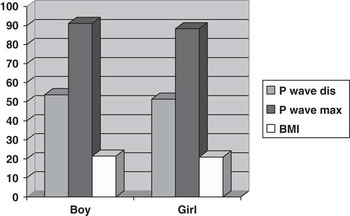
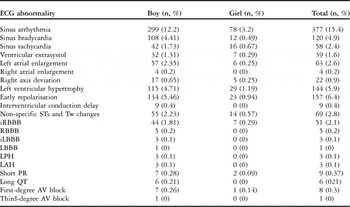
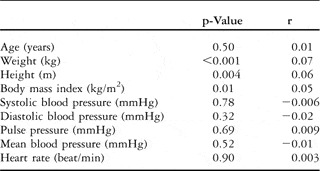
By comparing the baseline clinical and electrocardiogram parameters between different genders, we found a significant elevation of age, body weight, body height, body mass index, P wave maximal duration, and P wave dispersion in boys than in girls (Table 1; Fig 1). The frequencies of electrocardiogram abnormalities are presented in Table 2. Of all the parameters tested with correlation analysis in all patients, only gender (p = 0.03; r = 0.04), body weight (p < 0.001; r = 0.07), body height (p = 0.004; r = 0.06), and body mass index (p = 0.01; p = 0.05) were correlated with P wave dispersion (Table 3). There were no independent correlated parameters that were tested in a multivariable linear regression analysis (R = 0.086, R2 = 0.007, F = 3.917, p = 0.004; gender: p = 0.17, body weight: p = 0.69, body height: p = 0.49, body mass index: p = 0.53).
Antropometric, haemodynamic, and electrocardiographic values in boys and girls.

The P wave dis (P wave dispersion), P wave max (P wave maximal duration), and BMI (body mass index) were significantly increased in boys as compared with girls.

Frequency of electrocardiographic abnormalities.

ECG = electrocardiogram; iLBBB = incomplete left bundle branch block; iRBBB = incomplete right bundle branch block; LAH = left anterior hemiblock; LBBB = complete left bundle branch block; LPH = left posterior hemiblock; RBBB = complete right bundle branch block; STs = ST segment; Tw = Twave
The correlation between P wave dispersion and antropometric and haemodynamic values.

Discussion
Our results revealed significantly different values for age, body weight, body height, and body mass index, P wave maximal duration, P wave dispersion, and other electrocardiogram parameters in healthy boys and girls in an unselected student population. Another important finding of our study was that the P wave dispersion was correlated with gender, body weight, body height, and body mass index in healthy students with regular exercise.
Long-term athletic conditioning is associated with cardiac morphologic changes, including increased left ventricle systolic and diastolic diameter, wall thickness, and mass.Reference Pelliccia and Maron1, Reference Longhurst, Kelly, Gonyea and Mitchell2 Furthermore, high-intensity dynamic endurance exercise is usually associated with the rhythm and conduction abnormalities that result from the bradycardia, changes in the autonomic nervous system. In the absence of pathological conditions, the major determinant of altered electrocardiogram patterns was the morphological cardiac remodelling induced by physical training.Reference Pelliccia, Maron and Culasso7 Male athletes most commonly showed more abnormal electrocardiogram patterns than female athletes, as shown in our study. The predominance of normal electrocardiogram patterns in female athletes may associate with mild morphological left ventricle changes and certain sport disciplines. In athletes below 20 years of age, the higher prevalence of abnormal electrocardiograms may be related to body growth and maturation during adolescence.Reference Pelliccia, Maron and Culasso7, Reference Pelliccia, Maron, Culasso, Spataro and Caselli8 Recently, Crouse et alReference Crouse, Meade, Hansen, Green and Martin9 demonstrated that abnormal resting electrocardiogram findings – for example, left ventricular hypertrophy (64.5%), interventricular conduction delay (2.6%), sinus bradycardia (9.1%), sinus arrhythmia (15.6%), first-degree atrioventricular block (11.7%), early repolarisation (33.8%), and left atrial enlargement (48.1%) – are common in a sample of collegiate football athletes.
P wave dispersion, being an electrocardiographic marker, is an independent predictor of atrial fibrillation. It is associated with inhomogeneous and discontinuous propagation of sinus impulses.Reference Dilaveris, Gialafos and Sideris3, Reference Dilaveris, Gialafos and Andrikopoulos4 Non-homogeneous propagation and prolongation of atrial conduction time are electrophysiologic characteristics in patients with atrial fibrillation.Reference Dilaveris, Gialafos and Sideris3, Reference Dilaveris, Gialafos and Andrikopoulos4 Endurance sports practice increases the probability of suffering atrial fibrillation, after adjusting for other risk factors.Reference Mont, Elosua and Brugada10 The pathophophysiological mechanism of atrial fibrillation generation due to endurance sports practice is still not completely understood. Atrial ectopic beats, inflammatory changes, and atrial size have been suggested.Reference Mont, Elosua and Brugada10 The long-term endurance sports practice or occupational physical activity may induce structural changes such as enlargement and fibrosis in the atrium, which may create a favourable substrate for the disease.Reference Mont, Elosua and Brugada10 A recent study showed that excessive endurance exercise and overtraining can lead to chronic systemic inflammation with elevated C-reactive protein, which may be mediated by the renin-angiotensin system and a sustained increase in catecholamines, all of them being predictive factors for atrial fibrillation.Reference Swanson11 Pelliccia et alReference Pelliccia, Maron and Di Paolo12 found in their study that atrial size was larger in athletes than in controls, and this was a predictor for atrial fibrillation. Other proposed mechanisms are increased vagal tone, bradycardia, and gastro-oesophageal reflux.Reference Mont, Tamborero and Elosua13, Reference Alessi, Nusynowitz, Abildskov and Moe14 In healthy young patients, there is consistent evidence indicating an enhanced parasympathetic activity associated with increased aerobic power,Reference Smith, Hudson, Graitzer and Raven15 whereas inconsistent results are reported for sympathetic activityReference Svendenhag, Wallin, Sundlöff and Henriksson16 as well as for baroreflex sensitivity.Reference Loimaala, Huikuri, Oja, Pasanen and Vuori17 Some studies have shown that endurance-trained patients present higher values of power spectral heart rate variability, indicating increasing vagal activityReference Buchheit, Simon, Piquard, Ehrhart and Brandenberger18, Reference Puig, Freitas and Carvalho19; whereas others have reported higher values of the low frequency component of heart rate variability suggesting higher sympathetic activity.Reference Puig, Freitas and Carvalho19, Reference Furlan, Piazza and Dell'Orto20 The effect of aerobic and anaerobic endurance training on the autonomic nervous system depends on its intensity. It is therefore possible that the sympathetic nervous system may become active in healthy people during exercise and this causes an increase in the heart rate resulting in a decrease of the P wave duration, all of them being triggered by an elevated excretion of norepinephrine to the coronary sinus.Reference Cousineau, Ferguson, de Champlain, Gauthier, Côté and Bourassa21, Reference Manhem, Lecerof and Hökfelt22 Cardiac sympathetic activity is also most likely increased during regular exercise and norepinephrine from the heart may have contributed to the increase in plasma norepinephrine levels.Reference Manhem, Lecerof and Hökfelt22 The athletes showed a significantly higher cardiac norepinephrine spillover without significant changes in reuptake and clearance.Reference Neri Serneri, Boddi and Modesti23 As cardiac neuronal reuptake of norepinephrine was unaffected, the increased cardiac spillover to plasma is proportional to the rate of cardiac sympathetic nerve firingReference Esler24 and points to an increase in the cardiac sympathetic drive at rest. Iellamo et alReference Iellamo, Legramante and Pigozzi25 showed that very intensive endurance training shifted the cardiovascular autonomic modulation from a parasympathetic towards a sympathetic predominance. This result should be interpreted within the context of the substantial role played by the sympathetic nervous system in increasing cardiovascular performance at training.
In this study, we found that gender, body weight, body height, and body mass index were correlated with P wave dispersion. This relation may be due to the increased heart weight and size, or body mass index, in boys than in girls in our study.Reference Scholz, Kitzman, Hagen, Ilstrup and Edwards26, Reference Yildiz, Pazarli, Semiz, Kahyaoglu, Sakar and Altinkaynak27 The duration of the P wave reflects the activation of atrial muscle and may depend primarily upon the mass of tissue excited. Thus, the P wave dispersion should be correlated with gender and body mass index. Some studies have shown that body mass index is one of the most important determinants of left atrial size.Reference Pritchett, Jacobsen, Mahoney, Rodeheffer, Bailey and Redfield28, Reference Vaziri, Larson, Benjamin and Levy29 Left atrial enlargement, which is a powerful predictor of atrial fibrillation, may contribute to the increase in P wave duration and dispersion associated with increased body mass index.
In conclusion, the frequencies of all electrocardiogram abnormalities, P wave dispersion, and P wave maximal duration were higher in boys as compared with girls in an unselected student population applying for registration to the School of Physical Education and Sports; in addition, P wave dispersion was correlated with gender, body weight, body height, and body mass index.
Study limitations
There might be some limitations to this trıal. Owing to this being an observational study on electrocardiogram criteria, we did not measure sympathetic system activation and did not perform echocardiography to measure left ventricular mass and left atrial size.
Acknowledgement
We acknowledge a valuable student, Alparslan Sahin, for helping.
Disclosures
None.