I. INTRODUCTION
In recent years, the application of electropulsing treatment (EPT) in the fields of materials science and engineering has attracted increasing interest. Numerous studies have reported that EPT can induce recrystallization of metals and alloys.Reference Gromov, Danilov, Tsellermaer, Sizova and Zuev1–Reference Xu, Tang and Jiang10 Zhou et al.Reference Zhou, Xiao and Guo2 investigated effects of EPT on the recrystallization behavior of a cold-worked brass under EPT. They succeeded in obtaining smaller recrystallized grains in cold-worked brass with better mechanical properties, and ascribed it to a combination of quite short treating time, enhanced nucleation rate and retarded grain growth. Conrad et al.Reference Conrad, Karam and Mannan3–Reference Conrad, Karam, Mannan and Sprecher5 also found that electropulsing significantly improved the nucleation rate of cold-worked copper resulting in much smaller grain size, and they suggested that it was caused by the acceleration of dislocation mobility under electropulsing. Xu et al.Reference Xu, Tang, Ding, Tian and Tian6 indicated that, compared with conventional annealing, electropulsing accelerated the recrystallization process of AZ31 Mg alloy and developed ultrafine grains due to the joint action of the thermal and electromigration effects. Although the exact mechanism of recrystallization behavior under EPT is not yet clarified in detail, there is a basic consensus on this issue: the thermal and electromigration effects are key factors for EPT-induced recrystallization.Reference Xu, Tang, Ding, Tian and Tian6–Reference Xu, Tang and Jiang10
Both thermal and electromigration effects of EPT are associated with the interaction of electrons and atoms.Reference Sprecher, Mannan and Conrad11 Hence, they are closely related to the properties of material.Reference Xu, Tang and Jiang10, Reference Antolovich and Conrad12 In other words, EPT would have different influences on the recrystallization behavior of different materials. Previous studiesReference Zhou, Xiao and Guo2–Reference Xu, Tang and Jiang10 mainly focused on EPT-induced recrystallization of some low-melting metals and alloys, e.g., Mg alloys and Cu alloys. However, little work has been done on high-melting materials. Tungsten (W), a refractory metal, is extensively used in missile penetrator applications and is proposed as a plasma-facing material for the diverter (plasma-facing) armor in deuterium (D)-tritium (T) fusion device subjected to radiation damage, as also to high temperatures and stresses in future nuclear fusion facilities like ITER; being built in Cadarache, France.Reference Bolt, Barabash, Krauss, Krauss, Linke, Neu, Suzuki and Yoshida13 Incidentally, the expression “ITER” means “the way” in Latin. Compared with Mg, Cu and other low-melting metals and alloys, W has higher melting temperature, higher density and better combination of strength, thermal expansion, and modulus retention at high temperatures. Effects of EPT on the recrystallization of W are supposed to be different from that of those low-melting metals and alloys.
In the present study, EPT is first used for recrystallization annealing of a rolled pure W. The conventional heat treatment (CHT) is also carried out for reference. Based on the comparison between these two different heating methods, the effects of EPT on the thermally activated recrystallization process of the rolled pure W are discussed.
II. EXPERIMENTAL
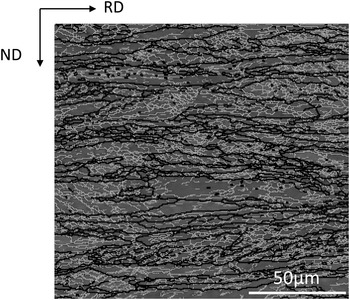
A rolled W plate with purity higher than 99.99% supplied by Advanced Technology & Materials Co., Ltd. (China) was selected as the investigated material. It was produced by powder sintering followed by warm rolling (∼1473 K) to 75% reduction in thickness (final thickness ∼3 mm). Figure 1 shows the microstructure on the transverse section [defined by the rolling direction (RD) and the normal direction (ND)] of the as-received W plate. It exhibits elongated grains and cell structures after warm rolling.
Microstructure of the W material deformed 75% by warm rolling.

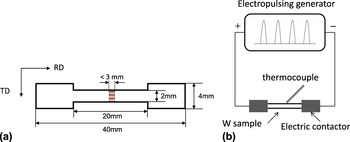
The W sample for EPT was cut into thin strips with a thickness of 1.5 mm. The EPT sample was designed with wider ends and narrower waist as shown in Fig. 2(a), for intense heating of the middle areas of the strips and to reduce the temperature of the two ends where two electrical contactors had been clamped during EPT. The length and width directions of the sample were parallel to RD and transverse direction (TD) of the original W plate, respectively. EPT was performed under ambient conditions. The schematic view of EPT process is shown in Fig. 2(b). Multiple electropulses with pulse duration of 70 μs were applied on the samples with a distance of 20 mm. A Hall effect sensor connected to an oscilloscope was used to monitor the current parameters during EPT including frequency, current pulse duration, root-mean-square (RMS) current, and current density amplitude. The parameters of EPT are listed in Table I. The surface temperature in the middle of the W sample [Fig. 2(a)], i.e., the hottest zone, was measured by a thermocouple. EPT was performed for 3.0, 4.5, 5.4, 5.8, 6.0, 7.0, and 9.0 s, respectively. After each EPT, the heated sample was cooled in natural air under ambient temperature.
(a) The sketch of the EPT sample with thickness of 1.5 mm. The middle area (<3 mm), the hottest zone during EPT, is the main part for temperature measurement, hardness test and microstructure observation. (b) The schematic view of EPT process.

Parameters of EPT subjected to the rolled pure W.

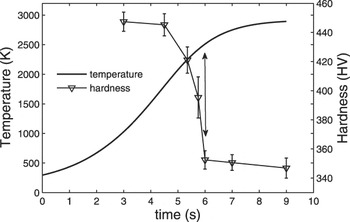
Curves of hardness and calculated temperature [by solving Eq. (6)] as functions of EPT time for the rolled pure W. The double-headed arrow indicates the temperature and hardness corresponding to the finish of recrystallization.

For comparison, CHT was carried out in a tube furnace under argon gas. The utilized W samples were cut into the size of 10 × 5 × 3 mm3. The heating rate was 5 K/min below 1273 K and 2 K/min above 1273 K, respectively. For measuring the conventional recrystallization temperature, annealing treatments were carried out at 1373–1773 K for 1 h. Then annealing for 20 min at the conventional recrystallization temperature was performed to obtain partly recrystallized samples. CHT samples were subjected to furnace heating, exposure to soaking stage and furnace cooling during conventional annealing.
Hardnesses of all the samples were measured by a Vickers microhardness tester (Japan). Each sample was indented at least 10 times under a load of 500 g for 20 s. The microstructure was examined using a scanning electron microscope (SEM; LEO model 1530, Czech Republic) equipped with a fully automated electron backscatter diffraction (EBSD) analysis system. EBSD images were obtained using a step-size of 1 μm. Based on the EBSD images, quantitative analysis of the recrystallization behavior was subsequently performed under the premise of two definitions: (i) recrystallized grain was a region with equivalent diameter >4 μm, a small amount of internal misorientations and continuous high-angle boundary over more than one-third of its perimeter; (ii) recrystallization fraction f was the number of pixels of recrystallized grains divided by the number of pixels of the complete EBSD image. For SEM observations, samples were ground to SiC4000 and then electropolished in a 3 wt% sodium hydroxide (NaOH) solution. For the EPT samples, microhardness tests and microstructure observations were carried out in the middle area (<3 mm) as shown in Fig. 2(a).
III. RESULTS
A. Microhardness evolution
The microhardness curve of the W samples after EPT is shown in Fig. 3. When the EPT time is below 4.5 s, the hardness is little changed. When the time increases to 5.4 s, a small drop in hardness is observed, indicating the onset of recrystallization. For slightly longer EPT time, hardness of the sample decreases sharply, and reaches a stable level (∼355 HV) at 6.0 s indicating the finish of recrystallization. Limited by the measurement range of the thermocouple, only the peak temperatures of EPT samples at 3.0 and 4.5 s were measured (see Table I). The temperature at 6.0 s could be predicted to be about 2510 K (see Sec. IV. A), which is the recrystallization temperature of the rolled pure W under EPT according to the hardness curve. The simulation and calculation of the temperature evolution during EPT is discussed in detail in Sec. IV.
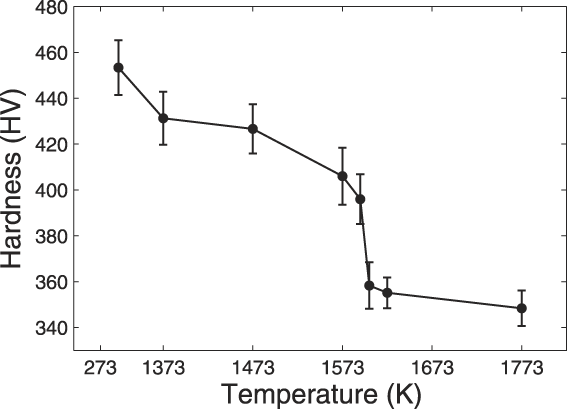
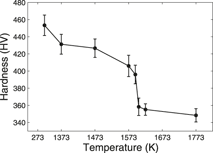
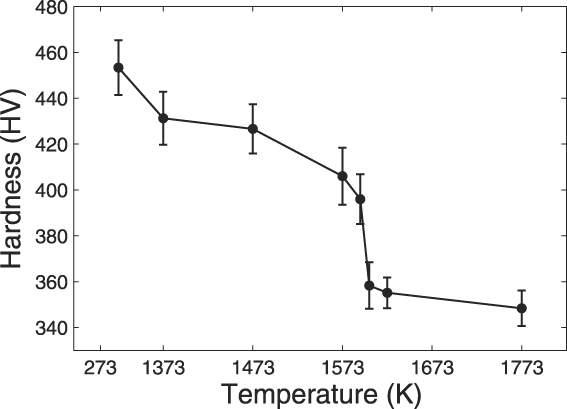
Figure 4 illustrates the hardness changes of the rolled pure W under CHT in a range of 1373–1773 K for 1 h. We observe a slight hardness decrease at 1373 K, and there is a plateau region from 1373 to 1473 K. Above 1473 K, a dramatic drop of hardness occurs until it reaches a steady state after 1603 K. This implies that recovery occurred after annealing at 1373 K, and the onset and finish temperatures of recrystallization were 1473 and 1603 K under CHT, respectively.
Hardness data of rolled pure W after conventional annealing at 1373–1773 K for 1 h.
B. Microstructure evolution
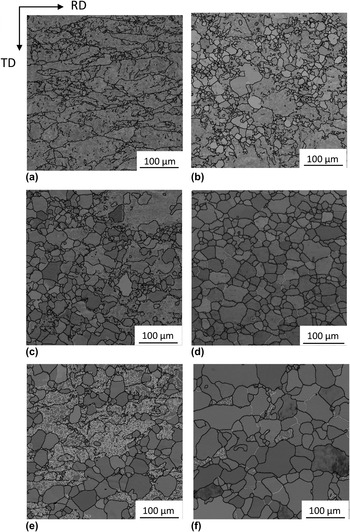
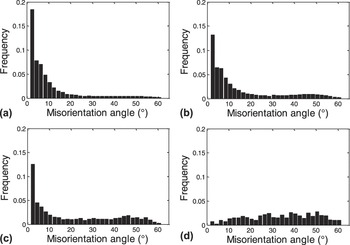
The microstructure evolutions under EPT and CHT were examined by EBSD technique. The EBSD images are illustrated in Fig. 5, where thick black lines indicate high-angle grain boundaries with misorientations >15°, and thin gray lines represent low-angle grain boundaries with misorientations in the range of 2–15°. Figures 5(a)–5(d) show the microstructures before EPT and after EPT for 5.4, 5.8, and 6.0 s, respectively, and the corresponding misorientation distributions are shown in Figure 6. For the original W sample, grains are elongated along RD and with lots of subgrains inside [Fig. 5(a)], resulting in a large number of low-angle misorientations [Fig. 6(a)]. After EPT for 5.4 s, substantial recovery takes place and some new recrystallized grains appear in the deformed microstructure [Fig. 5(b)], leading to a decrease in the amount of low-angle misorientations decrease [Fig. 6(b)]. The recrystallization fraction f is 25.8% with average recrystallized grain size of 11.5 μm. With increasing EPT time to 5.8 s, the recrystallization fraction f increases to 63.7% with average grain size of 16.4 μm and the number of low-angle misorientations further decreases [Fig. 6(c)]. When the EPT time rises to 6.0 s, full recrystallization is observed with average grain size of 21.8 μm as shown in Fig. 5(d). In this case, few low-angle misorientations remain while a lot of high-angle misorientations appear [Fig. 6(d)]. Figures 5(e) and 5(f) show the partly recrystallized and fully recrystallized microstructures after conventional annealing at 1603 K for 20 min and 1 h, respectively. Under CHT, the average grain size is 17.5 μm when the recrystallization fraction is 43%. It dramatically rises to 32.2 μm when fully recrystallization is achieved. This is much coarser than the fully recrystallized microstructure obtained by EPT.
EBSD images in the RD-TD plane of W samples: (a) the original sample; EPT samples for (b) 5.4 s; (c) 5.8 s; (d) 6.0 s; CHT samples annealed at 1603 K for (e) 20 min; (f) 1 h.

Misorientation distributions of W samples: (a) the original sample; EPT samples for (b) 5.4 s; (c) 5.8 s; (d) 6.0 s.

According to our experimental results, compared with CHT, EPT significantly increased the recrystallization temperature by ∼900 K, greatly shortened the recrystallization of the rolled pure W to 6.0 s, and noticeably refined the recrystallized grains.
IV. DISCUSSION
A. Temperature simulation of the rolled pure W under EPT
The middle area (<3 mm) of the samples, which is very short compared with the total length of the narrow waist (20 mm), is the hottest zone during EPT. The temperature evolution in this zone can be modeled and simulated. For simplifying the calculation, an assumption is made: there is no significant thermal conduction between the concerned area and its adjacent areas. An equation of the energy conservation during EPT can be then built:
 $$<![CDATA[$$\Delta Q_J - \Delta Q_C - \Delta Q_R = \Delta Q_A ,$$
where ∆QJ is the input energy in the form of Joule heat resulting from electropulsing; ∆QC and ∆QR are the convection and radiation between the heated sample and the ambient environment, respectively; and ∆QA is the heat absorbed by the W sample. According to Ref. Reference Zhou, Zhu and Xie14, we get:
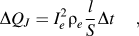 $$<![CDATA[$$\Delta Q_J = I_e ^2 \rho _e {l \over S}\Delta t,$$
 $$<![CDATA[$$\Delta Q_C = 2(w + d)h_a (T - T_0 )l\Delta t,$$
 $$<![CDATA[$$\Delta Q_R = 2(w + d){\rm{\varepsilon }}_0 {\rm{\sigma }}_b (T^4 - T_0 ^4 )l\Delta t,$$
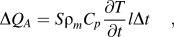 $$<![CDATA[$$\Delta Q_A = S{\rm{\rho }}_m C_p {{\partial T} \over {\partial t}}l\Delta t,$$
where Ie is the current RMS value of EPT, ρe the electrical resistivity, l the length of the middle area of the EPT sample, w the width of the sample, d the thickness of the sample, S the cross-sectional area of the sample, ha the transfer coefficient between the sample and the ambient air, ε0 the radiancy, σb the Stefan-Boltzmann constant, ρm the density, Cp the specific heat, T 0 the ambient temperature, t the EPT time, and T the absolute temperature of the sample. According to Eqs. (1)–(5), an equation between the temperature T and the EPT time t could be established as:
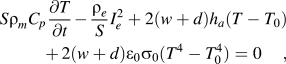 $$<![CDATA[$$S{\rm{\rho }}_m C_p {{\partial T} \over {\partial t}} - {{{\rm{\rho }}_e } \over S}I_e^2 + 2(w + d)h_a (T - T_0 ) +\, 2(w + d){\rm{\varepsilon }}_0 {\rm{\sigma }}_0 (T^4 - T_0^4 ) = 0,$$
which could be solved by 4th order Runge-Kutta algorithm.Reference Butcher15 The parameters used for calculation were w = 2 × 10⁻³ m, d = 1.5 × 10⁻³ m, ρm = 19.3 × 10³ kg/m3, S = 3 × 10⁻⁶ m2, T 0 = 298 K, Ie = 227.67 A, ha = 127 W/(m2·K), ε0 = 0.3,Reference Djilkibaev16 ρe = [9.9 + 0.01 × 2.9 × (T− 473)] × 10−8 Ω m,Reference Dekker and Lodder17 Cp = 135.165 − 6.494 × 10⁵T −2 + 9.078 × 10⁻³T + 23.029 × 10⁻¹⁰T 3 J/(kg·K).Reference Wang, Tang, Feng and Wu18 The calculated temperature curve is shown in Fig. 3. The calculated values are consistent with the measured values at low temperatures (see Table I). The validity of the calculated values for a higher temperature range is discussed in Sec. IV. C. According to the temperature and hardness curves in Fig. 3, the onset and finish temperature of recrystallization of the rolled pure W under EPT are about 2272 and 2510 K, respectively.
B. Grain refining effect of EPT on the rolled pure W
Figure 5 indicates that EPT can generate much finer recrystallized grains than CHT. Generally, recrystallization contains two stages: nucleation and nuclei growth. They are both related to the final size of recrystallized grains. Higher nucleation rate can result in much smaller grains.Reference Humphreys and Hatherly19 From the data of recrystallization fraction and mean grain size based on the EBSD images of EPT and CHT samples shown in Fig. 5, one can find that the grain size increases much slowly from partial recrystallization to full recrystallization under EPT. It indicates that EPT can significantly increase the nucleation rate compared with CHT. Nucleation process normally connects with the coalescence of subgrains, which can lead to the decrease of low-angle misorientations as shown in Fig. 6, and dislocation glide and climb play an important role in this process.Reference Humphreys and Hatherly19 Vacancy diffusion is considered to be a controlling factor in dislocation climb.Reference Yu and Mao20 During EPT, the flux of vacancies associates with two effects: thermal and electromigration effects of EPT. They can be written asReference Xu, Tang and Jiang10:
 $$<![CDATA[$$j_{th} = {{D_0 C_0 {\rm{\tau }}_p Q_v {\rm{\rho }}_e t_0 N_l I_e^2 } \over {2(R_0 - r_0 )C_P {\rm{\rho }}_m S^2 RT^2 }}\exp \left( { - {{Q_d } \over {RT}}} \right),$$
 $$<![CDATA[$$j_{em} = {{2D_0 Z^* e{\rm{\rho }}_e {\rm{\tau }}_p fN_l J_m } \over {{\rm{\pi }}\kappa T}}\exp \left( { - {{Q_d } \over {RT}}} \right),$$
 $$<![CDATA[$$Q_d = Q_m + Q_v ,$$
where jth and jem are the flux of vacancies contributed by the thermal fluctuation and electromigration effects respectively, D 0 the diffusion preexponential factor, C 0 the vacancy migration preexponential factor, τp the current pulse duration, Qv the activation energy for vacancy formation, Qd the activation energy for vacancy diffusion, Qm the activation energy for vacancy migration, t 0 the unit time, Nl the atom density, R 0 and r 0 the distances of the boundaries conditions, R the gas constant, Z* the effective valence, e the electron charge, f the frequency of the pulse, Jm the amplitude current density, and κ the Boltzmann constant.
For CHT, the flux of vacancies contributed by the normal temperature field, jn, can be determined byReference Xu, Tang and Jiang10:
 $$<![CDATA[$$j_n = {{D_0 C_0 N_l } \over {R_0 - r_0 }}\exp \left( { - {{Q_d + Q_m } \over {RT}}} \right).$$
To investigate the differences in magnitudes of vacancy fluxes between EPT and CHT, two ratios q 1 and q 2are introduced as:
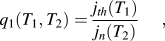 $$<![CDATA[$$q_1 (T_1 ,T_2 ) = {{j_{th} (T_1 )} \over {j_n (T_2 )}},$$
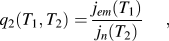 $$<![CDATA[$$q_2 (T_1 ,T_2 ) = {{j_{em} (T_1 )} \over {j_n (T_2 )}},$$
where T 1 and T 2 are the temperatures at which recrystallization occurred under EPT and CHT, respectively. Combining Eqs. (7)–(10), the parameters used for Eqs. (11) and (12) are: Qv = 6.82 × T + 3.32 × 10⁵ J/mol,Reference Satta, Willaime and de Gironcoli21Qm = 31.2 × T + 1.14 × 10⁵ J/mol,Reference Satta, Willaime and de Gironcoli21t 0 = 1 s, R 0 = 6.04 × 10⁻⁶ m, r 0 = 2.74 × 10⁻¹⁰ m, R = 8.314 J/(mol·K), Z* = 10,Reference Nabarro22C 0 = 24.5,Reference Park, Huang, Siegel and Balluffi23e = 1.6 × 10⁻¹⁹ C, κ = 1.38 × 10⁻²³ J/K, f = 700 HZ, τp = 70 μs, and Jm = 4.27 × 10⁸ A/m2.
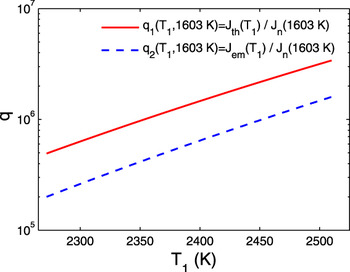
Based on the experimental results, T 1 is in the range of 2272–2510 K, and the value of T 2 is taken to be the conventional recrystallization temperature, 1603 K, for the sake of simplification. The calculated values of the two ratios are illustrated in Fig. 7. One can see that jth and jem are about 6 orders larger than jn in magnitude, and additionally, jth is much larger than jem. It suggests that much larger vacancy flux can be produced under EPT due to the thermal and electromigration effects of electropulsing when compared with CHT, and between the thermal and electromigration processes within the electropulsing, the thermal effect is more dominant in this study. The huge vacancy flux under EPT leads to significant promotion of dislocation rearrangement and consequently enhancement of the nucleation rate, which results in finer recrystallization grains.
The ratios of the vacancy fluxes contributed by the thermal effect (q 1) and electromigration effect (q 2) of EPT (2272–2520 K) to the one of CHT (1603 K).

C. Accelerated recrystallization of the rolled pure W under EPT at high temperatures
The misorientation distributions of the EPT samples shown in Fig. 6 indicate that low-angle grain boundaries are gradually transformed to high-angle grain boundaries with increasing recrystallization fraction due to the rearrangement of dislocations, and they almost disappeared when full recrystallization was achieved. Grain boundary migration by means of self-diffusion plays a key role in recrystallization.Reference Humphreys and Hatherly19 Thus the flux of vacancies accumulated during the whole EPT process might be a potential parameter to evaluate the extent of recrystallization. Eqs. (7)–(9) imply that temperature is an important factor affecting the vacancy diffusion. Since the EPT samples were air-cooled after EPT, the samples would maintain relatively high temperatures for a while. This could also contribute to the fluence of vacancies. Taking into account the cooling process, a model for the whole EPT process is built as follows.
There was no input energy in cooling process, namely, ∆QJ = 0, the second term on the left-hand side of Eq. (6) should be neglected. Consequently, temperature during the whole EPT process can be determined by:
 $$<![CDATA[$$\left\{ \matrix{ S{\rm{\rho }}_m C_p {{\partial T} \over {\partial t}} - {{\rho _e } \over S}I_e^2 + 2(w + d)h_a (T - T_0 ) + 2(w + d){\rm{\varepsilon }}_0 {\rm{\sigma }}_0 (T^4 - T_0^4 ) = 0,\,\,\,\,{\rm{ }}0 \,\,\le \,t \,\le\, t_1 , \hfill \cr S{\rm{\rho }}_m C_p {{\partial T} \over {\partial t}} + 2(w + d)h_a (T - T_0 ) + 2(w + d){\rm{\varepsilon }}_0 {\rm{\sigma }}_0 (T^4 - T_0^4 ) = 0,\,\,\,\,\,\,\,\,\,\,\,\,\,\,\,\,\,\,\,\,\,{\rm{ }}t_1 \,\lt \,t \,\le \,t_2 , \hfill \cr} \right.$$
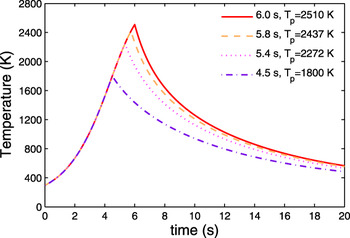
where t 1 is the EPT time; t 2 is the time that the samples are almost cooled. According to Eq. (13), the temperature curves with different EPT time can be calculated as illustrated in Fig. 8. The fluence of vacancies under EPT, J 1, can be calculated by:
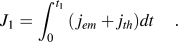 $$<![CDATA[$$J_1 = \int_0^{t_1 } {(\,j_{em} + j_{th} )dt} .$$
The calculated temperature evolution of heating and cooling processes during EPT with different EPT time. Peak temperatures of the four EPT processes are listed in the legend.

For the cooling process, only normal temperature field exists. Thus, the fluence of vacancies during cooling, J 2, is calculated by:
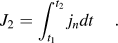 $$<![CDATA[$$J_2 = \int_{t_1 }^{t_2 } {j_n dt} .$$
The fluence of vacancy of the whole process J is,
 $$<![CDATA[$$J = J_1 + J_2 .$$
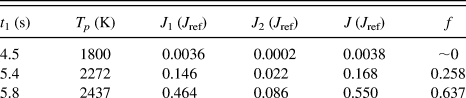
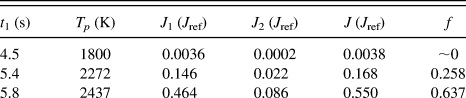
Taking t 2 = 20 s, we calculate J 1, J 2, and J when t 1 = 4.5, 5.4, 5.8, and 6.0 s, respectively, as listed in Table II. In the table, the vacancy fluences are shown as ratios to a reference: J/Jref. The reference Jref is set as the vacancy fluence for t 1 = 6.0 s, which is the critical point for full recrystallization. J 2 turns out to be much smaller than the corresponding J 1. This means the air-cooling process following EPT made a negligible contribution to the recrystallization of the rolled pure W. When t 1 is 4.5 s with peak temperature TP of 1800 K, the ratio of J/Jref is almost zero. It indicates that little vacancy fluence is produced and tiny microstructure changes occur in the W sample. This is consistent with the little hardness change noted (i.e., the recrystallization fraction f is ∼0) at 4.5 s as shown in Fig. 3. When t 1 is 5.4 s, the peak temperature TP rises to 2272 K with the ratio of J/Jref = 16.8%, indicating some valid vacancy fluence is formed. When t 1 slightly rises to 5.8 s with TP of 2437 K, J/Jref rapidly reaches 55%. The variation mode of the calculated values of J/Jref are basically in accordance with that of the measured values of recrystallization fraction f based on the EBSD images Figs. 5(b)–5(d). This implies that, on the one hand, the vacancy diffusion model is proper for the evaluation of microstructure evolution during the EPT-induced recrystallization in our study, and on the other hand, the calculated temperature values which are important for the vacancy diffusion model are reasonable. Moreover, the data listed in Table II suggests the W sample is very sluggish during the short period at the temperatures below 1800 K. When the temperature rises to a much higher level, substantial vacancies are activated and the vacancy fluence rises sharply with further increasing temperature.
The calculated values of peak temperature Tp, vacancy fluence and recrystallization fraction f for different EPT time t 1.
Note:
J 1 is the vacancy fluence under EPT; J 2 is the vacancy fluence during cooling; J is the vacancy fluence for the whole process. J 1, J 2, and J are shown as ratios to a reference Jref which is the total vacancy fluence for EPT at t 1= 6.0 s when full recrystallization is achieved.
It is very clear that both temperature and time noticeably contribute to the thermally activated recrystallization behavior under EPT. The two factors are linked up by the heating rate. In this study, high heating rate was generated by the huge Joule thermal effect of EPT (see Fig. 3). Thus it took a very short time to go through the low-temperature range, where W was very inertial, and approach to quite high temperatures. With the aid of the great thermal and electromigration effects of EPT in the high-temperature range, EPT induced full recrystallization within only several seconds. The view of higher heating rate resulting in higher recrystallization temperature has been confirmed by many investigations.Reference Denissen, Denissen, Liebe and van Rijswick24, Reference Muljono, Ferry and Dunne25 Our pervious studyReference Yuan, Greuner, Böswirth, Krieger, Luo, Xu, Fu, Li and Liu26 also showed that a very high heating rate (∼2000 K/s) generated by high heat flux loads could significantly elevate the recrystallization temperature of W. However, our results in this article is in contrast with some previous studiesReference Zhou, Xiao and Guo2, Reference Xu, Tang, Ding, Tian and Tian6, Reference Jiang, Tang, Shekc and Liu7 in which EPT decreased the recrystallization temperature of some Mg alloys and Cu alloys. From the Eqs. (7) and (8), we can see that the thermal and electromigration effects of EPT are closely correlated to the properties of materials, especially to the activation energy for vacancy diffusion Qd which is in the numerator of exponent. Qd of W is about five times higher than that of Mg and about three times higher than Cu.Reference Satta, Willaime and de Gironcoli21, Reference Janot, Mallejac and George27, Reference Foiles, Baskes and Daw28 It is possible to assume that the active temperature range of W is much higher than that of Mg and Cu under the rapid heating process of EPT. Additionally, probably due to the different relative contributions of the thermal and electromigration effects of EPT on the recrystallization behavior of different materials (thermal effect is more dominant for W in this work), opposite phenomena are observed. The exact relationship between the thermal and electromigration effects of EPT on the recrystallization will be clarified in our future work.
V. CONCLUSION
EPT has been first applied to the recrystallization annealing of the rolled pure W. Compared with CHT, EPT raised the recrystallization temperature of the rolled pure W by about 900 K, significantly accelerated the recrystallization process and refined the recrystallized grains. The increase of recrystallization temperature of the rolled pure W under EPT was explained by a combination of high heating rate induced by EPT and high activation energy for vacancy diffusion of W. The accelerated recrystallization and grain refinement were attributed to the intensive vacancy diffusion under EPT at relatively high temperatures.
ACKNOWLEDGMENTS
This work was supported by National Magnetic Confinement Fusion Science Program of China under Grant No. 2009GB106003 and the National Nature Science Foundation of China under Contract Nos. 51071095 and 50971077.