1. Introduction
Flow over rotating circular cylinders is a classical research topic due to its fundamental connection to the Robins–Magnus effect (Robins Reference Robins and Hutton1805; Magnus Reference Magnus1853; Barkla & Auchterlonie Reference Barkla and Auchterlonie1971; Borg Reference Borg1986; Sengupta & Talla Reference Sengupta and Talla2004; Anderson Reference Anderson2011). This canonical flow configuration serves as a critical testbed for diverse scientific and engineering pursuits, including wind-assisted propulsion (Flettner Reference Flettner1925; Seifert Reference Sedaghat2012; Sedaghat Reference Schulmeister, Dahl, Weymouth and Triantafyllou2014) and advanced flow control techniques (Schulmeister et al. Reference Schmid2017; Fan et al. Reference Fan, Yang, Wang, Triantafyllou and Karniadakis2020; Yu et al. Reference Yang, Wang, Guo and Zhang2020; Bao et al. Reference Levold2022; Wu et al. Reference Williamson2022). The enduring interest in this flow is further amplified by the remarkably rich wake dynamics that it exhibits.
Among the early numerical investigations of two-dimensional flows over rotating circular cylinders, Nair & Sengupta (Reference Nair and Sengupta1998) and Sengupta et al. (Reference Sengupta, Kasliwal, De and Nair2003) examined the flow instabilities at high rotation rates, providing important early insights into the complexity of this problem. A broad and sustained body of research from multiple groups has since contributed to significantly advancing the understanding of the rich wake dynamics exhibited by rotating cylinders (Stojković et al. Reference Stojković, Breuer and Durst2002, Reference Stojković, Schön, Breuer and Durst2003; Mittal & Kumar Reference Mittal and Kumar2003; Padrino & Joseph Reference Padrino and Joseph2006; Pralits, Brandt & Giannetti Reference Pralits, Brandt and Giannetti2010). At low rotation rates, the cylinder produces a standard Kármán vortex street as a result of linear temporal instability followed by nonlinear stabilisation (Eckhaus Reference Eckhaus1965; Sreenivasan, Strykowski & Olinger Reference Sreenivasan, Strykowski and Olinger1987; Drazin & Reid Reference Drazin and Reid2004; Dipankar, Sengupta & Talla Reference Dipankar, Sengupta and Talla2007; Sengupta, Singh & Suman Reference Sengupta, Singh and Suman2010; Sengupta Reference Sengupta2012). As the rotation rate increases, the retreating-side shear layer weakens, eventually suppressing shedding and leading to a steady flow state. While unsteadiness can re-emerge at higher rotation rates, the flow generally tends towards stability with increasing
 $\alpha$
. Interestingly, there exist multiple solutions for the steady flow state at high rotation rates (Pralits et al. Reference Pralits, Brandt and Giannetti2010; Rao et al. Reference Rao, Leontini, Thompson and Hourigan2013b
; Thompson et al. Reference Thompson, Rao, Leontini and Hourigan2014). A comprehensive analysis of the complex bifurcation scenario of two-dimensional laminar flow past rotating cylinders is provided by Sierra et al. (Reference Sierra, Fabre, Citro and Giannetti2020) and Brøns (Reference Brøns2021). At high Reynolds numbers, two-dimensional flows over rotating cylinders are reported to exhibit multiscale temporal instabilities that emerge from complex flow bifurcations and localised vorticity dynamics (Sengupta et al. Reference Sengupta, Kasliwal, De and Nair2003; Sundaram et al. Reference Sundaram, Sengupta, Sengupta and Suman2021; Suman et al. Reference Suman, Sundaram, Puttam, Sengupta and Sengupta2022; Sengupta, Kumar & Kumar Reference Sengupta, Kumar and Kumar2025).
The two-dimensional flows are susceptible to intrinsic three-dimensional instabilities (Radi et al. Reference Radi, Thompson, Rao, Hourigan and Sheridan2013; Rao et al. Reference Rao, Leontini, Thompson and Hourigan2013a , Reference Rao, Leontini, Thompson and Houriganb ; Pralits, Giannetti & Brandt Reference Pralits, Giannetti and Brandt2013; Rao et al. Reference Rao, Radi, Leontini, Thompson, Sheridan and Hourigan2015; Navrose, Meena, & Mittal Reference Navrose, Meena and Mittal2015; Munir et al. Reference Munir, Zhao, Wu and Lu2019). At low rotation rates, the wake exhibits Mode A and Mode B instabilities similar to those of non-rotating cylinders (Williamson Reference Wu, Römer, Axtmann and Rist1996). As rotation increases, centrifugal effects become dominant, triggering subharmonic Mode C and Mode D instabilities. Of particular relevance to the present study are the high-rotation instabilities, Mode E and Mode F, which manifest as spanwise-periodic structures driven by centrifugal mechanisms (Taylor Reference Taylor1923; Drazin & Reid Reference Drazin and Reid2004) near the cylinder surface on steady two-dimensional base flows. These intrinsic three-dimensional effects are also observed in the wakes of rotating cylinders at higher Reynolds numbers (Aljure et al. Reference Aljure, Rodríguez, Lehmkuhl, Pérez-Segarra and Oliva2015) as well as those undergoing flow-induced vibration (Bourguet Reference Bourguet2020). The diversity of these two- and three-dimensional instability modes, driven by different physical mechanisms, reveals the rich complexity underlying rotating cylinder wake dynamics.
In engineering applications like fuel-saving rotor sails on vessels, the wake dynamics of rotating cylinders is inevitably influenced by end boundary conditions. These boundaries act as extrinsic sources that drive the development of three-dimensional flows. The effects of these end boundary conditions on wake behaviour have been extensively investigated in non-rotating cylindrical structures (Slaouti & Gerrard Reference Slaouti and Gerrard1981; Ramberg Reference Ramberg1983; Williamson Reference Williamson1989; Park & Lee Reference Park and Lee2000; Roh & Park Reference Roh and Park2003; Inoue & Sakuragi Reference Inoue and Sakuragi2008; Wang & Zhou Reference Wang and Zhou2009; Krajnović Reference Krajnović2011; Sumner Reference Sumner2013; Mittal, Pandi & Hore Reference Mittal, Pandi and Hore2021; Cao et al. Reference Cao, Tamura, Zhou, Bao and Han2022; Zhang et al. Reference Zhang, Bao, Han and Zhou2023). The free end of the cylinder generally induces downward flow from the free end to the central wake. The ground effects lead to the formation of horseshoe vortices at the junctions of the cylinder and ground, and can induce upward flow similar to that of the free end. Under these effects, the vortex-shedding process exhibits a range of intricate flow phenomena including oblique shedding, vortex dislocation, cellular shedding and frequency modulation.
The end effect is also an important consideration for lifting surfaces like wings. For aerofoils, finite wing theory has long been established to account for tip-vortex effects on the aerodynamic performance of high-speed aircraft (Anderson Reference Anderson2011). Recent interest in low-altitude micro air vehicles has also generated considerable research into separated flows over finite wings (Taira & Colonius Reference Taira and Colonius2009; DeVoria & Mohseni Reference DeVoria and Mohseni2017; Zhang et al. Reference Zhang, Hayostek, Amitay, Burtsev, Theofilis and Taira2020a , Reference Zhang, Hayostek, Amitay, He, Theofilis and Tairab ; Zhang & Taira Reference Zhang and Taira2022; Pandi & Mittal Reference Pandi and Mittal2023; Smith & Taira Reference Smith and Taira2024; Zhu, Wang & Liu Reference Zhu, Wang and Liu2024). These studies revealed that the downwash effects induced by the tip vortices can stabilise leading-edge vortices on low-aspect-ratio wings, thereby providing enhanced vortex lift and improved aerodynamic performance. The literature on both bluff bodies and lifting surfaces consistently demonstrates that three-dimensional flows under the influence of end boundary conditions exhibit markedly different characteristics compared with their two-dimensional counterparts.
The focus of the present study is the three-dimensional wake dynamics of finite-aspect-ratio rotating circular cylinders, which bear resemblance to both non-rotating bluff bodies and wings, but have received much less attention in the literature. Among the few who have addressed this problem, Mittal (Reference Mittal2004) studied the flows over rotating cylinders confined by no-slip walls. It was revealed that although the two-dimensional flow in the same configuration is stable, the inhomogeneous end boundary induces centrifugal instabilities along the span. In addition, the presence of a no-slip sidewall can result in flow separation near the cylinder ends, leading to a loss in lift and an increase in drag. Yang et al. (Reference Yang, Wang, Guo and Zhang2023) provided critical insights into the three-dimensional instabilities of rotating bodies, filling a significant gap in the literature regarding short cylinders with free ends. Through a rigorous application of direct numerical simulation (DNS) and global stability analysis, they mapped the stability boundaries for aspect ratios
 ${\rm AR} \le 2$
, revealing that finite-length effects significantly delay the onset of instability compared with infinite cylinders. They showed that while moderate rotation suppresses the classical vortex street, high rotation triggers complex multimodal instabilities. Their findings highlight the sensitivity of the wake to aspect ratio, noting that shorter cylinders generally exhibit higher stability thresholds than longer configurations. Massaro et al. (Reference Massaro, Karp, Jansson, Markidis and Schlatter2024) carried out DNS of the flows over a wall-mounted cylinder at
 $ \textit{Re}=3000$
, revealing the large-scale vortical motion and its profound impact on drag, and highlighting the critical importance of considering the cylinder–wall interaction for accurate performance prediction and design optimisation in practical applications. On the experimental side, a series of wind tunnel tests have been carried out to study the aerodynamic performance of rotor sails, mainly focusing on the aerodynamic forces (Bordogna et al. Reference Bordogna, Muggiasca, Giappino, Belloli, Keuning, Huijsmans and Van’t Veer2019; Ma et al. Reference Ma, Liu, Jia, Jin and Ma2022) and multirotor wake interactions (Bordogna et al. Reference Bordogna, Muggiasca, Giappino, Belloli, Keuning and Huijsmans2020; Chen, Wang & Liu Reference Chen, Wang and Liu2023).
Despite the extensive characterisation of end-effect phenomena in stationary cylinders and finite wings, these mechanisms remain inadequately resolved for finite rotating cylinders. While Yang et al. (Reference Yang, Wang, Guo and Zhang2023) recently provided a rigorous global stability analysis of the wake dynamics, their study was confined to short cylinders (
 ${\rm AR} \le 2$
) and focused primarily on the onset of instability modes. Consequently, the fundamental physical processes dictating the formation, organisation and evolution of three-dimensional vortical structures in broader parameter spaces remain largely unclear. The present work addresses this gap by extending the parameter coverage to longer geometries and offering a deeper understanding of the free-end effects. By systematically varying the rotation rate and aspect ratio, we aim to identify the dominant flow regimes and transition boundaries, elucidate the mechanisms governing wake vortical structure evolution under different parameters, quantify the resulting impact on lift and drag characteristics and establish a comprehensive understanding of three-dimensional wake dynamics in rotating finite cylinders. In what follows, we present the computational set-up and its validation in § 2. The results are discussed in § 3, including the formation of tip vortices, classification and characterisation of different wake types, analysis of aerodynamic forces and assessment of end-plate effects on wake behaviour. Finally, we summarise our key findings in § 4.
2. Computational set-up
2.1. Problem description
We carry out DNS of incompressible flows over rotating cylinders with finite lengths, as shown in figure 1. A circular cylinder of diameter
 $D$
and spanwise length
 $H$
is subjected to a uniform inflow with velocity
 $U_{\infty }$
in the
 $x$
direction. The cylinder rotates clockwise about the
 $z$
axis so that it generates a positive lift force in the
 $y$
direction. The aspect ratio of the finite cylinder is defined as
 ${\rm AR}=H/D$
, and is varied from 2 to 12 in this study. Denoting the angular velocity of the rotation as
 $\varOmega$
, the non-dimensional rotation rate of the cylinder is expressed as
 $\alpha =\varOmega R/U_{\infty }$
(where
 $R=D/2$
is the radius of the cylinder), and ranges from 0 to 5. The side where the cylinder’s surface velocity is parallel to the free stream is termed the retreating side (
 $\theta = \pi /2$
). The opposite side, where the surface velocity opposes the free stream, is termed the advancing side (
 $\theta = 3\pi /2$
).
The computational set-up and mesh design for flow over a rotating finite cylinder. (
 $a$
) Problem set-up. (
 $b$
) Perspective view, (c) top view and (d) side view of the computational domain and mesh. Shown is the case of
 $({\rm AR},\alpha )=(12,5)$
. The vortical structures are visualised by iso-surfaces of
 $Q=1$
in yellow, where
 $Q$
is the second invariant of the velocity gradient tensor.

The Reynolds number,
 $ \textit{Re} = U_{\infty }D/\nu$
(where
 $\nu$
is the kinematic viscosity of fluid), is fixed at 150. This Reynolds number is strategically chosen to ensure that the flow remains laminar while still allowing a rich variety of flow phenomena to develop. In particular, Rao et al. (Reference Rao, Radi, Leontini, Thompson, Sheridan and Hourigan2015) noted that at
 $ \textit{Re}=150$
, the flow over a two-dimensional rotating cylinder exhibits only weak intrinsic three-dimensionality. This specific characteristic allows for a detailed examination of the end-boundary effects without significant interference from intrinsic instabilities. Hereafter, we report the variables in their non-dimensional forms by normalising spatial quantities with
 $D$
, velocity with
 $U_{\infty }$
, time with
 $D/U_{\infty }$
and frequency with
 $U_\infty /D$
.
2.2. Numerical methods
The three-dimensional flows over the rotating finite cylinder are studied by numerically solving the incompressible Navier–Stokes equations:
 \begin{align} \frac {\partial \boldsymbol{u}}{\partial t} + \boldsymbol{u} \boldsymbol{\cdot }\boldsymbol{\nabla } \boldsymbol{u} & = -\boldsymbol{\nabla } p +\displaystyle {\frac {1}{Re}} {\nabla }^2 \boldsymbol{u}, \\[-12pt] \nonumber \end{align}
 \begin{align} \boldsymbol{\nabla } \boldsymbol{\cdot }\boldsymbol{u} & = 0, \\[10pt] \nonumber \end{align}
where
 $\boldsymbol{u}=(u_x,u_y,u_z)$
is the velocity vector and
 $p$
is the pressure. The finite-volume-based flow solver pimpleFoam from the open-source CFD toolbox OpenFOAM is used for solving the three-dimensional Navier–Stokes equations with second-order accuracy in both space and time. The rectangular computational domain covers
 $(x,y,z)\in [-15D, 30D]\times [-15D, 15D]\times [-(H/2+10D), (H/2+10D)]$
, as shown in figure 1. This results in a maximum blockage ratio of 1.25 % for the cases with
 ${\rm AR}=12$
. The inlet is prescribed with a uniform velocity in the
 $x$
direction of
 $U_\infty$
. The surfaces of the cylinders are treated as no-slip so that the boundary-layer flow moves along with the linear velocity of the cylinder surface. The side boundaries are considered as slip. The zero-gradient condition is applied to the outlet for velocity, where a reference pressure
 $p=0$
is specified. The maximum number of control volumes is approximately
 $1.6\times 10^7$
for cases with
 ${\rm AR}=12$
. The mesh is clustered around and in the near wake of the cylinder, as shown in figure 1(
 $b$
–
 $d$
).
The lift and drag forces are reported in their non-dimensional forms:
 \begin{align} C_L = \displaystyle {\frac {\displaystyle {\int }_S(-p\boldsymbol{n}+\boldsymbol{\tau })\boldsymbol{\cdot }\boldsymbol{e_y}\,\mathrm{d}S}{U_{\infty }^2HD/2}}, \\[-12pt] \nonumber \end{align}
 \begin{align} C_D = \displaystyle {\frac {\displaystyle {\int }_S(-p\boldsymbol{n}+\boldsymbol{\tau })\boldsymbol{\cdot }\boldsymbol{e_x}\,\mathrm{d}S}{U_{\infty }^2HD/2}}, \\[10pt] \nonumber \end{align}
where
 $S$
denotes the cylinder surface and
 $\boldsymbol{n}$
is the unit normal vector pointing outward from the cylinder surface. Unit vectors
 $\boldsymbol{e_y}$
and
 $\boldsymbol{e_x}$
point in the lift and drag directions, respectively, and
 $\boldsymbol{\tau }=\mu \boldsymbol{\omega }\times \boldsymbol{n}$
is the skin-friction vector (
 $\mu$
is the dynamic viscosity of fluid and
 $\boldsymbol{\omega }=\boldsymbol{\nabla }\times \boldsymbol{u}$
is the vorticity vector).
2.3. Validation
To ensure the fidelity of the numerical results, we employ a two-tiered validation process, beginning with the simulation of two-dimensional flow over a rotating cylinder at
 $ \textit{Re}=200$
. As illustrated in figures 2(a) and 2(b), the present study predicts a monotonic increase in the time-averaged lift coefficient (
 $\overline {C_l}$
) as the rotation rate
 $\alpha$
rises, while the mean drag coefficient (
 $\overline {C_d}$
) remains significantly lower in magnitude. The fluctuating force coefficients,
 $C_l^{\prime }$
and
 $C_d^{\prime }$
, exhibit complex variations that reflect the intricate transitions between steady and unsteady flow regimes as mentioned in § 1. These aerodynamic coefficients demonstrate excellent agreement with the reference data from Mittal & Kumar (Reference Mittal and Kumar2003) across the entire range of
 $\alpha$
investigated. The accuracy of the near-body flow physics is further verified by comparing the surface pressure distribution (
 $C_p$
) and spanwise vorticity (
 $\omega _z$
) at high rotation rates (
 $\alpha = 3,\ 4$
and
 $5$
) with the results of Padrino & Joseph (Reference Padrino and Joseph2006). As shown in figures 2(c) and 2(d), the profiles from our results exhibit a nearly perfect overlap with the literature data. These results confirm that the current numerical framework accurately captures the boundary-layer dynamics and surface loading characteristics of the rotating cylinders.
Validation of the computational approaches. (
 $a$
,
 $b$
) Comparison of the mean and root-mean-square force coefficients between our results and those from Mittal & Kumar (Reference Mittal and Kumar2003) for
 $ \textit{Re}=200$
. (
 $c$
,
 $d$
) Comparison of surface vorticity and pressures distributions between our results and those from Padrino & Joseph (Reference Padrino and Joseph2006) for
 $\alpha =3,\ 4$
and 5.

We further verify the spatial and temporal discretisation dependency for three-dimensional flows over finite rotating cylinders (
 ${\rm AR}=10$
) at
 $ \textit{Re}=150$
. We design two sets of meshes (medium and refined) as detailed in table 1, with the grid resolution considerably enhanced in the circumferential, spanwise and radial directions of the cylinder in the refined mesh. The two meshes are tested in two cases, i.e.
 $\alpha =1$
for which the flow is highly unstable and
 $\alpha =5$
representing the highest rotation rate. For
 $\alpha =1$
, the temporal traces of the lift (
 $C_L$
) and drag (
 $C_D$
) coefficients match closely between the medium and refined meshes, with time-averaged values differing by less than 1 %. The vortical structures produced by the two meshes exhibit no discernible difference, as shown in figure 3(
 $c$
). In the case of the largest rotation rate
 $\alpha =5$
, the aerodynamic coefficients from the two meshes overlap in the initial phase but diverge after
 $t \approx 10$
due to the chaotic nature of the wake. Despite this divergence, the time-averaged force coefficients remain very close (e.g.
 $\overline {C_L} = 8.650$
for medium versus
 $8.496$
for refined), indicating that the statistical properties of the flow are well captured. Based on these comparisons, the medium grid resolution is determined to be sufficient for the current study and is used for the simulations reported in subsequent sections.
Set-ups of the different meshes for the case of
 $(\alpha ,{\rm AR})=(5, 10)$
. Here
 $N_{\theta }$
and
 $N_z$
are the numbers of grid points on the cylinder surface and along the spanwise direction,
 $\Delta r_1$
is the height of the first layer of mesh on the cylinder surface,
 $N_{CV}$
is the total number of control volumes and
 $\Delta t$
is the time step.

Mesh dependency test for the three-dimensional simulations. (
 $a$
,
 $b$
) Comparison of the time histories of aerodynamic forces for
 $({\rm AR},\alpha )=(10,1)$
and
 $({\rm AR},\alpha )=(10,5)$
between the medium and refined meshes.
 $(c)$
Vortical structures visualised by iso-surfaces of
 $Q=1$
at
 $t=50$
for
 $({\rm AR},\alpha )=(10,1)$
between the medium and refine meshes.

3. Results
We begin the discussions of results by examining the characteristics of tip vortices influenced by the rotation rate in § 3.1. Subsequently, we present the different types of wake vortical structures that develop under the influence of these tip vortices in § 3.2. The aerodynamic forces of the finite rotating cylinders are then analysed in § 3.3. Finally, we demonstrate the effectiveness of end plates in mitigating the three-dimensional effects in finite rotating cylinder wakes in § 3.4.
3.1. Tip vortices
As a classical lifting body, a finite rotating cylinder generates tip vortices due to the pressure difference between the advancing and retreating sides at the free end – a phenomenon analogous to that observed in finite wings (Anderson Reference Anderson2011; Schlichting & Truckenbrodt Reference Schlichting and Truckenbrodt2013). To investigate the influences of rotation rate on the characteristics of the tip vortices, we choose the cases with the largest aspect ratio
 ${\rm AR}=12$
, so that the interactions between the counter-rotating tip vortices at each end of the cylinder are minimised. We compare the tip vortices between two representative cases:
 $\alpha =2$
at which the wake is steady and
 $\alpha =5$
where the tip vortex breaks down. The time-averaged tip vortices are visualised using the iso-surfaces of
 $\overline {Q}=1$
and
 $|\overline {\omega _x}|=1.5$
in figure 4(
 $a{-}c$
). The contours of
 $\overline {\omega _x}=-1,\ -1.5$
and −2 are also used to delineate the shape of the vortex cores for the two cases in figures 4(d) and 4(e).
Comparison of the time-averaged tip vortical structures between
 $\alpha =2$
(orange) and
 $\alpha =5$
(green) for a fixed
 ${\rm AR}=12$
. (
 $a$
) Perspective view, (b) side view and (c) top view of the tip vortices visualised by iso-surfaces of
 $\overline {Q}=1$
(solid) and
 $\overline {|\omega _x|}=1.5$
(transparent). Time-averaged streamwise vorticity fields at
 $x=2$
, 4 and 6 for (d)
 $\alpha =2$
and (e)
 $\alpha =5$
. The grey dashed boxes in (d,e) represent the location of the cylinders.

For the steady flow at
 $\alpha =2$
, the tip vortex is characterised by a straight and elongated vortical structure formed near the free end. Cross-sectional analysis on the
 $y$
–
 $z$
planes reveals an initially elliptical shape in the near wake that gradually evolves into a more circular configuration as the vortex convects downstream. In contrast, the time-averaged tip vortex for
 $\alpha =5$
is considerably shorter due to vortex breakdown (discussed in the next subsection). For this case, the cross-sectional shape in the near wake exhibits greater irregularity, indicating that multiple vorticity sources likely contribute to tip-vortex formation. Further downstream, while the vortex cross-section becomes more regular in shape, it remains significantly more diffused as a consequence of the breakdown process. A notable distinction between the two cases is that the tip vortex at
 $\alpha =5$
exhibits greater inboard tilting compared with
 $\alpha =2$
, suggesting a more pronounced influence on the inboard flow field.
Tip-vortex circulation calculated based on contours of
 $|\overline {\omega _x}|=1.5$
for cases with
 ${\rm AR}=12$
.

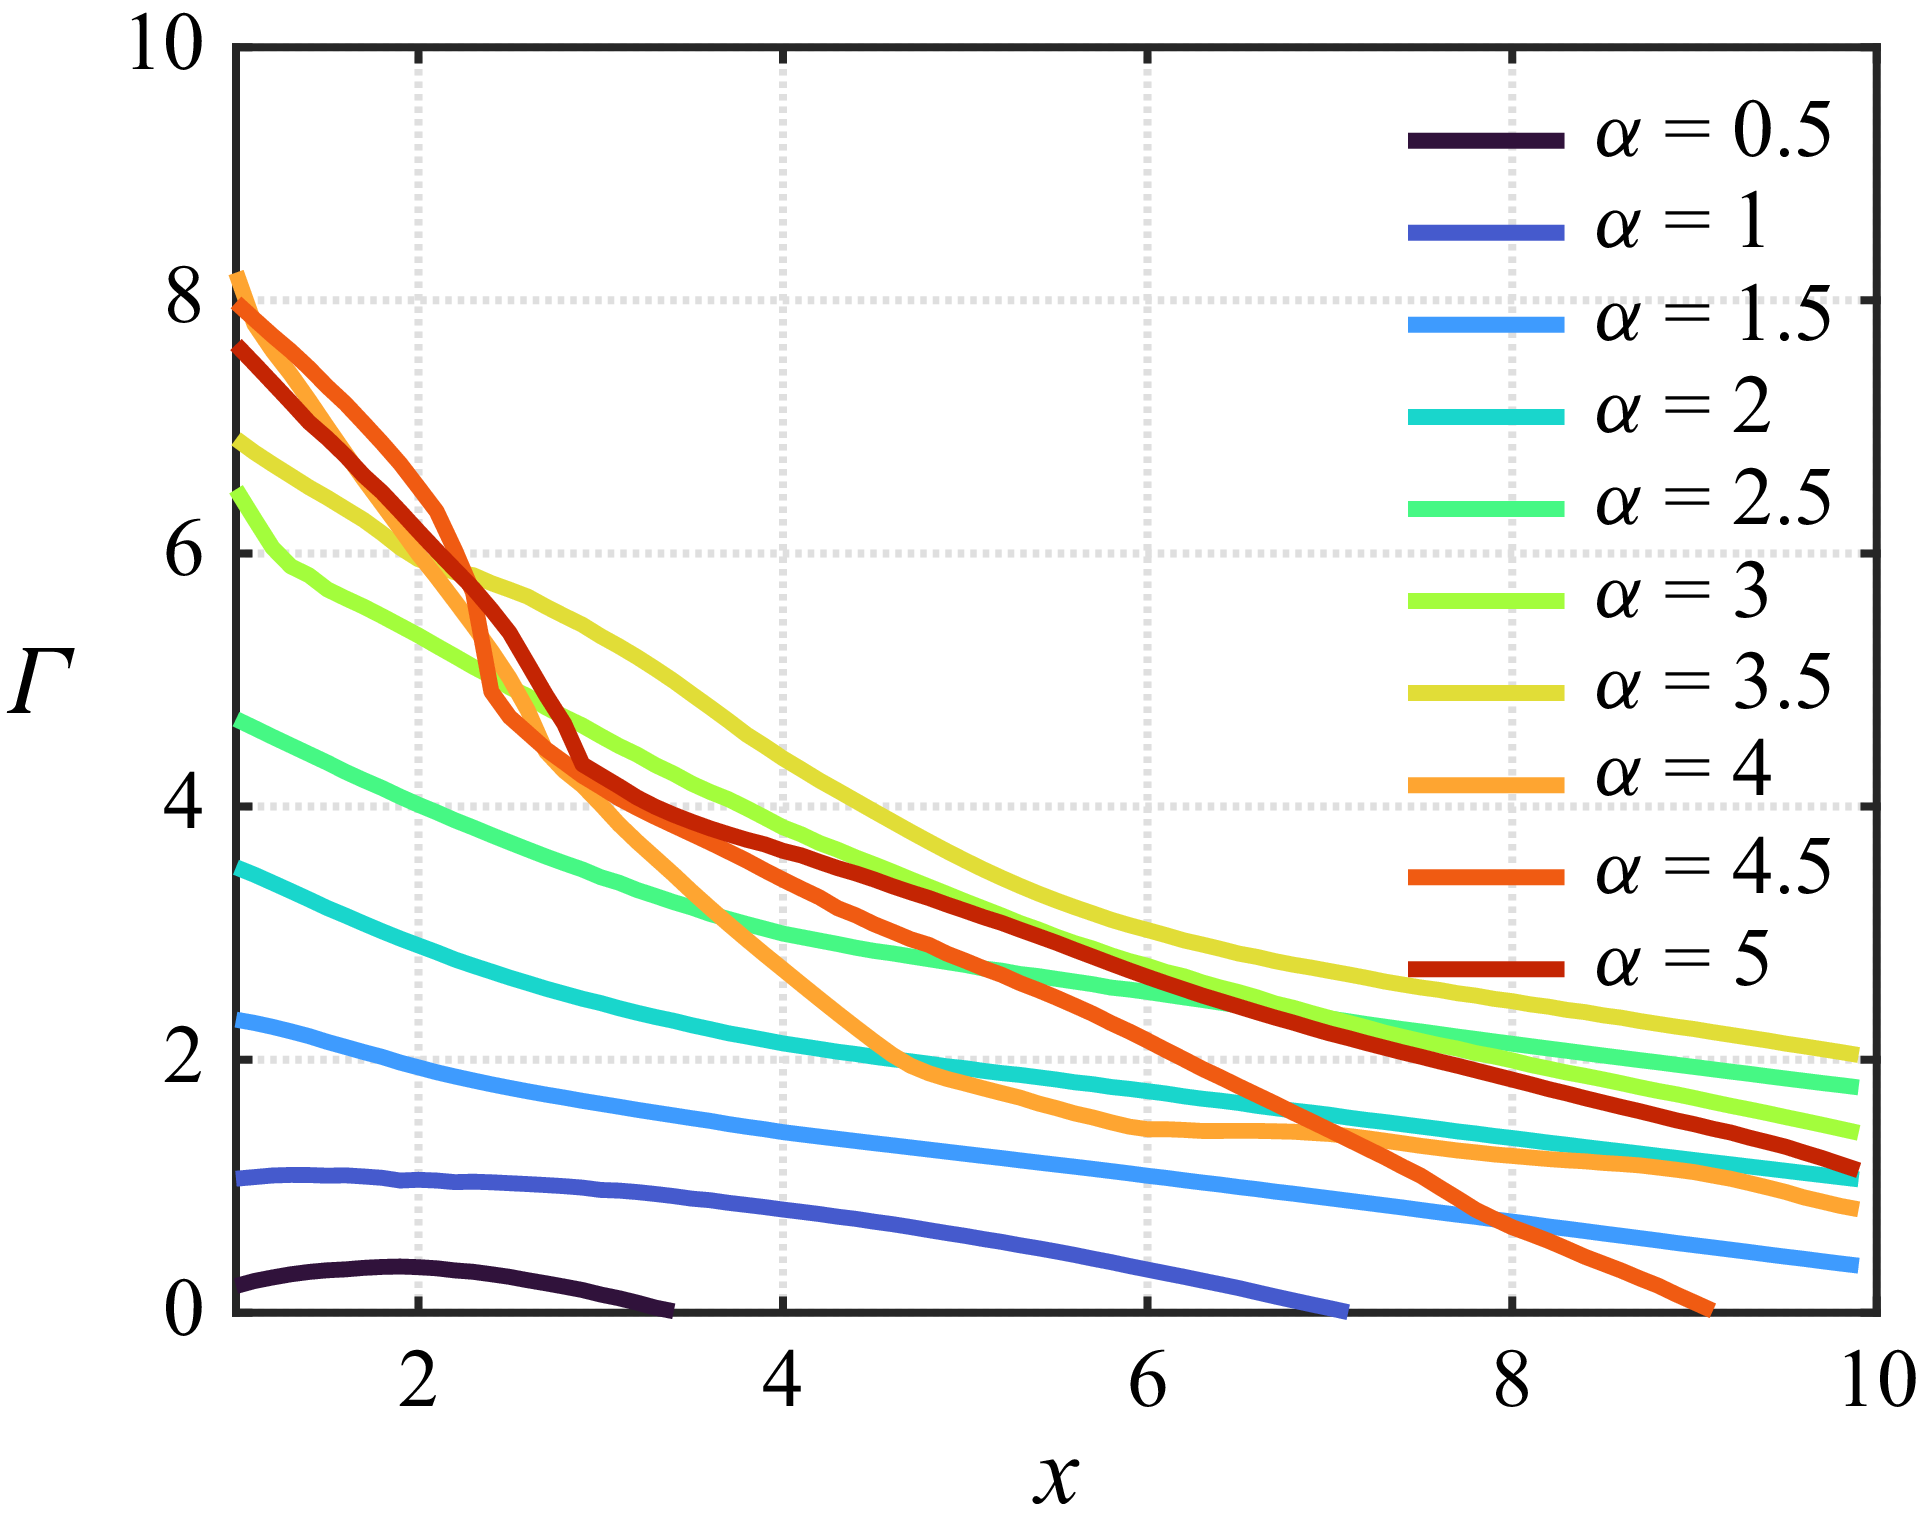
We further quantify the streamwise evolution of tip-vortex strength by evaluating the circulation
 $\varGamma =\oint _{C} \boldsymbol{u}\boldsymbol{\cdot }\mathrm{d}\boldsymbol{l}$
on
 $y$
–
 $z$
planes, where the integration contour
 $C$
is defined as the contour line of
 $\overline {\omega _x}=-1.5$
. As shown in figure 5, circulation at low rotation rates decays nearly linearly along the streamwise direction. With increasing rotation rate, tip vortices intensify and extend farther downstream. This intensification plateaus for
 $\alpha \gtrsim 4$
, where vortex breakdown occurs. Beyond this threshold, circulation drops markedly in the near wake before transitioning to a more gradual decay in the far wake. Consequently, high-
 $\alpha$
cases can exhibit shorter tip-vortex lengths than their low-
 $\alpha$
counterparts, as observed in figure 4.
To provide a preliminary assessment of the free-end effects on the inboard flows, we present the skin-friction line patterns for the cases with
 ${\rm AR}=12$
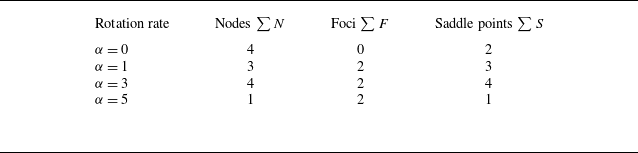
in figure 6. The critical-point theory (Lighthill Reference Lighthill1963; Tobak & Peake Reference Tobak and Peake1982; Délery Reference Délery2001) is also applied to construct a consistent flow topology on the rotating cylinder surface. The topological rules and critical point counts are examined, with the numbering of critical points in the surface flow patterns summarised in table 2 for different rotation rates. The number of critical points is verified to satisfy the Poincaré–Bendixson theorem (Davey Reference Davey1961), which dictates that the topological constraint
 $\sum N - \sum S =2$
must be maintained for fluid flows (here,
 $\sum N$
and
 $\sum S$
are the numbers of nodal points (including nodes and foci) and saddle points, respectively).
Number of critical points in the time-averaged surface flow patterns with
 ${\rm AR}=12$
.

Time-averaged skin-friction line patterns for selected rotation rates with
 ${\rm AR}=12$
:
 $(a)$
 $\alpha =0$
,
 $(b)$
 $\alpha =1$
,
 $(c)$
 $\alpha =3$
and
 $(d)$
 $\alpha =5$
. The top circles show the skin-friction lines on the side surface of the cylinder and the bottom panels show the skin-friction lines on the
 $\theta$
–
 $z$
plane. The colour represents the skin-friction vector in the circumferential direction
 $\overline {\tau _t}$
. The critical points and the separation (S)/attachment (A) lines are indicated.

For the stationary cylinder, the boundary-layer separation exhibits symmetry about both
 $\theta =0$
and
 $z=0$
. The separation lines (S
 $_1$
) and (S
 $_2$
) pass through saddle points
 $S_1$
and
 $S_2$
shown in figure 6(
 $a$
). While the boundary-layer flow upstream of separation exhibits an almost two-dimensional pattern, the skin-friction lines downstream of separation display a strong spanwise flow component. This indicates that the wake of the stationary cylinder is significantly influenced by inboard flow from the free ends, a well-documented feature in free-end cylinder studies (Sumner Reference Sumner2013; Cao et al. Reference Cao, Tamura, Zhou, Bao and Han2022).
For the rotating cylinder, the surface friction line represents the relative motion of the boundary layer to the rotating surface. In these cases, the separation line on the advancing side of the cylinder disappears. The boundary-layer flow is accelerated between
 $\theta \approx 0$
and
 $\pi /2$
, as indicated by the positive
 $\overline {\tau _z}$
regions in figure 6(
 $b$
–
 $d$
). This acceleration, by Bernoulli’s theorem, induces a low-pressure region that is pivotal for generating lift.
At
 $\alpha =1$
, a node
 $N_2$
forms on the retreating side, with its eigenvector line connecting to the separation line originating from saddle point
 $S_2$
on the free-end surface. The unstable focus
 $F_1$
dominates the spiral outflow on the free-end surface, which feeds into saddle point
 $S_2$
. On the cylinder surface, the boundary-layer flow in both the acceleration and deceleration regions is mostly two-dimensional, except for the vicinity of the free ends. This observation indicates that the formation of tip vortices with mild rotation alleviates the highly three-dimensional free-end effects observed in the case of a finite stationary cylinder.
As the rotation rate increases to
 $\alpha =3$
, the saddle point
 $S_2$
shifts from the free-end boundary to the cylinder surface. The attachment line (A
 $_1$
) connects multiple critical points, forming the characteristic
 $N_2$
–
 $S_1$
–
 $N_3$
–
 $S_2$
combination typical of reattachment flow patterns, a result of the highly three-dimensional flow structures near the free ends. The free-end effects further intensify as the rotation rate increases to
 $\alpha =5$
, with the reattachment line (A
 $_1$
) exhibiting greater curvature across a substantially wider span. Such strong three-dimensionality is likely linked with the inboard-wise tilt of the tip vortices at high rotation rates, as discussed in figure 4. As a result, the region associated with positive
 $\overline {\tau _t}$
is significantly reduced, leading to degraded aerodynamic performance. These results demonstrate the significant impact of the free ends on the boundary-flow topology, particularly for cases with high rotation rates. In what follows, we discuss the three-dimensional wake dynamics of finite rotating cylinders, revealing their strong dependence on tip vortices.
3.2. Wakes of finite rotating cylinders
Under the influence of the tip vortices, we identify four types of wakes of the rotating cylinders at
 $ \textit{Re}=150$
, namely unsteady vortex shedding, steady flow, unsteady tip vortices and chaotic flows, as shown in figure 7. The distributions of these flows in the
 $\alpha$
–
 ${\rm AR}$
space are mapped in figure 8. In the following, we discuss the characteristics of each type of flow.
Perspective views of the four typical wakes behind the rotating finite cylinders. (
 $a$
) Unsteady vortex shedding, (
 $b$
) steady flow, (
 $c$
) unsteady tip vortices and (
 $d$
) chaotic flow. The vortical structures are visualised by iso-surfaces of
 $Q=1$
. The dashed arrows indicate the direction of rotation.

Classification of wake regimes. Blue squares: unsteady vortex shedding along midspan; red circles: steady flows; green squares: unsteady tip vortices; black filled squares: chaotic flow.

3.2.1. Unsteady vortex shedding
At low rotation rates, the cylinder displays typical bluff-body behaviour, producing unsteady vortex shedding as a result of linear temporal instability followed by nonlinear stabilisation, as illustrated in figure 7(
 $a$
) for the case
 $({\rm AR},\alpha )=(12,1)$
. The shed vortices are spatially confined to the midspan region due to the finite length of the cylinder. Adjacent to the midspan, the flow field is dominated by alternating Kármán vortices, which are primarily oriented in the spanwise direction similar to the 2S wake structure in the case of an infinitely long cylinder (Bourguet Reference Bourguet2020). Near the free ends, however, the shed vortices reorient themselves to align with the streamwise direction. These streamwise-oriented vortical structures, combined with the spanwise-oriented vortices near the midspan, form closed vortex loops that convect downstream. Such a three-dimensional vortex-shedding pattern has been extensively documented in the wakes of stationary finite cylinders (Taneda Reference Taneda1952; Levold Reference Levold2012) and in separated flows over finite wings (Zhang et al. Reference Zhang, Hayostek, Amitay, He, Theofilis and Taira2020b
). In addition, the tip vortices exhibit unsteadiness under the influence of the unsteady vortex shedding.
Despite the complex vortex-shedding pattern described above, the lift coefficient for the case
 $({\rm AR}, \alpha ) = (12, 1)$
exhibits a regular periodic oscillation dominated by a single frequency at
 $f = 0.168$
, as seen in figures 9(a) and 9(b). Additionally, two superharmonic frequencies at
 $2f$
and
 $3f$
emerge due to the nonlinear self-interaction of the dominant frequency. To examine the spatial structures corresponding to these frequencies, we perform dynamic mode decomposition (DMD) (Schmid Reference Schmid2010) using the snapshots of
 $Q$
, with the resulting modes displayed in figure 9(
 $c$
–
 $e$
). For the DMD analysis, 1000 flow snapshots uniformly spaced in time with a non-dimensional time step of
 $\Delta T = 0.1$
are used, ensuring sufficient temporal resolution and coverage of multiple shedding cycles to reliably extract the dominant wake modes. The dominant frequency corresponds to a highly three-dimensional modal structure, consisting of spanwise vortices in the near wake at the midspan, streamwise-oriented vortices and helical tip vortices. The modal structures of the superharmonics feature smaller-scale vortices that extend further downstream into the wake.
Characterisation of the unsteady vortex shedding for the case with
 $({\rm AR},\alpha )=(12,1)$
. (
 $a$
) Time history of the lift coefficient, (
 $b$
) amplitude spectrum of the lift coefficient and (
 $c$
–
 $e)$
dynamic modes associated with the dominant frequency and its two superharmonics. The modal structures are visualised by iso-surfaces of
 $Q$
.

Compilation of (
 $a$
) root-mean-square value of the fluctuating lift coefficients and
 $(b)$
dominant frequency for the cases in the unsteady vortex-shedding regime.

Time-averaged streamlines and the spanwise component of vorticity fields at the middle section
 $(z=0)$
for (a–d) cases with different aspect ratios at a fixed rotation rate
 $\alpha =1.5$
. The magenta and cyan lines represent the contours of
 $\overline {U_y}=-0.5$
for the three- and two-dimensional cases, respectively.

The effects of the aspect ratio on the fluctuating lift coefficient and dominant vortex-shedding frequency are summarised in figure 10. While in two-dimensional flows around rotating cylinders (i.e.
 ${\rm AR}=\infty$
) the rotation rate
 $\alpha$
has a limited effect on vortex-shedding strength and frequency until the flow transitions to a steady wake (Mittal & Kumar Reference Mittal and Kumar2003), the behaviour of finite rotating cylinders differs significantly. The root-mean-square values of lift coefficients are substantially higher for rotating finite cylinders compared with their stationary counterparts, suggesting that mild rotation enhances vortex shedding. This distinction arises from fundamentally different end effects between stationary and rotating configurations. In the former, the free-end effects primarily manifest as a inboard flow from the free end towards the near wake of the midspan region (while the flow along the cylinder’s span (in the
 $z$
direction) is often called downwash in the literature of wall-mounted cylinders, we avoid this term to prevent confusion with the downwash from the tip vortex, which flows in the
 $-y$
direction), as discussed in figure 6(
 $a$
). This spanwise flow acts as a splitter plate in the near wake and significantly hinders the formation of a Kármán vortex street (Wang & Zhou Reference Wang and Zhou2009; Krajnović Reference Krajnović2011; Cao et al. Reference Cao, Tamura, Zhou, Bao and Han2022). In contrast, rotating cylinders generate the streamwise-oriented tip vortices that induce downwash (i.e. velocity component in the
 $-y$
direction). While these free-end effects significantly alter the vortex-shedding behaviour as described in figure 9(
 $c{-}e$
), the strength of vortex shedding remains strong compared with the stationary cylinder. However, as aspect ratio decreases, the intensified downwash increasingly suppresses the vortex-shedding process, reducing both its frequency and strength. At sufficiently low aspect ratios, e.g.
 $({\rm AR},\alpha )=(4,1.5)$
, the downwash effects lead to complete wake stabilisation, which we examine in detail in the next subsection.
3.2.2. Steady flow
For rotation rates
 $\alpha \gtrsim 2$
, the increased angular velocity confines vorticity to the near-wall region, thickening the zone of closed streamlines. This confinement significantly restricts vorticity transport into the wake, suppressing separation bubble formation and inhibiting the development of wake instabilities (Mittal & Kumar Reference Mittal and Kumar2003; Rao et al. Reference Rao, Radi, Leontini, Thompson, Sheridan and Hourigan2015; Bourguet Reference Bourguet2020). As a result, the flow transitions to a steady state, as illustrated in figure 7
 $(b)$
.
Steady flow can also be observed for
 $\alpha \lesssim 2$
with low-aspect-ratio rotating cylinders, where wake stabilisation is achieved by the downwash effects from the tip vortices. To demonstrate this mechanism, we examine cases with
 $\alpha = 1.5$
, in which the analogous two-dimensional flow exhibits classic vortex shedding. Figure 11 presents time-averaged flow fields at the midspan (
 $z=0$
) for
 $\alpha = 1.5$
across varying
 ${\rm AR}$
. Contours of
 $\overline {U_y} = -0.5$
are included for both finite-
 ${\rm AR}$
(magenta) and two-dimensional (cyan) cases to highlight the influence of tip vortices on the wake velocity distribution. For
 ${\rm AR} \gtrsim 6$
, the two contours nearly coincide, indicating minimal downwash effects at the midspan. Consequently, the wake remains unsteady, with vortex shedding persisting near the midspan and forming a pair of separation bubbles, as shown in figures 11(c) and 11(d). When the aspect ratio is reduced to
 ${\rm AR}=4$
, downwash effects intensify, evidenced by the expanded region occupied by the
 $\overline {U_y} = -0.5$
contour. This downward velocity impinges on the upper vortex bubble, suppressing its roll-up and stabilising the wake. This mechanism is analogous to the confinement of a leading-edge vortex in low-aspect-ratio wings (Taira & Colonius Reference Taira and Colonius2009; DeVoria & Mohseni Reference DeVoria and Mohseni2017; Zhang et al. Reference Zhang, Hayostek, Amitay, Burtsev, Theofilis and Taira2020a
,
Reference Zhang, Hayostek, Amitay, He, Theofilis and Tairab
). At even lower aspect ratios, tip vortices dominate the wake, and their strong downwash completely eliminates separation bubbles, as shown in figure 11
 $(a)$
.
3.2.3. Unsteady tip vortices
As the rotation rate increases, the steady wake becomes unstable due to disturbances originating in the tip vortices. The unsteadiness arises from two primary mechanisms: the mutual induction between counter-rotating tip-vortex pairs and the inherent instability of an individual vortex as its strength intensifies. These mechanisms align with the tip-vortex behaviour described in § 3.1 for the unsteady tip-vortex regime. The mutual induction mechanism is prevalent in cases with low aspect ratios, such as
 $({\rm AR}, \alpha ) = (4, 2.5)$
depicted in figure 7(
 $c$
). Spectral analysis of this flow, shown in figure 12, reveals a nearly pure sinusoidal oscillation, as the lift coefficient is dominated by a single frequency with negligible harmonics. The corresponding DMD mode illustrates a pair of serpentine tip vortices oscillating symmetrically in a varicose pattern. These vortices eventually merge downstream to form closed vortex rings. For this instability mode, the critical rotation rate
 $\alpha$
scales nearly linearly with aspect ratio for
 ${\rm AR} \lesssim 8$
. This trend reflects the need for greater vortex intensity to induce instability via mutual induction as the spanwise separation between counter-rotating vortices increases. Beyond
 $\alpha \approx 3.5$
, further increases in rotation rate transition the flow to a chaotic state, which is addressed in § 3.2.4.
Characteristics of the case with unsteady tip vortices for
 $({\rm AR},\alpha )=(4,2.5)$
. (
 $a$
) Time history of the lift coefficient, (
 $b$
) amplitude spectrum of the lift coefficient and (
 $c$
) DMD mode at
 $f=0.102$
.

Characteristics of the case with unsteady tip vortices for
 $({\rm AR},\alpha )=(12,3.5)$
. (
 $a$
) Time history of the lift coefficient, (
 $b$
) amplitude spectrum of the lift coefficient and (
 $c$
) a snapshot of flow field visualised by iso-surfaces of
 $Q=0.5$
.
 $(d$
–
 $g)$
The DMD modes corresponding to the dominant frequencies. A slice of the modal structure on the
 $y{-}z$
plane at
 $x=20$
is added as an inset for each DMD mode, with red and blue representing
 $Q\gt 0$
(vortex core) and
 $Q\lt 0$
(strain region), respectively.

For cases with high aspect ratios, the intensification of tip vortices can trigger another type of unsteadiness as illustrated in figure 13 for the case
 $({\rm AR},\alpha )=(12,3.5)$
. In this case, the lift coefficient displays fluctuations governed by a fundamental frequency of
 $f=0.112$
, accompanied by superharmonics of comparable magnitude. The flow field exhibits distinct characteristics across different wake regions. In the near wake, the vortex cores exhibit irregular geometries. Downstream in the far wake, these cores evolve into corkscrew-like configurations characterised by secondary vortex filaments that interweave along the primary cores. The DMD analysis reveals that the far-wake fluctuations feature a single spiral mode (
 $m=1$
) for the dominant frequency, while the
 $2f$
and
 $4f$
frequencies are associated with double (
 $m=2$
)- and triple (
 $m=3$
)-braided helix modes. The
 $3f$
DMD mode exhibits a mixed structure, combining characteristics of both the
 $m=2$
and
 $m=3$
helix modes – likely due to nonlinear interactions in the wake.
3.2.4. The Taylor-like vortices
At even higher rotation rates, the three-dimensional wake undergoes a transition to chaotic flow. For low-aspect-ratio configurations, this transition occurs at lower
 $\alpha$
, primarily due to strong interactions between counter-rotating tip vortices. In contrast, for high-aspect-ratio cases, the onset of chaotic flow is dominated by the formation of Taylor-like vortices (analogous to the toroidal vortices in the Taylor–Couette flow observed between concentric rotating cylinders). This subsection focuses on the latter mechanism.
Comparison of the vortical structures between the (
 $a$
) free-end case
 $({\rm AR}, \alpha )=(10, 5)$
and (
 $b$
) spanwise-periodic case at
 $\alpha =5$
. In the former, the vortical structures are visualised by iso-surfaces of
 $Q=1$
and in the latter by iso-surfaces of
 $Q=0.05$
. In the inset in (
 $a$
),
 $Q=10$
is used only near the midspan of the cylinder to show the shape of the Taylor-like vortices. (c,d) The instantaneous skin-friction line patterns for the two cases, coloured by the spanwise component of the skin-friction vector
 $\tau _z$
.

The Taylor-like vortices typically emerge for
 $\alpha \gtrsim 4$
in the case of finite rotating cylinders, as displayed in figure 14(
 $a$
) for the case
 $({\rm AR}, \alpha ) = (10, 5)$
. These vortices appear as C-shaped arc structures that are bound to the windward and retreating sides of the cylinder surface, while extending further away from the advancing side and the wake. Some of the vortical structures are absorbed into the tip-vortex region, as corroborated by the discussion regarding figure 4. The Taylor-like vortices are populated along the cylinder span, imprinting intricate skin-friction line patterns on the surface of the cylinder, as shown in figure 14
 $(c)$
. In contrast, an infinitely long rotating cylinder with analogous condition exhibits the typical Mode E instability as shown in figure 14(
 $b$
). In this case, the flow’s three-dimensionality is so weak that a significantly lower contour level of
 $Q$
is required to reveal the wake structures. The wake is characterised by pairs of counter-rotating streamwise vortices on the bottom side of the cylinder, which form regular cell-like patterns in the skin-friction lines depicted in figure 14(
 $c$
). This comparison between the free-end and two-dimensional cases highlights that the highly three-dimensional wake dynamics in the former case is primarily attributed to the extrinsic free-end effects, rather than being intrinsically driven.
 $(a)$
Temporal evolution of the instantaneous
 $\omega _y$
on the
 $y=0$
plane at
 $t=150{-}153$
for
 $({\rm AR},\alpha )=(12,5)$
. Velocity vectors are overlaid as quiver plots on top of the vorticity fields
 $\omega _y$
. The Taylor-like vortices are indicated by yellow (
 $\omega _y=15$
) and cyan
 $(\omega _y=-15)$
contours, and are labelled as A1–A3 and B1–B3, respectively. (
 $b$
) Time-averaged spanwise velocity
 $\overline {u_z}$
on the
 $y=0$
plane, where colour indicates the velocity magnitude (red for positive, blue for negative).

The evolution of the Taylor-like vortices on the plane of
 $y=0$
is illustrated in figure 15(
 $a$
) for the case
 $({\rm AR},\alpha )=(12,5)$
using four successive snapshots of
 $\omega _y$
fields. A more complete picture of the spatio-temporal dynamics of these Taylor-like vortices is shown in figure 16, in which the occurrence of a Taylor-like vortex (defined as closed contour lines of
 $\omega _y=15$
for
 $z\gt 0$
and
 $\omega _y=-15$
for
 $z\lt 0$
as shown in figure 15) in the
 $t$
–
 $z$
diagram is denoted by a circle. Over time, the Taylor-like vortices consistently emerge from the free ends, and grow stronger as they migrate towards the midspan. The windward side of the cylinder surface (where the Taylor-like vortices are bound) is dominated by positive
 $\omega _y$
for
 $z\gt 0$
and negative
 $\omega _y$
for
 $z\lt 0$
. A notable feature is the frequent merging of adjacent vortices into single structures at approximately 2–3 diameters from the free ends. This vortex coalescence phenomenon is clearly captured in the snapshot at
 $t=152$
, where vortices A1 and A2 combine to form a unified Taylor-like vortex. Eventually, the counter-rotating Taylor-like vortices developed from the two free ends collide near the midspan, leading to complex vortex interactions. The dynamics of the Taylor-like vortices is also depicted in the supplementary movie available at https://doi.org/10.1017/jfm.2026.11527, where iso-surfaces of
 $Q=1$
are visualised. The characteristics of the Taylor-like vortices described above bear resemblance to the Mode F instability in the two-dimensional flows over a rotating cylinder, although the latter mechanism typically occurs at higher Reynolds numbers through centrifugal instability (Radi et al. Reference Radi, Thompson, Rao, Hourigan and Sheridan2013; Rao et al. Reference Rao, Radi, Leontini, Thompson, Sheridan and Hourigan2015). Due to the consistent inboard-wise movement of the Taylor-like vortices, strong spanwise velocity is observed in the close vicinity of the cylinder surface in the time-averaged flow fields, as shown in figure 15.
Spatio-temporal distribution of the Taylor-like vortices for
 $({\rm AR},\alpha )=(12,5)$
on the
 $y=0$
plane. Each circle denotes a contour of
 $\omega _y=15$
for
 $z\gt 0$
and
 $\omega _y=-15$
for
 $z\lt 0$
on the plane of
 $y=0$
. The size of each circle represents the circulation of the vortices. The colour depicts the absolute value of the spanwise velocity predicted by the potential flow theory.

We argue that the inboard movement of Taylor-like vortices is attributed to the self-induced motion arising from vortex–wall interaction. Unlike the tip-vortex-induced downwash which acts in the vertical direction (
 $y$
), this wall-induced velocity propels the vortices in the spanwise direction (
 $z$
). In potential flow theory, when a vortex is generated near the cylinder surface, an imaginary ‘image vortex’ of opposite circulation is conceptually placed on the mirror side of the no-slip surface to satisfy the no-penetration condition at the wall. The wall-normal velocity components of the real and image vortices cancel out to meet the boundary condition, but their tangential components add together, creating a net flow parallel to the wall that propels the Taylor-like vortices (Milne-Thomson Reference Milne-Thomson1968). The self-induced velocity via vortex–wall interaction is predicted by the method of images as
 \begin{equation} U_{z,p} = \frac {\varGamma _T}{4\pi d_T}, \end{equation}
where
 $\varGamma _T$
is the circulation of the Taylor-like vortex and
 $d_T$
is the distance of the vortex to the wall. Here, we calculate the circulation using
 $\varGamma _T=\oint _{\omega _y=\pm 15} \boldsymbol{u} \boldsymbol{\cdot }\mathrm{d} \boldsymbol{l}$
, and
 $d_T$
is defined as the distance between the vorticity extremum in the vortex core and the cylinder surface. Although this potential-flow-based velocity does not quantitatively match the actual spanwise velocity of the Taylor-like vortices, it exhibits excellent qualitative agreement with the observed velocity trends (indicated by the slope of vortex trajectories in the
 $t$
–
 $z$
plane). This correspondence strongly suggests that the inboard migration of Taylor-like vortices is indeed governed by the vortex–wall interaction mechanism.
Since these Taylor-like vortices are spatially close to the windward side of the cylinder surface, they provide suction forces that reduce the local drag. To demonstrate this, we present the distributions of the sectional drag coefficients along the spanwise direction and across time in figure 17. As the Taylor-like vortices migrate towards the midspan, they induce slanted troughs of reduced drag in the spatio-temporal pattern of
 $C_d$
. Notably, due to the accumulation of these vortices from both free ends, the drag coefficient at the midspan is relatively lower than that in the neighbouring regions. From the amplitude spectrum shown in figure 17(
 $b$
), the regions near the free ends (
 $0\lesssim |z|\lesssim 3$
) exhibit broadband frequency content centred around
 $f\approx 0.35{-}0.5$
. After the merge of the Taylor-like vortices, the region
 $2\lesssim |z| \lesssim 4$
is dominated by more concentrated frequencies within
 $f\approx 0.2{-}0.25$
. Towards the midspan, the vortices experience low-frequency broadband oscillations due to the complex interactions between Taylor-like vortices of opposite signs.
(
 $a$
) Spatio-temporal distribution of the sectional drag coefficients for
 $({\rm AR},\alpha )=(12,5)$
and (
 $b$
) the amplitude spectrum.

While the Taylor-like vortices in the present study originate from the free ends, they bear a strong resemblance to the intrinsic Mode F instability (centrifugal instability) observed in infinite cylinders at higher Reynolds numbers. Similar vortical structures have been observed in the DNS of flows over a spanwise-homogeneous rotating cylinder at
 $ \textit{Re}=5000$
(Aljure et al. Reference Aljure, Rodríguez, Lehmkuhl, Pérez-Segarra and Oliva2015) and a wall-mounted rotating cylinder at
 $ \textit{Re}=3000$
(Massaro et al. Reference Massaro, Karp, Jansson, Markidis and Schlatter2024), suggesting that these C-shaped topological features are robust and relevant to practical applications. However, a key uncertainty remains regarding their spanwise migration. Intrinsic Mode F instability typically manifests as counter-rotating pairs, where the self-induced velocities from vortex–wall interactions effectively cancel out, leading to stationary or slowly drifting structures. In contrast, the vortices observed here appear as single structures near the free ends, driven inboard by the image-vortex effect. It therefore remains to be studied whether the free-end boundary condition is sufficient to break the symmetry of the Mode F instability at higher Reynolds numbers, which would be necessary to sustain the distinct inboard migration observed in the laminar regime.
3.3. Aerodynamic forces
The time-averaged lift and drag coefficients of the rotating cylinders are summarised in figure 18. In the idealised two-dimensional flows (
 ${\rm AR} = \infty$
), the lift coefficient increases approximately quadratically with the rotation rate
 $\alpha$
, exceeding Prandtl’s theoretical limit of
 $C_L = 4\pi$
(Prandtl Reference Prandtl1925), but remaining below the potential flow prediction of
 $C_L = 2\pi \alpha$
over the studied range of
 $\alpha$
. The drag coefficient, on the other hand, decreases with increasing
 $\alpha$
up to approximately
 $\alpha \approx 3.5$
, approaching nearly zero, and then increases slightly at higher rotation rates.
Summary of aerodynamic forces. (
 $a$
) Time-averaged lift coefficients,
 $(b)$
time-averaged drag coefficients and
 $(c)$
time-averaged lift-to-drag ratio. The potential flow solution (
 $C_L=2\pi \alpha$
) and Prandtl’s limit (
 $C_L=4\pi$
) are included in (
 $a$
). The experimental data of Chen et al. (Reference Chen, Wang and Liu2023), who studied a wall-mounted rotating cylinder at
 $ \textit{Re}=2.33\times 10^5$
and wall-to-free-end aspect ratio of 5, are included.

Lift generation on finite rotating cylinders results from the competition between the Robins–Magnus effect and three-dimensional free-end effects, as shown in figure 18(
 $a$
). Initially,
 $C_L$
increases with the rotation rate
 $\alpha$
, but it eventually saturates or declines as the downwash from tip vortices intensifies. Increasing the aspect ratio delays this saturation, allowing lift generation to be sustained over a broader range of rotation rates. Nevertheless, the penalty imposed by the finite span remains severe even for the largest aspect ratio studied (
 ${\rm AR}=12$
), where the maximum
 $C_L$
at
 $\alpha =5$
is approximately 65 % lower than the idealised two-dimensional prediction.
The drag characteristics of finite rotating cylinders differ significantly from those of the idealised two-dimensional case. At low to moderate rotation rates, the drag coefficient initially increases with
 $\alpha$
. However, this increase reaches a saturation point at a slightly higher rotation rate than the onset of lift plateauing. The influence of aspect ratio on drag is also rotation-rate-dependent. At low
 $\alpha$
, drag decreases with increasing AR, whereas at high rotation rates, the drag becomes positively correlated with AR, likely due to stronger three-dimensional effects such as intensified tip vortices. Beyond
 ${\rm AR} \approx 8$
, however, the drag coefficients of the high-
 $\alpha$
cases also appear to saturate with increasing AR.
As a key measure of aerodynamic efficiency, the lift-to-drag ratio (
 $\overline {C_L/C_D}$
) demonstrates a consistent monotonic increase with aspect ratio across all rotation rates, as shown in figure 18(
 $c$
). With increasing AR, the rotation rate at which peak
 $\overline {C_L/C_D}$
is achieved shifts from
 $\alpha =1$
to 2. Compared with finite wings under analogous flow conditions investigated in our previous study (Zhang et al. Reference Zhang, Hayostek, Amitay, He, Theofilis and Taira2020b
), the finite rotating cylinders generate substantially higher lift. Although they also experience greater drag, the superior lift production results in an improvement in aerodynamic efficiency over conventional finite wings. This advantage highlights the potential of rotating cylinders as a viable alternative to conventional lifting surfaces in applications where low-
 $ \textit{Re}$
performance is critical.
We also compare the aerodynamic force coefficients with the experimental data from our previous wind tunnel study (Chen et al. Reference Chen, Wang and Liu2023) for flow over a wall-mounted rotating cylinder at
 $ \textit{Re}=2.33\times 10^5$
and
 ${\rm AR}=5$
. Despite the large differences of the Reynolds number and end boundary conditions (wall mounted versus free end) between our simulation and the experiments, the general trends for lift, drag and lift-to-drag ratio remain qualitatively similar. This observation suggests that the force saturation mechanisms identified in our low-
 $ \textit{Re}$
simulations capture the essential physics applicable to high-Reynolds-number engineering scenarios, such as Flettner rotors. Our results demonstrate that pushing for extremely high rotation rates yields diminishing returns for finite rotating cylinders. For optimal energy efficiency, rotors should target a moderate rotation ratio (typically
 $\alpha \approx 3{-}5$
), as operating beyond this threshold incurs higher mechanical power consumption without a proportional benefit in aerodynamic propulsion.
Time-averaged sectional force coefficients for
 ${\rm AR}=12$
.
 $(a)$
Lift coefficients
 $\overline {C_l}$
and
 $(b)$
drag coefficients
 $\overline {C_d}$
. Only half of the span is shown due to symmetry. In the insets, the sectional lift and drag coefficients for
 ${\rm AR}=12$
at the midspan (
 $z=0$
) are presented in red and compared with the two-dimensional results in black.

The time-averaged sectional lift and drag coefficients for
 ${\rm AR}=12$
cylinders are presented in figure 19, providing quantitative insight into the three-dimensional free-end effects on force generation. At low rotation rates, the sectional lift remains nearly uniform along the majority of the span, resembling two-dimensional flow conditions. However, a pronounced decline in
 $C_l$
occurs within the free-end region, where tip vortices and flow leakage reduce the lift of the Robins–Magnus effect. As
 $\alpha$
increases, two competing phenomena become apparent: first, the midspan sectional lift increases at a rate similar to that of two-dimensional flow; second, the zone affected by three-dimensional free-end effects expands inboard, progressively reducing the high-lift region. By
 $\alpha \approx 4$
, the free-end influence penetrates fully to inboard, causing even the middle sectional
 $\overline {C_l}_{,z=0}$
to fall below equivalent two-dimensional counterparts. This observation explains the gradual saturation of the
 $\overline {C_L}$
–
 $\alpha$
curves at high rotation rates, as observed in figure 18(
 $a$
).
Similarly, the sectional drag coefficients are strongly affected by free-end effects, as shown in figure 19(
 $b$
). At low rotation rates, the drag remains relatively low and uniform along the span. As the rotation rate
 $\alpha$
increases, regions near the free ends begin to exhibit elevated sectional drag, likely due to the development of intensified tip vortices and associated three-dimensional flow structures. This localised increase in drag progressively extends towards the midspan with further increases in
 $\alpha$
. Notably, the sectional drag at the midspan (
 $\overline {C_d}_{,z=0}$
) begins to deviate significantly beyond
 $\alpha \approx 2$
, indicating a growing influence of free-end effects even in regions that would otherwise approximate two-dimensional behaviour.
Comparison of pressure distributions on rotating cylinder for
 ${\rm AR}=12$
. The grey circle represents the cylinder. Dashed lines: potential flow solution; orange lines: two-dimensional DNS results; blue lines: three-dimensional DNS results at mid-sections. The magnitudes of the pressure coefficients are shown as radial distances from the cylinder surface (negative pressure outside, positive pressure inside).

We further investigate the high sensitivity of the mid-section force coefficients to free-end effects by examining the pressure distributions over the cylinder surface at
 ${\rm AR}=12$
, as shown in figure 20. According to potential flow theory, the pressure distribution around a rotating cylinder is given by
 \begin{equation} C_p = 1-(2\sin \theta +\alpha )^2. \end{equation}
This pressure theoretical distribution is symmetric about the
 $y$
axis, resulting in zero net drag. Both the two- and three-dimensional simulations predict weaker suction on the retreating side compared with the potential flow solution, leading to a reduced lift coefficient. At low rotation rates (
 $\alpha = 1$
–
 $2$
), the
 $\overline {C_p}$
values obtained in the two- and three-dimensional simulations are nearly indistinguishable, indicating minimal three-dimensional influence at the midspan. At intermediate rotation rates (
 $\alpha = 3$
–
 $4$
), the two-dimensional pressure distribution becomes increasingly symmetric about the
 $y$
axis. On the other hand, in the corresponding three-dimensional simulation, the pressure distribution skews rearward, introducing a non-negligible drag at the midspan. At higher rotation rate (
 $\alpha = 5$
), the pressure for the finite-AR case becomes enclosed within that of the two-dimensional case, marking a clear departure from the idealised two-dimensional prediction. These findings highlight the limitations of extrapolating two-dimensional results to finite-length rotating cylinders, particularly in high-
 $\alpha$
cases where free-end effects play a critical role.
3.4. Effects of end plates
We further examine the effectiveness of end plates on regulating the three-dimensional wake dynamics of finite rotating cylinders. This technique, also referred to as Thom disc (Thom Reference Thom1934), has been widely adopted in Flettner rotors to enhance their aerodynamic efficiency (Thouault et al. Reference Thouault, Breitsamter, Adams, Seifert, Badalamenti and Prince2012; Chen et al. Reference Chen, Wang and Liu2023), but the wake dynamics has not been elucidated in detail. In this study, we model the end plates as zero-thickness circular discs that rotate with the same speed as the cylinder. The radius of the disc (normalised by the cylinder diameter) is varied from
 $R_{d}=0.6$
to 1.2.
Comparison of wake vortical structures (
 $Q=1$
) with end plates at
 $({\rm AR}, \alpha )=(10,4)$
:
 $(a)$
 $R_{d}=0.6$
,
 $(b)$
 $R_{d}=0.8$
,
 $(c)$
 $R_{d}=1$
and
 $(d)$
 $R_{d}=1.2$
.

Figure 21 shows a comparison of the wake vortical structures of rotating cylinders with different plate sizes for
 $({\rm AR},\alpha )=(10,4)$
. Small end plates (
 $R_{d}=0.6$
) minimally influence the three-dimensional wake flows, which remain characterised by strong tip vortices near the free end and Taylor-like vortices along the inboard span. As the tip vortices are displaced further from the cylinder with increasing
 $R_d$
, their structures become more complex. This is particularly evident for
 $R_d=1.2$
, where two distinct vortex tubes form at the periphery of the rotating disc. The vortex tube on the retreating side tilts inboard, while its counterpart on the advancing side tilts outboard, forming a cross-finger configuration as they convect downstream.
Instantaneous skin-friction line pattern for
 $({\rm AR},\alpha )=(10,4)$
: (
 $a$
)
 $R_d=0.6$
, (
 $b$
)
 $R_d=0.8$
,
 $(c)$
 $R_d=1$
and
 $(d)$
 $R_d=1.2$
. The fields of
 $\tau _z$
are plotted to show the spanwise three-dimensionality of the flow.

Despite the complex tip vortices, the incorporation of the end plates effectively suppresses the formation of the Taylor-like vortices, as evidenced in figure 21(b–d). This phenomenon is more clearly illustrated in figure 22, which presents instantaneous skin-friction line patterns for cases with
 $R_d$
ranging from 0.6 to 1.2. For
 $R_d=0.6$
, the flow displays pronounced three-dimensionality due to the presence of Taylor-like vortices, manifesting as intricate patterns distributed across the entire cylinder surface. As the end-plate diameter increases, three-dimensional effects progressively shrink to the free ends, while the midspan region transitions towards quasi-two-dimensional behaviour. Although residual spanwise flow persists near the midspan, the three-dimensionality becomes substantially less pronounced than that observed in the slip boundary case characterised by Mode E, as demonstrated in figure 14(
 $c$
).
Aerodynamic forces for flow over cylinders with end plates.
 $(a)$
Lift coefficient and (
 $b$
) drag coefficient. The cases are with
 $({\rm AR},\alpha )=(10,4)$
.

The aerodynamic performance of finite rotating cylinders can be substantially enhanced through the regulation of three-dimensionality by end plates, as demonstrated in figure 23. With increasing
 $R_d$
, the lift coefficient exhibits monotonic growth, approaching values comparable to those observed in the two-dimensional cases. At
 $R_d=1.0$
–
 $1.2$
, the lift coefficient nearly doubles relative to the free-end configuration. The influence of end plates on drag coefficients is less pronounced than their effect on lift. Maximum drag occurs at
 $R_d=0.8$
–
 $1.0$
, while drag subsequently decreases to levels comparable to the free-end case at
 $R_d=1.2$
. Notably, even with the flow’s two-dimensionalisation achieved through end plates, drag coefficients remain considerably elevated compared with slip-end conditions (for which
 $C_D\approx 0$
). The beneficial effects of the end plates reported at low Reynolds number here are in good agreement with our previous wind tunnel study at
 $ \textit{Re}=2.33\times 10^5$
(Chen et al. Reference Chen, Wang and Liu2023). Collectively, these results demonstrate that end plates provide an effective means for regulating three-dimensional wake dynamics in rotating finite cylinders and enhancing aerodynamic performance.
4. Conclusions
We performed DNS of three-dimensional flows over finite rotating circular cylinders at a Reynolds number of 150. The objective of this study was to characterise the effects of the free end on the three-dimensional wake dynamics of finite rotating cylinders. An extensive parametric study was performed for aspect ratio
 ${\rm AR}=2$
–
 $12$
and rotation rate
 $\alpha =0$
–
 $5$
.
The most significant feature in the wakes of finite rotating cylinders is the formation of a pair of counter-rotating tip vortices. They impose downwash over the inboard region of the cylinder span, playing an important role in shaping the wake dynamics of finite rotating cylinders. At low rotation rates, the wake exhibits periodic Kármán vortex shedding confined to the midspan, resembling typical bluff-body behaviour. For higher rotation rates, the weakened free shear layer and the intensified tip vortices both stabilise the wake. With a further increase in
 $\alpha$
, the intensified tip vortices destabilise via mutual induction for the low-AR cases and self-induced instability for high-AR cases. At still higher
 $\alpha$
, Taylor-like vortices emerge as C-shaped structures from the free-end region, migrating towards the midspan driven by the self-induced velocity due to vortex–wall interaction.
The free-end effects significantly influence the aerodynamic forces of finite rotating cylinders. The lift coefficient increases with rotation rate but saturates at high
 $\alpha$
due to enhanced three-dimensional effects near the free ends. The drag coefficients for finite-AR cylinders are markedly higher than those from two-dimensional simulations. Pressure distributions at the midspan, despite being farthest from the free end, reveal persistent free-end effects, highlighting the limitations of two-dimensional simulations for assessing the aerodynamics of rotating cylinders in engineering applications. Such free-end effects are effectively suppressed by the end plates that position the tip vortices away from the cylinder. With the two-dimensionalisation of the wake along most of the span, the aerodynamic performance of the rotating cylinder is greatly improved.
This study elucidates the role of free-end effects in shaping three-dimensional wake dynamics behind finite rotating cylinders at low Reynolds numbers. These insights are crucial for interpreting more complex flows at higher Reynolds numbers, as coherent structures in high-
 $ \textit{Re}$
regimes (such as tip vortices) share core characteristics with their low-
 $ \textit{Re}$
counterparts. Future research should extend to high-
 $ \textit{Re}$
flows with free-end effects to assess phenomena such as additional temporal instability (Sengupta et al. Reference Sengupta, Kasliwal, De and Nair2003), lift crisis (Cheng, Pullin & Samtaney Reference Cheng, Pullin and Samtaney2018) and persistence of the Taylor-like vortices under these specific conditions. In such high-
 $ \textit{Re}$
extensions, the role of compressibility should also be carefully considered, as the high surface velocity induced by rapid rotation can locally accelerate the surrounding fluid to high subsonic speeds even at low free-stream Mach numbers, making compressible flow formulations necessary for accurately capturing the resulting instability dynamics (Sundaram et al. Reference Sundaram, Sengupta, Sengupta and Suman2021; Sengupta et al. Reference Sengupta, Kumar and Kumar2025).
Supplementary movie
Supplementary movie is available at https://doi.org/10.1017/jfm.2026.11527.
Acknowledgements
The authors gratefully acknowledge insightful discussions with Dr A. Gao regarding the wall-induced velocity of the Taylor-like vortices.
Funding
This work was supported by the National Key R&D Program of China (grant no. 2023YFE0120000), the Program for Intergovernmental International S&T Cooperation Projects of Shanghai Municipality, China (grant no. 24510711100), and the National Natural Science Foundation of China (grant nos. 12202271, 52478535 and U2341242). Guangdong Basic and Applied Basic Research Foundation (2024A1515240081).
Declaration of interests
The authors report no conflict of interest.