1. Introduction
The intriguing phenomenon of droplets bouncing on a liquid or solid substrate has attracted quite some attention during the past decade. For droplets on a liquid bath it has been observed that vertical vibration of the bath, and thus a continuous resupply of air below the droplet, is crucial to achieving unlimited levitation: the drops exhibit an indefinite bouncing series (Couder et al.
Reference Couder, Fort, Gautier and Boudaoud2005). We are interested in bouncing on solid substrates, where the creation of liquid–solid contact has large consequences for the recoil. Contact angle hysteresis is the main dissipation mechanism in the receding motion, and is able to inhibit a bounce (Yarin Reference Yarin2006). However, the influence of contact angle hysteresis can be fully eliminated by creating a non-wetting impact (as in the vibrated-bath case), in which a thin layer of air is squeezed between the droplet and the substrate. The main source of dissipation is thereby eliminated, thus allowing the droplet to bounce. At first impact, energy is transferred from centre of mass (CM) motion to vibrational modes under the influence of strong drop deformation. During lift-off this internal energy is transferred again to the CM motion but not fully, leading to shape oscillations of the drop during flight. This is especially prominent at large impact velocity and leads to a low restitution of the bounce (Biance et al.
Reference Biance, Chevy, Clanet, Lagubeau and Quéré2006). At moderate impact velocity (
 $\mathit{We}<1$
) the oscillations are moderate and can be analysed using linear normal mode theory. In this regime, on which we focus in this paper, repeated quasi-elastic bouncing is observed. The non-wetting state can be obtained either by using a superhydrophobic substrate to minimize the contact area (Richard & Quéré Reference Richard and Quéré2000) or by actively maintaining a thin layer of air or vapour below the droplet. The latter is often obtained through evaporation exploiting the Leidenfrost effect on a heated surface (Chandra & Avedisian Reference Chandra and Avedisian1991; Biance et al.
Reference Biance, Chevy, Clanet, Lagubeau and Quéré2006; Tran et al.
Reference Tran, Staat, Prosperetti, Sun and Lohse2012). The layer squeezed below the drop then exists of the vapour of the droplet phase. Bouncing has also been demonstrated in another experiment using a sublimating substrate of dry ice to maintain the vapour layer (Antonini et al.
Reference Antonini, Bernagozzi, Jung, Poulikakos and Marengo2013). One way to maintain the air layer without creating a vapour phase is to oscillate the substrate, often a liquid, i.e. a bath (Couder et al.
Reference Couder, Fort, Gautier and Boudaoud2005; Terwagne, Vandewalle & Dorbolo Reference Terwagne, Vandewalle and Dorbolo2007; Gilet et al.
Reference Gilet, Terwagne, Vandewalle and Dorbolo2008) or a soap film (Gilet & Bush Reference Gilet and Bush2009). In both cases, energy of the substrate is transferred via the squeezed film to the droplet. Recently it was reported that drops can bounce on an air film even without supplying additional energy (Kolinski, Mahadevan & Rubinstein Reference Kolinski, Mahadevan and Rubinstein2014a
; de Ruiter et al.
Reference de Ruiter, Lagraauw, van den Ende and Mugele2015a
). Interferometry experiments show that the air film is sustained throughout the full impact process, not only on hydrophobic but also on hydrophilic substrates.
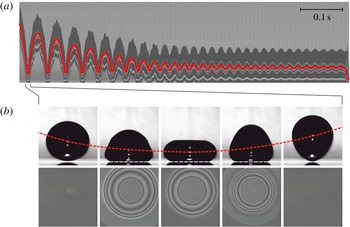
Bouncing series of an
 $R_{0}=1.03~\text{mm}$
droplet impacting on a flat glass substrate with an initial velocity of
 $0.22~\text{m}~\text{s}^{-1}$
. (a) Time sequence showing the vertical centreline of the droplet with the centre of mass position indicated in red. The bright lines are reflections from the droplet surface. (b) The snapshots show a selection of (upper row) side view images and (bottom row) the corresponding reflection interference pictures (
 ${\rm\Delta}t=2.4~\text{ms}$
) during the first bounce.

We are specifically interested in the role of the air film in this non-contact bouncing mechanism. Recently, the influence of ambient air on drop impact has been studied extensively both theoretically (Mandre, Mani & Brenner Reference Mandre, Mani and Brenner2009; Hicks & Purvis Reference Hicks and Purvis2010; Mani, Mandre & Brenner Reference Mani, Mandre and Brenner2010; Duchemin & Josserand Reference Duchemin and Josserand2011, Reference Duchemin and Josserand2012; Mandre & Brenner Reference Mandre and Brenner2012; Hicks & Purvis Reference Hicks and Purvis2013) and experimentally (Driscoll & Nagel Reference Driscoll and Nagel2011; de Ruiter et al.
Reference de Ruiter, Oh, van den Ende and Mugele2012; Kolinski et al.
Reference Kolinski, Rubinstein, Mandre, Brenner, Weitz and Mahadevan2012; van der Veen et al.
Reference van der Veen, Tran, Lohse and Sun2012; Kolinski, Mahadevan & Rubinstein Reference Kolinski, Mahadevan and Rubinstein2014b
; de Ruiter, van den Ende & Mugele Reference de Ruiter, van den Ende and Mugele2015c
) using interferometry or total internal reflection microscopy to visualize the evolution of the air film with (sub-) micrometre thickness and sub-millisecond time resolution. Most studies focused on the quick air film collapse and its implications for splashing at high impact velocities, while a few described the slower squeeze-out in gentle impacts. In all cases the squeeze-out was considered to be irreversible, ultimately leading to the formation of liquid–solid contact. However, exploring the low-impact velocity regime we observed that the air film does not collapse at all, allowing drops of both high and low surface tension fluids to bounce on the air film (de Ruiter et al.
Reference de Ruiter, Lagraauw, van den Ende and Mugele2015a
). In previous bouncing studies, both experimental (Richard & Quéré Reference Richard and Quéré2000; Biance et al.
Reference Biance, Chevy, Clanet, Lagubeau and Quéré2006) and numerical (Moláček & Bush Reference Moláček and Bush2012; Terwagne et al.
Reference Terwagne, Ludewig, Vandewalle and Dorbolo2013), the existence of an air film was used to explain non-wetting. However, any further role of the air film on the bouncing dynamics was neglected. When exploiting the Leidenfrost effect to achieve non-wetting, the air film is relatively thick (
 ${\sim}100~{\rm\mu}\text{m}$
) and air film dissipation is indeed negligible, leading up to 1000 successive bounces (Biance et al.
Reference Biance, Chevy, Clanet, Lagubeau and Quéré2006). However, for small air film thicknesses the role of the squeezed layer as a source of dissipation or as a force actor might not be negligible. For a droplet bouncing on a viscous bath, Gilet et al. (Reference Gilet, Terwagne, Vandewalle and Dorbolo2008) have developed a theoretical description involving a squeeze force and dissipation in the air film. In their description the air film is flat, and therefore liquid motion inside the drop (coupled to the film drainage via the drop–air interface) must have a significant influence on the film drainage to observe full momentum reversal and thus repeated bouncing. Here, the question arises whether the assumption of a flat air film correctly explains the momentum transfer via the air film to the drop.
We study the impact of millimetre-sized droplets onto a rigid, stationary substrate (thus excluding any external forcing or replenishment of the air film). When released from a typical height of 4–14 mm the droplet bounces repeatedly before an abrupt transition to wetting is observed. Figure 1(a) shows the time evolution of the centre of mass during a typical bouncing series. During the ‘bounce’, i.e. when the linear momentum is reversed due to interaction with the substrate, the droplet is flattening on the substrate, but maintains a virtual contact angle of 180°, as shown in the upper row of figure 1(b). To sustain this non-wetting situation independent of substrate wettability, a finite air layer should exist between the droplet and the substrate. This is confirmed using reflection interference microscopy: the interference pattern is permanently observed during the bounce: see the bottom row of figure 1(b). Due to the absence of a contact line, the dissipation during the bounce is expected to be small. Indeed, we observe a remarkably high restitution coefficient of
 $0.96\pm 0.04$
, resulting in many bounces before eventually wetting occurs. We aim to give a comprehensive description of this bouncing mechanism as first demonstrated in our previous publication (de Ruiter et al.
Reference de Ruiter, Lagraauw, van den Ende and Mugele2015a
). The intricate coupling between air film dynamics, droplet oscillations, and the resulting restitution is discussed from an experimental point of view, and by considering a single oscillation mode model that captures the key dynamics. At first glance one may think that the air film is elastically compressed, resulting in a reaction force which is permanently oriented upwards to reverse the droplet momentum. However, the excess pressure in the air film is low, as confirmed by a balance between drop inertia and gas pressure (Mani et al.
Reference Mani, Mandre and Brenner2010), and thus the air flow in the film must be considered to be incompressible. This is no problem as far as the energy picture is concerned, since the kinetic energy can be stored temporally in the surface of the drop, but it is a problem in terms of momentum transfer. When the lower side of the drop retracts from the surface, air is sucked into the air film below the drop. Hence the squeeze force on the droplet should be directed downwards, i.e. become a suction force, while the momentum is supposed to grow in the upward direction. So, how can a drop bounce on air?
We analyse the bouncing process in terms of an energy picture, i.e. the conversion from CM energy to internal energy and backwards, using the side view recordings to obtain the drop shape and trajectory. Second, we analyse the evolution of the drop–air interface from the bottom view interferometric data in order to estimate the evolution of the pressure distribution in the film. Thus we can investigate the role of the squeeze force exerted onto the drop, necessary to reverse the momentum of the drop during the bounce. The associated dissipation in the air film is compared to the total energy loss in each bounce (as obtained from the side view). In § 2 we present our experimental approach, while in § 3 the analysis of the recorded data is discussed as well as how to obtain the kinetic and potential energy from the droplet shape evolution. Here we will also explain how to obtain the squeeze force and the dissipation in the air layer from the evolution of the film profile. In § 4 the results of the bouncing and squeeze-out analysis are discussed. Moreover, a simple ‘single oscillation mode’ model will be presented to explain the bouncing on a purely dissipative force. We conclude our findings in § 5.
2. Experiments
The droplets are quasi-statically dispensed from a syringe needle and detached by their own weight to obtain a uniform radius that depends only on liquid properties and outer needle diameter. The height of the needle above the substrate is varied between 5 and 15 mm, leading to impact velocities at first bounce between 0.22 and
 $0.49~\text{m}~\text{s}^{-1}$
. We use three types of substrates to test the influence of surface wettability: fully wettable polished glass wafers with a roughness below 3 nm as verified by atomic force microscopy; the same glass wafers hydrophobized with a UV-cured silicon oil layer (Arayanarakool et al.
Reference Arayanarakool, Shui, van den Berg and Eijkel2011) to obtain a contact angle of
 ${\sim}90^{\circ }$
; and a series of (super)hydrophobic substrates with root-mean-square roughness varying between 8 and 100 nm. The latter are produced by oxygen plasma etching of a
 ${\sim}5~{\rm\mu}\text{m}$
thick SU-8 photoresist layer on a glass wafer, which is subsequently coated with a
 $\text{C}_{4}\text{F}_{8}$
layer to obtain an advancing contact angle of 155° and a roughness-dependent receding contact angle of 120°–150° (Tsougeni et al.
Reference Tsougeni, Vourdas, Tserepi, Gogolides and Cardinaud2009). The hydrophilic glass wafers are rigorously cleaned ultrasonically and exposed to a plasma treatment to prevent any irregularities that can cause premature formation of contact. The substrates are transferred to the cuvette containing the set-up shortly before the experiments are performed, to avoid the settlement of dust particles from the air.
We use drops with varying liquid density
 ${\it\rho}$
, viscosity
 ${\it\mu}$
, and surface tension
 ${\it\sigma}$
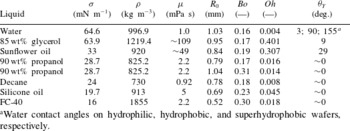
. The seven liquids tested are listed in table 1 in order of decreasing surface tension: water, 85 wt% glycerol (Sigma-Aldrich) in water, sunflower oil (commercial kitchen oil), 90 wt% propanol (Merck KGaA) in water, n-decane (Merck KGaA), silicone oil (
 ${\it\mu}=5~\text{mPa}~\text{s}$
, Aldrich), and fluorinert FC-40 (Sigma). All aqueous solutions contain 0.01 wt% rhodamin to suppress reflections from the top side of the drop at the 546 nm interference signal. This leads to a small decrease in the surface tension of water to
 $64.6~\text{mN}~\text{m}^{-1}$
. The drop radius
 $R_{0}$
varies between 0.52 and 1.03 mm, and is correlated with the fluid properties (in particular surface tension) when detached from a needle with fixed outer diameter (0.24 mm). For propanol drops we also used a larger needle to obtain two different drop sizes.
Properties of the liquids tested. All aqueous solutions contain 0.01 wt% rhodamin to suppress reflections at the 546 nm interference signal. The equilibrium contact angle
 ${\it\theta}_{Y}$
is measured in an independent experiment with a gently deposited drop.

a Water contact angles on hydrophilic, hydrophobic, and superhydrophobic wafers, respectively.
Upon first impact the drops have Weber numbers
 $\mathit{We}={\it\rho}R_{0}v^{2}/{\it\sigma}=0.64\dots 4.3$
(
 $v$
: impact velocity), indicating that both inertia and surface tension play a role in the bouncing dynamics. Due to finite energy losses in the bouncing process, the drop is subject to a cascade of consecutive bouncing events with progressively reduced maximum rise height (see figure 1
a) and thus reduced impact velocity. Effectively, each subsequent impact is a separate experiment, in which the drop is gently released from a somewhat lower initial height leading to a correspondingly lower impact velocity and Weber number. During this bouncing cascade Weber numbers as low as
 $O(10^{-3})$
are obtained; this cannot be obtained by direct release from a needle, which would create a liquid bridge to the very near substrate due to drop stretching. Two other dimensionless numbers are given in table 1: the Ohnesorge number
 $\mathit{Oh}={\it\mu}({\it\sigma}{\it\rho}R_{0})^{-1/2}$
and the Bond number
 $\mathit{Bo}={\it\rho}gR_{0}^{2}/{\it\sigma}$
, representing the ratio of viscosity and gravity to surface tension, respectively. In particular, we analyse the bouncing behaviour for liquid drops with low
 $\mathit{Oh}\ll 1$
for which the dissipation in the liquid can be calculated using the potential flow assumption. However, air-film-mediated bouncing also exists for high-viscosity fluids (glycerol, sunflower oil), albeit with much shorter bouncing cascades.
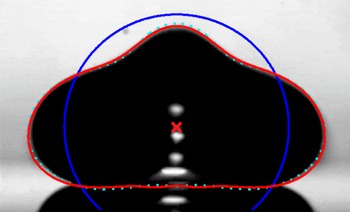
Shape mode decomposition of the droplet interface: mode
 $n=0$
(blue circle), and superposed modes
 $n\leqslant 4$
(cyan dotted) and
 $n\leqslant 10$
(red). The centre of mass position
 $y_{cm}$
is indicated by the red
 $\times$
.

The experiments are performed at room temperature and under ambient pressure and recorded with three synchronized high-speed cameras. The full bouncing sequence is recorded in side view at 4000 f.p.s. (Photron-FASTCAM Ultima 512) to obtain contour images of the drop. In addition the air film is imaged using dual-wavelength reflection interference microscopy (de Ruiter et al. Reference de Ruiter, Oh, van den Ende and Mugele2012). The two resulting signals are recorded separately at 20 000 f.p.s. with two high-speed cameras (Photron SA3 and SA5).
3. Analysis of the recorded data
3.1. Side view
During the bouncing series, the drop retains its radial symmetry with respect to the vertical axis. This is in contrast to larger drops (
 $R_{0}>2~\text{mm}$
) levitated on a steady, but relatively fast, ascending air flow (Bouwhuis et al.
Reference Bouwhuis, Winkels, Peters, Brunet, van der Meer and Snoeijer2013), or in the Leidenfrost state (Caswell Reference Caswell2014), in which experiments the radial symmetry was broken, leading to star-shaped drop oscillations. Moreover, their air film is non-axisymmetric (Caswell Reference Caswell2014), while radial symmetry is clearly present in the current experiment, as shown in the bottom line of figure 1(b).
Hence, the time-dependent droplet contour
 $R(t,{\it\theta})$
can be obtained from the side view images. We use Laplacian edge detection, and decompose the shape in terms of Legendre polynomials
 $P_{n}(x)$
(Oh, Ko & Kang Reference Oh, Ko and Kang2008; Oh, Legendre & Mugele Reference Oh, Legendre and Mugele2012):
 $$\begin{eqnarray}R(t,{\it\theta})=R_{0}+\mathop{\sum }_{n=0}^{\infty }c_{n}(t)P_{n}(x),\end{eqnarray}$$
with
 $R_{0}=(3V/(4{\rm\pi}))^{1/3}$
where
 $V$
is the volume of the drop, and
 $x=\cos {\it\theta}$
where
 ${\it\theta}=0$
is in the upward direction. Modes up to
 $n=10$
are included to obtain a sufficiently flat bottom (with respect to the pixel resolution) when the droplet is interacting with the substrate: see figure 2. The coefficients can be calculated from the drop profile
 $R(t,{\it\theta})$
using the orthogonality of the Legendre polynomials
 $\int _{-1}^{1}P_{n}(x)P_{m}(x)\,\text{d}x=2{\it\delta}_{nm}/(2n+1)$
(Oh et al.
Reference Oh, Ko and Kang2008, Reference Oh, Legendre and Mugele2012):
 $$\begin{eqnarray}c_{n}(t)=\frac{2n+1}{2}\int _{-1}^{1}\{R(t,{\it\theta})-R_{0}\}P_{n}(x)\,\text{d}x.\end{eqnarray}$$
Here, the coefficients
 $c_{2}\,\dots \,c_{10}$
give the contributions of the respective shape modes superposed on a sphere with radius
 $R_{0}+c_{0}$
, where
 $c_{0}$
allows for volume conservation in the case of non-negligible deformations. Similarly, the coefficient
 $c_{1}$
compensates for the centroid shift due to the higher modes. The analysis centre should be equal to
 $y_{CM}$
to correctly separate the CM motion and internal flow. To this end the following procedure has been used: for each time frame the drop edge is detected with respect to the vertical symmetry axis
 $x=x_{0}$
, yielding an averaged drop contour
 $(x_{i},y_{i})$
. Using an initial estimate for
 $y_{CM}(t)$
, a tentative
 $R(t,{\it\theta})$
profile is extracted with a step size in the cosine of the polar angle
 ${\rm\Delta}\text{cos}\,{\it\theta}=10^{-3}$
over the interval
 $-1\leqslant \cos {\it\theta}\leqslant 1$
. The
 $c_{n}$
obtained by numeric integration of (3.2) yield a shape decomposition using (3.1) and a corresponding correction to the centroid height estimate
 $(3/4)\int _{-1}^{1}xR^{4}(t,{\it\theta})\,\text{d}x/\!\int _{-1}^{1}R^{3}(t,{\it\theta})\,\text{d}x$
. The procedure is repeated with an updated
 $R(t,{\it\theta})$
profile until the correction term reaches zero, and thus the correct
 $y_{CM}$
is found.
The droplet interface oscillations are now fully captured by the coefficients
 $c_{0}(t),c_{1}(t),c_{2}(t)\,\dots \,c_{10}(t)$
, and the CM motion by
 $y_{CM}$
. Its trajectory during flight is parabolic in time, which can be used to accurately calibrate the pixel size (
 $17.96~{\rm\mu}\text{m}~\text{pixel}^{-1}$
) knowing the acceleration
 $g=9.81~\text{m}~\text{s}^{-2}$
(we estimated that the drag force is smaller than 2 %, and thus negligible). This pixel size is used for calibration of the length scale in the recorded pictures. The derivatives
 ${\dot{y}}_{CM}$
and
 $\ddot{y} _{CM}$
(
 ${\dot{c}}_{n}$
resp.) are determined by fitting a second-order polynomial to the
 $y_{CM}(t)$
data (
 $c_{n}$
data resp.) over the interval
 $[t-2{\rm\Delta}t,t-{\rm\Delta}t,t,t+{\rm\Delta}t,t+2{\rm\Delta}t]$
, where
 ${\rm\Delta}t=0.25~\text{ms}$
. From this polynomial the slope and second derivative at time
 $t$
are obtained. An example of the CM trajectory and the first four modes of the shape decomposition are shown later in § 4 in figures 5 and 9 respectively.
From the CM motion
 $y_{CM}(t)$
we extract its potential and the kinetic energy, and the net external force
 $F$
acting on the drop:
 $$\begin{eqnarray}\displaystyle & U_{CM}={\it\rho}Vgy_{CM}, & \displaystyle\end{eqnarray}$$
 $$\begin{eqnarray}\displaystyle & \displaystyle K_{CM}={\textstyle \frac{1}{2}}{\it\rho}V{{\dot{y}}_{CM}}^{2}, & \displaystyle\end{eqnarray}$$
 $$\begin{eqnarray}\displaystyle & F={\it\rho}V(\ddot{y} _{CM}+g). & \displaystyle\end{eqnarray}$$
Next we consider the internal potential and kinetic energy involved in the droplet shape variations. The (potential) surface energy of the deformed droplet is linear in the area,
 $U_{int}={\it\sigma}A_{surf}$
, given by
 $$\begin{eqnarray}U_{int}=2{\rm\pi}{\it\sigma}\int _{0}^{{\rm\pi}}R\sin {\it\theta}\sqrt{R^{2}+(\partial _{{\it\theta}}R)^{2}}\,\text{d}{\it\theta},\end{eqnarray}$$
with
 $R=R(t,{\it\theta})$
the angle-dependent radius of the droplet. In the limit of small deformations this expression reduces to
 $U_{int}\simeq 2{\rm\pi}{\it\sigma}\!\int _{-1}^{1}\{R^{2}+(\partial _{{\it\theta}}R)^{2}/2\}\,\text{d}x$
, where
 $x=\cos {\it\theta}$
. Using the shape decomposition in (3.1) one obtains
 $$\begin{eqnarray}U_{int}=2{\rm\pi}{\it\sigma}\mathop{\sum }_{n=2}^{\infty }\frac{(n-1)(n+2)}{2n+1}c_{n}^{2}\end{eqnarray}$$
up to second order in the coefficients
 $c_{n}$
(see appendix A for details). This can be written in the usual form as
 $U_{int}=\sum _{n=2}^{\infty }(k_{eff,n}c_{n}^{2})/2$
with the effective spring constant
 $k_{eff,n}=4{\rm\pi}{\it\sigma}(n-1)(n+2)/(2n+1)$
, which quickly converges to a linearly increasing
 $k_{eff,n}\approx 2n{\rm\pi}{\it\sigma}$
for
 $n\geqslant 2$
. That is, higher-frequency modes are stiffer as their creation causes a large increase in surface area. Since we calculate the potential energy both exactly with (3.6) and in the linear approximation with (3.7), we can use their difference as an estimate of the accuracy of the linear approximation. The latter is used to determine the (internal) kinetic energy and dissipation in the flow field, which is strictly only valid for
 $c_{0}\rightarrow 0$
, that is, for small amplitudes of the fundamental mode
 $c_{2}<0.1R_{0}$
. Thus, during the relatively large drop deformations in the bounce or ‘quasi-contact’ phase we would like to have an estimate of the accuracy of the linear approximation. As will be shown later in figure 10(b), the linear approximation overestimates the potential energy with 20 % for the first bounce, but they fully agree for later bounces.
The internal kinetic energy and dissipation depend on the details of the flow field. Since viscosity plays a minor role, we assume potential flow
 $\boldsymbol{v}=\boldsymbol{{\rm\nabla}}{\it\varphi}$
, which, due to liquid incompressibility, satisfies Laplace’s equation,
 ${\rm\nabla}^{2}{\it\varphi}=0$
. The solution of this equation is given by
 $$\begin{eqnarray}{\it\varphi}(r,{\it\theta})=\mathop{\sum }_{n=1}^{\infty }A_{n}r^{n}P_{n}(x)\end{eqnarray}$$
in spherical coordinates, where
 $A_{n}$
is the strength of mode
 $n$
. The corresponding radial and tangential velocities are given by
 $u_{r}(r,{\it\theta})=\partial _{r}{\it\varphi}(r,{\it\theta})$
and
 $u_{{\it\theta}}(r,{\it\theta})=r^{-1}\partial _{{\it\theta}}{\it\varphi}(r,{\it\theta})$
. For small deformations the normal vector
 $\boldsymbol{n}$
can be replaced by the radial unit vector
 $\hat{\boldsymbol{e}}_{r}$
and we obtain for the displacement at the interface of the drop (
 $r=R_{0}$
):
 $\partial _{t}R({\it\theta})=u_{r}(R_{0},{\it\theta})=\sum _{n=1}^{\infty }nA_{n}{R_{0}}^{n-1}P_{n}(x)$
. Comparing this with our shape decomposition in (3.1), we find
 $$\begin{eqnarray}{\dot{c}}_{n}=nA_{n}R_{0}^{n-1}.\end{eqnarray}$$
Thus, the relation between
 $c_{n}$
and
 $A_{n}$
is straightforward, yet only for small amplitudes such that the condition implied by (3.9) (
 $c_{0}=0$
) is fulfilled. However, for large amplitudes of the fundamental mode
 $c_{2}>0.1R_{0}$
(i.e. during a bounce) the relation between
 $c_{n}$
and
 $A_{n}$
becomes very complicated as energy is transferred between modes due to nonlinear coupling. For example, Becker, Hiller & Kowalewski (Reference Becker, Hiller and Kowalewski1991) have formulated a nonlinear inviscid model that evaluates the kinematic and normal stress boundary conditions at the deformed droplet surface
 $R({\it\theta},t)$
instead of the equilibrium spherical droplet. Here, we will restrict ourselves to the linear approximation using the
 $c_{n}$
values during the ‘quasi-contact’ phase as an estimate of the flow field.
Given the velocity potential (3.8), we calculate the kinetic energy
 $K_{int}=$
(
 ${\it\rho}\int \boldsymbol{{\rm\nabla}}{\it\phi}\boldsymbol{\cdot }$
 $\boldsymbol{{\rm\nabla}}{\it\phi}\,\text{d}V$
)
 $/2$
. Using the relation
 $\boldsymbol{{\rm\nabla}}\boldsymbol{\cdot }({\it\phi}\boldsymbol{{\rm\nabla}}{\it\phi})=\boldsymbol{{\rm\nabla}}{\it\phi}\boldsymbol{\cdot }\boldsymbol{{\rm\nabla}}{\it\phi}+{\it\phi}{\rm\nabla}^{2}{\it\phi}=\boldsymbol{{\rm\nabla}}{\it\phi}\boldsymbol{\cdot }\boldsymbol{{\rm\nabla}}{\it\phi}$
and the divergence theorem, the integral over the volume of the droplet is converted to a surface integral
 $K_{int}=({\it\rho}\int {\it\phi}(\boldsymbol{n}\boldsymbol{\cdot }\boldsymbol{{\rm\nabla}}{\it\phi})\,\text{d}A)/2$
. In the small deformation limit this expression reads
 $K_{int}={\rm\pi}{\it\rho}R_{0}^{2}\int _{0}^{{\rm\pi}}({\it\varphi}\partial _{r}{\it\varphi})|_{R_{0}}\sin {\it\theta}\,\text{d}{\it\theta}$
. Evaluating it yields
 $$\begin{eqnarray}K_{int}=2{\rm\pi}{\it\rho}R_{0}^{3}\mathop{\sum }_{n=1}^{\infty }\frac{1}{n(2n+1)}{\dot{c}}_{n}^{2}\end{eqnarray}$$
(see again appendix A for details). The kinetic energy can be written in the usual form as
 $K_{int}=\sum _{n=2}^{\infty }(m_{eff,n}{\dot{c}}_{n}^{2})/2$
, with the effective mass for oscillation given by
 $m_{eff,n}=3M/(2n^{2}+n)$
, where
 $M$
is the total mass of the droplet. The effective mass decreases with increasing mode number as the flow field gets more localized towards the surface region for higher-frequency oscillations.
Although potential flow assumes that the fluid is inviscid, we can calculate the dissipation in the flow field in the limit of low fluid viscosity, i.e. small
 $\mathit{Oh}$
number. The internal dissipation rate is given in terms of the rate of strain tensor
 $\unicode[STIX]{x1D63F}$
by
 ${\dot{E}}_{drop}^{visc}=\int (2{\it\mu}\unicode[STIX]{x1D63F}:\unicode[STIX]{x1D63F})\,\text{d}V$
. It can be shown that (Moláček & Bush Reference Moláček and Bush2012)
 $$\begin{eqnarray}{\dot{E}}_{drop}^{visc}=8{\rm\pi}{\it\mu}R_{0}\mathop{\sum }_{n=1}^{\infty }\frac{n-1}{n}{\dot{c}}_{n}^{2}.\end{eqnarray}$$
These expressions for the energy and the dissipation will be used in § 4 to analyse the bouncing process. (Here we consider a water droplet for which potential flow can be assumed. Miller & Scriven (Reference Miller and Scriven1968) derived an expression for arbitrary
 $\mathit{Oh}$
, which was used by Moláček & Bush (Reference Moláček and Bush2012) to display the coefficients that modify expressions (3.10) and (3.11), respectively, as a function of both
 $\mathit{Oh}$
and mode number.) Moreover, from (3.7) and (3.10) we obtain the well-known Rayleigh frequencies for a freely oscillating droplet by evaluating
 $\partial _{t}(K_{int}+U_{int})=0$
:
 $$\begin{eqnarray}{\it\omega}_{n}=({\it\sigma}/{\it\rho}R_{0}^{3})^{1/2}\sqrt{n(n-1)(n+2)}.\end{eqnarray}$$
3.2. Bottom view
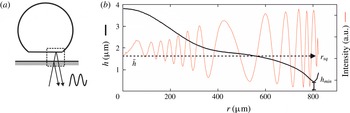
During each bounce the air film is imaged in reflection mode through the transparent substrate by dual-wavelength reflection interference microscopy (DW-RIM) at the 436 and 546 nm spectral lines (each with a bandwidth of
 ${\sim}30~\text{nm}$
) of a mercury lamp: see figure 3(a). The interference pattern is radially symmetric, as shown in figure 1(b), while the non-monotonic spacing of the fringes indicates a rather complex radial thickness profile of the air layer with several inflection points. We compare the intensity with a comprehensive RIM model taking into account the finite aperture of the optics, as well as the wavelength distribution of the lamp and the spectral sensitivity of the cameras (de Ruiter, Mugele & van den Ende Reference de Ruiter, Mugele and van den Ende2015b
). This yields an absolute film thickness profile
 $h(r,t)$
of the so-called ‘dimple’ with an absolute accuracy of approximately 30 nm: see figure 3(b). We analysed the 20 000 f.p.s. recordings with a time step between 0.1 and 0.25 ms aiming at hundred interface profiles per bounce. The observed region is finite: outside the kink the interference pattern quickly vanishes as the slope of the drop interface becomes too large to be resolved (
 ${>}3^{\circ }$
).
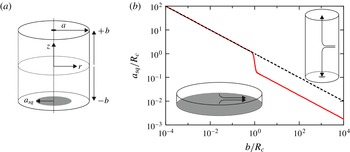
Bottom view analysis: air film thickness during the bounce phase. (a) Sketch of the thin film interference. (b) The radial intensity profile (thin red line) and the corresponding interface profile (thick black line). The squeezed film radius
 $r_{sq}$
, the minimum film thickness
 $h_{min}$
, and the volume-averaged film thickness
 $\overline{h}$
(dashed line) are indicated. Partly reproduced from de Ruiter et al. (Reference de Ruiter, Lagraauw, van den Ende and Mugele2015a
, figure 1).

For each bouncing event the interference pattern is observed for a finite time span in which the squeezed air film expands radially and again recedes, while no real liquid–solid contact is established. This time span corresponds (within the resolution of order 0.1 ms) to the ‘quasi-contact’ time during which the droplet interface is flattened by the air pressure build-up. When the impact Weber number drops below a critical value during the bouncing cascade, the ‘quasi-contact’ time becomes infinite, i.e. the air film remains continuously squeezed to a micrometric layer with a local maximum at the dimple centre. The drop no longer visibly detaches from the substrate in side view images, but simply oscillates. In the bottom view images the interference pattern remains visible permanently (until the film collapses) and oscillates as well. This stage will be denoted ‘hovering’ instead of ‘bouncing’. For the film thickness profile
 $h(r,t)$
obtained during each ‘quasi-contact’ phase we determine some characteristic quantities as defined in figure 3(b). The dimple volume is
 $V_{sq}(t)=\int _{0}^{r_{sq}(t)}h(r)2{\rm\pi}r\,\text{d}r$
, with
 $r_{sq}$
the radius of the squeezed film. Additionally, the average height
 $\overline{h}(t)=V_{sq}/({\rm\pi}r_{sq}^{2})$
, and the minimum film thickness
 $h_{min}(t)$
at the position
 $r_{min}(t)$
are determined. This minimum thickness is critical for the stability of the film.
The flow in the squeezed air layer can be described in the lubrication limit because the layer has a thickness
 $h\approx 1~{\rm\mu}\text{m}$
while its radius
 $r$
varies from
 $10^{2}$
to
 $10^{3}~{\rm\mu}\text{m}$
. Moreover, the gas film can be considered as incompressible, as determined by the balance between drop inertia and viscous stresses in the gas film (Mani et al.
Reference Mani, Mandre and Brenner2010): the dimensionless compressibility parameter
 ${\it\varepsilon}=O(100)\gg 1$
for a typical water droplet impact. In that case the continuity relation leads to a simple relation between the interface profile
 $h(r,t)$
and the radial volumetric flow rate
 $\dot{Q}(r)$
expressed as
 $\text{d}\dot{Q}(r)/\text{d}r=-2{\rm\pi}r{\dot{h}}(r)$
. Hence
 $$\begin{eqnarray}\dot{Q}(r)=-2{\rm\pi}\int _{0}^{r}s{\dot{h}}(s)\,\text{d}s,\end{eqnarray}$$
or, in terms of the averaged velocity
 $\overline{v}(r)=\dot{Q}(r)/(2{\rm\pi}rh(r))$
,
 $$\begin{eqnarray}\overline{v}(r)=-\frac{1}{rh(r)}\int _{0}^{r}s{\dot{h}}(s)\,\text{d}s.\end{eqnarray}$$
The axial dependence of the velocity field can be obtained from the reduced Stokes equations
 $$\begin{eqnarray}\displaystyle & \partial _{r}p={\it\mu}\partial _{z}^{2}v, & \displaystyle\end{eqnarray}$$
 $$\begin{eqnarray}\displaystyle & \partial _{z}p=0. & \displaystyle\end{eqnarray}$$
 $v(r,z)$
that is quadratic in
 $z$
, resulting in a parabolic flow profile. The exact shape of the profile is determined by the boundary conditions: we assume a no-slip condition at the gas–substrate interface, i.e.
 $v(r,0)=0$
, while we consider partial slip at the gas–droplet interface, i.e. at
 $z=h(r)$
, depending on the mobility of the droplet interface. It has been shown that a liquid interface with impurities has a finite mobility that allows the gas to slip along the interface and have a finite velocity at the boundary (Chesters Reference Chesters1991). For a fully mobile interface we assume
 $(\partial _{z}v)_{h}=0$
, for a fully immobile interface
 $v(r,h)=0$
. To interpolate between these limiting cases we introduce a coefficient
 $1\leqslant {\it\alpha}\leqslant 2$
(
 ${\it\alpha}=1$
, no slip;
 ${\it\alpha}=2$
, full slip). The resulting velocity profile is given by
 $$\begin{eqnarray}v(r,z)={\it\beta}({\it\alpha})\overline{v}(r)\left\{\left(\frac{z}{{\it\alpha}h(r)}\right)-\left(\frac{z}{{\it\alpha}h(r)}\right)^{2}\right\},\end{eqnarray}$$
where the normalization factor is given by
 ${\it\beta}({\it\alpha})=6{\it\alpha}^{2}/(3{\it\alpha}-2)$
to ensure that the height-integrated velocity profile is equal to the total height times the average velocity, i.e.
 $\int _{0}^{h(r)}v_{r}(r,z)\,\text{d}z=h(r)\overline{v}(r)$
. The local dissipation rate per unit volume in the film is given by
 $\dot{{\it\varepsilon}}(r,z)=2{\it\mu}\unicode[STIX]{x1D63F}:\unicode[STIX]{x1D63F}={\it\mu}(\partial _{z}v)^{2}$
. So the local dissipation rate
 ${\dot{w}}_{sq}(r)\,\text{d}r=2{\rm\pi}r\,\text{d}r\int \dot{{\it\varepsilon}}(r,z)\,\text{d}z$
in a shell with thickness
 $\text{d}r$
is given by
 $$\begin{eqnarray}{\dot{w}}_{sq}\,\text{d}r=24{\rm\pi}{\it\mu}\left[\frac{3{\it\alpha}^{2}-6{\it\alpha}+4}{(3{\it\alpha}-2)^{2}}\right]\overline{v}^{2}(r)\frac{r}{h(r)}\,\text{d}r.\end{eqnarray}$$
Equation (3.18) integrates to the total dissipation rate
 ${\dot{W}}_{sq}=\int _{0}^{R_{max}}{\dot{w}}_{sq}\,\text{d}r$
, where the film extends over a lateral distance
 $R_{max}$
. For a parallel plate geometry (
 $\partial _{r}{\dot{h}}=0$
and no-slip) this reduces to the classical solution for the total dissipation rate
 ${\dot{W}}_{sq}=(3/2){\rm\pi}{\it\mu}{\dot{h}}^{2}h^{-3}R^{4}$
.
Equivalently, we can calculate the pressure field in the squeeze flow and determine the squeeze force. By substitution of the velocity profile (3.17) in the Stokes equation (3.15), we find the pressure gradient,
 $\partial p/\partial r=-(6{\it\mu}/{\rm\pi}(3{\it\alpha}-2))(\dot{Q}(r)/rh(r)^{3})$
, which is integrated to obtain the excess pressure
 ${\rm\Delta}p(r)$
in the air film:
 $$\begin{eqnarray}{\rm\Delta}p(r)=p(r)-p_{\infty }=\frac{6{\it\mu}}{{\rm\pi}(3{\it\alpha}-2)}\int _{r}^{\infty }\frac{\dot{Q}(s)}{sh^{3}(s)}\,\text{d}s,\end{eqnarray}$$
where
 $p_{\infty }$
is the ambient pressure outside the squeezed layer. The squeeze force can be determined by integrating the pressure over the film area:
 $$\begin{eqnarray}F_{sq}=\int _{0}^{\infty }2{\rm\pi}r{\rm\Delta}p(r)\,\text{d}r=\frac{6{\it\mu}}{(3{\it\alpha}-2)}\int _{0}^{\infty }\frac{s\dot{Q}(s)}{h^{3}(s)}\,\text{d}s.\end{eqnarray}$$
The partial slip pre-factor decreases from 1 to
 $1/4$
when the boundary condition changes from no-slip to full slip at the droplet interface. For the analysis of our experiments we use the no-slip condition in line with the previous numerical work (Smith, Li & Wu Reference Smith, Li and Wu2003; Hicks & Purvis Reference Hicks and Purvis2010; Mani et al.
Reference Mani, Mandre and Brenner2010).
4. Results and discussion
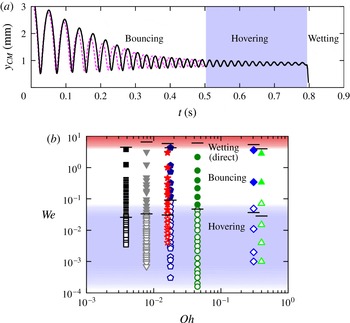
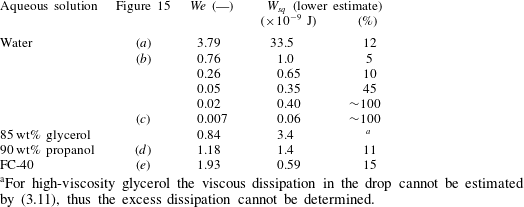
The air-film-mediated bouncing scenario is universally observed for all tested liquids. A representative example of a bouncing series is depicted in figure 4(a). It shows the centre of mass trajectory of a water drop bouncing on a hydrophilic glass wafer (black line). After a 0.8 s bouncing time we observe a sudden change in the CM height and an abrupt
 ${\sim}180^{\circ }$
to
 ${\sim}3^{\circ }$
change in contact angle, marking the transition towards wetting. Direct visualization of the initial air film using interference microscopy (in § 4.2) will unambiguously confirm the non-wetting bouncing scenario. For now we observe that a very similar trajectory is found for an identical water drop bouncing on a wafer hydrophobized with a UV-cured silicon oil layer (magenta dashed line; small deviations are attributed to a 10 % difference in initial impact velocity). This demonstrates that the bouncing behaviour is independent of wettability, already strongly suggesting the presence of the aforementioned air film.
Universality of air-film-mediated bouncing: influence of wettability and liquid properties. (a) Bouncing series of a water droplet impacting on a hydrophilic (black;
 $v=0.22~\text{m}~\text{s}^{-1}$
) or hydrophobic wafer (magenta dashed;
 $v=0.20~\text{m}~\text{s}^{-1}$
).
 $\mathit{Oh}=0.004$
. (b) Occurrence of bouncing (solid symbols) and hovering (open symbols) for various liquids as a function of
 $\mathit{Oh}$
and
 $\mathit{We}$
: black squares, water; green triangles up, 85 wt% glycerol; blue diamonds, sunflower oil; red stars, 90 wt% propanol; grey triangles down, decane; olive circles, silicone oil; dark blue pentagons, fluorinert FC-40. Upper, red shaded area, high-speed impacts leading to immediate wetting due to air film collapse; white area, bouncing; lower, blue shaded area, hovering. The horizontal bars at the boundary of direct wetting-to-bouncing and bouncing-to-hovering show the predicted transitions based on critical film thickness,
 $\mathit{We}\,(h_{c}=200~\text{nm})$
(§ 4.2.1), and the onset of gravity effects,
 $\mathit{We}=\mathit{Bo}^{2}$
(§ 4.1.1), respectively. Partly reproduced from de Ruiter et al. (Reference de Ruiter, Lagraauw, van den Ende and Mugele2015a
, figure 3).

Very similar behaviour comprising a subsequent bouncing, hovering and wetting phase can be observed for both high and low surface tension fluids when the Weber number of the initial impact is below
 ${\sim}4$
(de Ruiter et al.
Reference de Ruiter, Lagraauw, van den Ende and Mugele2015a
). Figure 4(b) shows the bouncing behaviour of the fluids listed in table 1: for each fluid we selected a single experiment (de Ruiter et al.
Reference de Ruiter, Lagraauw, van den Ende and Mugele2015a
) obtained at the maximum impact velocity that still yielded a bouncing series, in favour of immediate wetting upon the first impact. For each subsequent impact event of this experiment,
 $\mathit{We}$
is calculated from the maximum value of the CM velocity
 $v=\max |({\dot{y}}_{CM})|$
obtained just before the impact. The results are plotted as a function of the Ohnesorge number
 $\mathit{Oh}$
. For a wide range of surface tensions and liquid viscosities (table 1) spanning two orders of magnitude in
 $\mathit{Oh}$
, air-film-mediated bouncing and hovering are observed in a universal
 $\mathit{We}$
regime spanning three to four orders of magnitude. However, the number of bounces decreases with
 $\mathit{Oh}$
due to larger viscous losses upon increasing liquid viscosity and/or surface deformability. For the detailed discussion of the bouncing process we consider the longest bouncing series obtained, which occurred for a water drop with
 $\mathit{Oh}=0.004$
.
4.1. Shape dynamics of the droplet during the bouncing
The bouncing series of a water droplet with
 $R_{0}=1.03~\text{mm}$
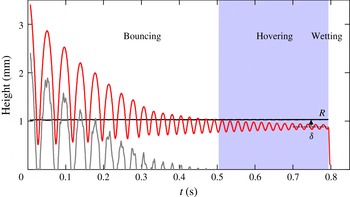
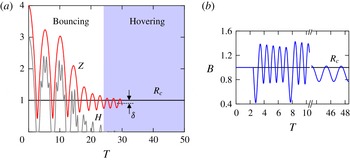
, recorded with the side view camera, is shown in detail in figure 5. The centre of mass of the droplet is released from
 $h_{0,eff}=3.61~\text{mm}$
, resulting in an initial impact velocity of
 $0.22~\text{m}~\text{s}^{-1}$
, i.e.
 $\mathit{We}=0.76$
. The red line shows the height of the centre of mass obtained from the shape mode analysis. The full bouncing sequence takes less than one second, during which the droplet bounces 16 times on the substrate, followed by a hovering stage (shaded) with 15 oscillations on a continuously present air film. The air film thickness,
 $h_{c}(t)=y_{CM}(t)-\sum _{n=0}^{\infty }c_{n}(t)P_{n}(-1)$
, below the centre of the droplet (grey line) becomes very thin during each bounce, but cannot be resolved accurately enough to measure micrometric thicknesses. (The bottom view analysis, described in the next section, will do.) The maximum flight height decreases with each bounce, and thus
 $\mathit{We}$
decreases progressively. In the final hover oscillation
 $\mathit{We}$
is only 0.004. Thereafter, solid–liquid contact is established and the droplet wets the substrate (see figure 5).
Bouncing series of an
 $R_{0}=1.03~\text{mm}$
droplet impacting on a flat glass substrate with an initial velocity of
 $0.22~\text{m}~\text{s}^{-1}$
. Time evolution of the CM height (red, upper curve) and macroscopic air layer thickness (grey, lower curve) obtained from the side view images. The bouncing series can be subdivided into a bouncing phase and a hovering phase (shaded) that shows an equilibrium sag
 ${\it\delta}$
, followed by wetting. Partly reproduced from de Ruiter et al. (Reference de Ruiter, Lagraauw, van den Ende and Mugele2015a
, figure 2).

4.1.1. Centre of mass trajectory and interaction time
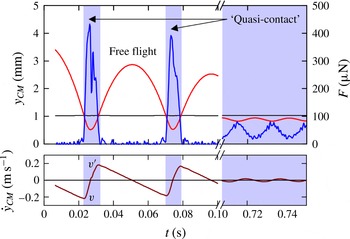
For each single bounce the centre of mass (CM) motion can be subdivided into two phases, a free flight and ‘quasi-contact’: see figure 6. During the flight the interaction force is zero and the CM motion is fully decoupled from the droplet oscillation. The CM trajectory is parabolic in time with constant gravitational acceleration, so the speed increases linearly in time upon approaching the substrate. In contrast, during the ‘quasi-contact’ phase the droplet interacts via the squeezed air layer with the substrate (the grey line in figure 5 is practically zero), and the motion of the centre of mass is directly linked to the droplet deformation. The droplet can be viewed as a liquid resonator powered by energy of the centre of mass that is converted into internal kinetic and elastic surface energy. The droplet stretches laterally while the CM height decreases down to about half the droplet radius for the first bounce: see the middle snapshot in figure 1. The maximum speed
 $v=\text{max}|({\dot{y}}_{CM})|$
is reached at the end of the flight phase and defines the
 $\mathit{We}$
number of the impact: see figure 6. During the deformation, the CM velocity decreases to zero. Subsequently the velocity is reversed and the droplet bounces off with velocity
 $v^{\prime }=\max ({\dot{y}}_{CM})$
. During the ‘quasi-contact’ phase the droplet thus experiences an acceleration that must be caused by the interaction with the air film. The blue line in figure 6 shows the interaction force
 $F$
with a time resolution of about 1 ms, as calculated with (3.5). The force is double (sometimes single) peaked and is always positive, as would be the case for a normal force in the case of elastic contact. We will discuss this observation when analysing the nature of the force in a later section.
Velocity and estimated interaction force for the experiment shown in figure 5. (a) Time evolution of the CM height (red) and interaction force (blue, peaked during ‘quasi-contact’) derived from the CM acceleration. (b) CM velocity (dark red). The first two bounces are shown (
 $t<0.10$
), as well as a few hovers (
 $0.70<t<0.75$
). The blue shaded area indicates interaction with the substrate, i.e. ‘quasi-contact’.

What happens during the subsequent bounces? Due to energy dissipation and transfer to internal modes, the droplet bounces back to a smaller height in the next flight phase, and its subsequent impact velocity will be lower. Ultimately the free-flight phase is fully eliminated and the drop hovers on an air film of micrometric thickness. Now, the motion of the centre of mass is permanently linked to the shape oscillations. The interaction force does not decrease to zero any more as the droplet is continuously in ‘quasi-contact’ with the substrate via the air film. The (late) time-averaged interaction force converges to the gravitational force (
 $46~{\rm\mu}\text{N}$
in figure 6) when the droplet approaches its equilibrium shape. This equilibrium shape is not spherical but flattened, as it constitutes a small gravitational sag
 ${\it\delta}$
which is the result of a balance between gravity and surface tension,
 ${\it\delta}/R_{0}\sim \mathit{Bo}$
(Mahadevan & Pomeau Reference Mahadevan and Pomeau1999). The observed sag indeed increases with
 $\mathit{Bo}$
and ranges from
 ${\it\delta}/R_{0}\approx 0.15$
for drops of water (
 $\mathit{Bo}=0.16$
; figure 5) to 0.23 for drops of FC-40 (
 $\mathit{Bo}=0.30$
), in good agreement with the prediction.
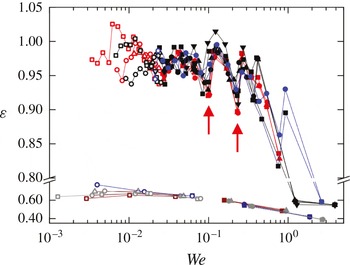
The overall bouncing behaviour can be described by the restitution coefficient. The restitution coefficient is defined as the ratio between maximum velocities after and before the bounce,
 ${\it\varepsilon}=v^{\prime }/v=\sqrt{\mathit{We }^{\prime }/\mathit{We}}$
: see figure 6. It is plotted in figure 7 as function of
 $\mathit{We}$
for water and glycerol drops, for three bouncing series each with different initial impact speeds. For a water droplet with
 $R=1.03~\text{mm}$
the restitution coefficient is approximately constant over most of the
 $\mathit{We}$
range and has a value of
 $0.96\pm 0.04$
, similar to the restitution coefficient found by Richard & Quéré (Reference Richard and Quéré2000) for bouncing on a superhydrophobic substrate – which may also involve an air film. The restitution coefficient in figure 7 shows a characteristic fluctuation pattern versus
 $\mathit{We}$
, which is remarkably independent of the initial fall height. The fluctuation in restitution is related to a coupling between the oscillation time of the dominant mode
 $n=2$
(see § 4.1.2) and the flight time. The restitution is maximal when at the moment of impact the droplet is stretching towards oblate, since the bottom interface velocity is then minimized (Biance et al.
Reference Biance, Chevy, Clanet, Lagubeau and Quéré2006). On the other hand, when at impact the drop is contracting from a prolate shape, the restitution is expected to show a local minimum. The latter is indeed the case for the impacts indicated with an arrow in figure 7.
The dependence of the restitution coefficient
 ${\it\varepsilon}$
on impact
 $\mathit{We}$
for experiments with 1.03 mm water droplets (initially released from various needle heights: red, 5 mm; blue, 11 mm; black, 15 mm) and 0.95 mm glycerol droplets (in the lower part of the graph: dark red, 5 mm; dark blue, 8 mm; grey, 10 mm). Solid symbols denote the bouncing phase, while open symbols denote the hovering phase. The red arrows denote the sixth and ninth bounce of the experiment in figure 9, for which coupling of the oscillation and flight time (i.e. impact within the prolate shape) leads to a relatively low restitution coefficient.

While the restitution coefficient suddenly drops to zero when solid–liquid contact is made at low
 $\mathit{We}$
, at the other limit of
 $\mathit{We}\sim 1$
it decreases more gradually. This can be explained by the large droplet deformation: at higher impact velocity the restitution coefficient is largely determined by the transfer of energy to large-amplitude droplet oscillations rather than dissipation in the liquid or the squeeze layer. With a simple liquid spring free of dissipation, Biance et al. (Reference Biance, Chevy, Clanet, Lagubeau and Quéré2006) showed that for
 $\mathit{We}>1$
the speed after take-off does not depend on the impact speed or the compression of the spring, and is given by
 $v^{\prime }\sim \sqrt{{\it\sigma}/({\it\rho}R)}$
. It can then be easily shown that the second bounce should have
 $\mathit{We}\sim 1$
; this jump is indeed observed in figure 7. This implies that for each initial impact condition
 $\mathit{We}>1$
the drop falls into a very similar trajectory after the first bounce. As a result the number of bounces remains remarkably constant, i.e. 16–18 for water droplets. Moreover, from figure 7 we observe that the restitution coefficient and thus the number of bounces depends on the droplet viscosity: the restitution coefficient of highly viscous glycerol droplets is about 0.7 and leads to only two bounces.
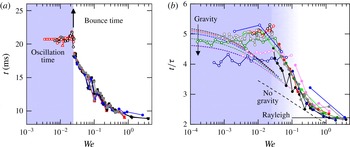
In the absence of real liquid–solid contact during the ‘quasi-contact’ or bounce phase, its interaction time is defined as the period during which the interaction force is non-zero. Within the experimental time resolution, this is equivalent to the period during which the interference pattern of the air film is visible. The interaction times for the impact of a 1.03 mm water droplet are shown in figure 8(a): for the successive bounces the interaction time increases while
 $\mathit{We}$
decreases. Again, the results from the various experiments at different initial impact velocity collapse perfectly. Also, for hydrophilic and hydrophobic substrates we observe no difference. The interaction time is approximately 9.1 ms for bounces at
 $\mathit{We}\sim 1$
, and increases towards 18.5 ms for the last bounce. Subsequently, the interaction time abruptly becomes infinite at
 $\mathit{We}\sim 0.02$
, which is the onset of the hover stage. During the hovering we can instead measure the oscillation time of the droplet (and the dimple), which is 20.7 ms.
The dependence of interaction time on
 $\mathit{We}$
. (a) A 1.03 mm water droplet is released from various initial heights (red, blue and black data set) onto a glass substrate, or a hydrophobic cured silicon oil layer (grey). In the bouncing phase the interaction time of individual bounces can be obtained (closed symbols), while at the onset of the hovering phase (shaded blue) the interaction time suddenly becomes infinite (see arrow) and we instead measure the oscillation time (open symbols). (b) Normalization of the interaction time by
 ${\it\tau}=({\it\rho}R_{0}^{3}/{\it\sigma})^{1/2}$
for experiments with droplets of water (black), 85 wt% glycerol (green), sunflower oil (blue), 90 wt% propanol with
 $R_{0}=0.79~\text{mm}$
and 1.04 mm (red and pink respectively), decane (grey), silicone oil (olive), and FC-40 (dark blue). Solid line, Rayleigh free oscillation time; dashed line, numerical results from Moláček & Bush (Reference Moláček and Bush2012) in the absence of gravity (
 $\mathit{We}\gg \mathit{Bo}^{2}$
); short dashed lines, analytical solutions from Moláček & Bush (Reference Moláček and Bush2012) for a droplet oscillating around its equilibrium position (
 $\mathit{We}\ll \mathit{Bo}^{2}$
).

Simple scaling theory of a weakly deformed liquid drop (
 $\mathit{We}\ll 1$
) shows that the contact time of a non-wetting bounce is described by a characteristic time
 ${\it\tau}=({\it\rho}R_{0}^{3}/{\it\sigma})^{1/2}$
(Richard, Clanet & Quéré Reference Richard, Clanet and Quéré2002; Okumura et al.
Reference Okumura, Chevy, Richard, Quéré and Clanet2003). The contact time then scales as
 $t_{c}/{\it\tau}\approx A(\mathit{Bo},\mathit{We},\mathit{Oh})$
, where
 $A$
is a function of the three dimensionless numbers relating the importance of gravity, inertia and viscosity to surface tension. In our experiments we consider only two of them since viscosity effects are assumed negligible at all times,
 $\mathit{Oh}\ll 1$
. In figure 8(b) the rescaled interaction time
 $t_{c}/{\it\tau}$
is plotted for eight bounce series with different liquid droplets. In the bounce phase all data collapse, and the abrupt transition to hovering is observed for all liquids – yet the obtained oscillation time and the
 $\mathit{We}$
number at the transition both vary with
 $\mathit{Bo}$
. We think this is due to gravity. Gravity effects are negligible at the beginning of the bounce series, but are expected to become dominant when
 $\mathit{We}$
decreases and the droplet oscillates around its equilibrium shape. Okumura et al. (Reference Okumura, Chevy, Richard, Quéré and Clanet2003) show that the transition between these two regimes is given by
 $\mathit{We}\sim \mathit{Bo}^{2}$
. Within our small range of
 $\mathit{Bo}$
numbers studied (0.16–0.31) the abrupt transition to hovering is in exact correspondence with this scaling; see also figure 4(b) (with small deviation at higher
 $\mathit{Oh}$
). We can now explain the limiting behaviour as follows: for large
 $\mathit{We}$
the droplet is expected to approach the Rayleigh free oscillation time of the dominant
 $n=2$
mode,
 $t_{free}/{\it\tau}=2{\rm\pi}/\sqrt{8}\sim 2.22$
(see (3.12)). This is indeed the case, as indicated by the black horizontal line. On the other hand, in the weak deformation limit of
 $\mathit{We}\rightarrow 0$
the calculations of Chevy et al. (Reference Chevy, Chepelianskii, Quéré and Raphael2012) show that the oscillation time depends on
 $\mathit{Bo}$
: for increasing influence of gravity, the deformation of the droplet is stronger and it behaves in a stiffer way, i.e. the oscillation time decreases in the limit of
 $\mathit{We}\rightarrow 0$
. This decrease is confirmed in figure 8(b): see arrow. In fact, the global behaviour shows fair agreement with the limiting behaviour in the absence (black dashed line) and presence (coloured small dashed lines) of gravity for the logarithmic spring behaviour derived by Moláček & Bush (Reference Moláček and Bush2012). The remarkable difference, however, is the abrupt transition towards hovering, yielding a constant oscillation time very early on (at
 $\mathit{We}=\mathit{Bo}^{2}$
). This may be a consequence of the air film dynamics that were excluded from any previous models. Finally we stress here again that real contact is never made. Air-film-mediated bouncing thus adds another perspective to reducing the real contact time below the Rayleigh free oscillation time, as was achieved very recently using cleverly designed macrostructures (Bird et al.
Reference Bird, Dhiman, Kwon and Varanasi2013; Liu et al.
Reference Liu, Moevius, Xu, Qian, Yeomans and Wang2014).
4.1.2. Droplet oscillations
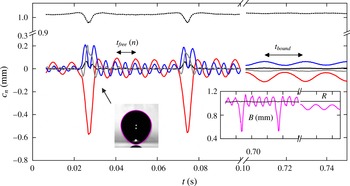
So far we have mainly considered the CM motion of the droplet. In addition, during ‘quasi-contact’ the droplet becomes deformed to buffer the energy needed for recoil. Since not all energy is transferred back to the centre of mass, the drop subsequently oscillates during the flight. The magnitude of the oscillation depends on impact velocity and droplet properties such as size, surface tension and viscosity. Let us consider the oscillations associated with the trajectory of an
 $R_{0}=1.03~\text{mm}$
water droplet impacting at
 $0.22~\text{m}~\text{s}^{-1}$
as in figure 5. The most significant coefficients
 $c_{n}$
of the mode decomposition, i.e. up to
 $n=4$
, are shown in the main panel of figure 9. During the bounce phase the decrease in the mean radius
 $R_{0}+c_{0}$
and a small
 $c_{1}$
contribution show that the small-amplitude approximation is not valid here. Thus we need some caution in using the
 $c_{n}$
values to describe the potential flow inside the droplet. For now, we look at the surface decomposition itself. Amongst the orders
 ${\geqslant}2$
, the dominant mode is
 $n=2$
with a oscillation time of 9.1 ms (
 $\pm 0.1$
). Due to its clear dominance, the second mode sets the free oscillation time of the overall drop, that is, the variation of the drop height as shown in the right inset of figure 9. The other oscillation times are 4.7 and 3.0 ms for the
 $n=3$
and 4 modes, and all show perfect agreement with their respective Rayleigh frequencies, (3.12). The independence of modes is only observed during the free-flight phase; during the ‘quasi-contact’ phase all modes up to
 $n=4$
are abruptly forced into the same phase, as the droplet becomes deformed by interaction with the squeezed air layer. The result is a single peak for the
 $n=2$
mode and a double peak for the
 $n=3$
mode. With each subsequent bounce the amplitudes of all modes during the ‘quasi-contact’ decrease. Gradually the frequencies of the modes change such that in the hover phase all modes are synchronized with the motion of the centre of mass. The transition is most clear for the
 $n=3$
mode, which initially shows two peaks during a bounce, gradually merged into one. For the
 $n=2$
mode the characteristic time for ‘quasi-contact’ merely increases. In the final hover stage shown in figure 9 the synchronized oscillation time is 20.7 ms.
Shape mode decomposition using Legendre polynomials for the bouncing series shown in figure 5, for
 $n=0$
(black dotted line, shifted by constant
 $R_{0}$
),
 $n=1$
(black solid line), and in order of decreasing amplitude:
 $n=2$
(red),
 $n=3$
(blue), and
 $n=4$
(grey) versus time. The first two bounces are shown (
 $t<0.10$
), as well as a few hovers with equilibrated gravitational sag (
 $0.70<t<0.75$
). The free oscillation time depends on the mode,
 $t_{free}=9.1$
, 4.7, 3.0 ms for
 $n=2\dots 4$
, whereas during hovering the modes are synchronized,
 $t_{bound}=20.7~\text{ms}$
. Left inset, moment of lift-off after the first bounce. Right inset, overall drop deformation in terms of the half droplet height (magenta).

It is important to note that the oscillation modes with
 $n>2$
are critical for the bouncing dynamics. The left inset of figure 9 shows the lift-off after the first bounce. Near the contact point the droplet interface has a high curvature due to a favourable superposition of positive even modes
 $n=2$
and 4 and negative odd mode
 $n=3$
. Thus, the superposition of higher modes can lead to a significant decrease in the ‘quasi-contact’ area that is critical for a high-restitution lift-off.
From the mode decomposition the half droplet height
 $B=\sum _{n=0}^{\infty }c_{n}(t)[P_{n}(1)+P_{n}(-1)]/2$
has been calculated and is shown in the right inset (magenta) of figure 9 for the first two bounces and the last few hover oscillations. During the first few bounces, the droplet deforms in the vertical direction to about half its original size, while the oscillations during the intermediary free-flight phase are significantly smaller. They also show a slight decay due to viscous dissipation in the droplet. During the successive bounces the
 $\mathit{We}$
number decreases and so does the droplet deformation. Consequently the intermediate flight time gets shorter and the bouncing pattern gradually transforms into the single oscillation pattern that can be observed in the hover phase.
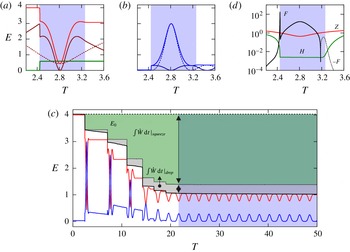
Energy conversion and dissipation for the experiment in figure 5. (a,b) First bounce showing the conversion of the kinetic (dark solid line) and potential (dark dashed line; the thin dashed line shows the linear approximation) parts of (a) the total CM energy and (b) the total internal energy. (c) Total energy (black solid line), total energy plus the calculated internal dissipation (black dotted line;
 ${\rm\Delta}E_{drop}^{visc}$
is indicated by the grey region), and excess viscous dissipation
 ${\rm\Delta}E_{excess}^{visc}$
(green region) to explain the difference from the total initial energy
 $E_{0}$
. Partly reproduced from de Ruiter et al. (Reference de Ruiter, Lagraauw, van den Ende and Mugele2015a
, figure 5).

4.1.3. Energy transfer and dissipation
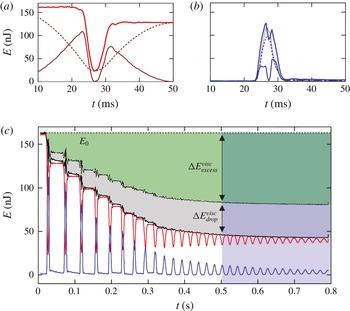
The transfer during the bounce of CM energy to internal energy (i.e. oscillation energy) and subsequent dissipation in the internal flow have previously been described as the primary source of dissipation in non-contact bouncing of droplets (Richard & Quéré Reference Richard and Quéré2000). The main reason for this is the relatively long flight time compared to the contact time. However, in our experiments the free oscillations have small amplitude, and their weak decay in figure 9 shows that there is little dissipation during the flight. We thus need to take into account the dissipation during the ‘quasi-contact’ phase. Using the side view experiments we cannot only derive the CM energy but also the internal energy of the drop from the shape mode decomposition. Figure 10(a,b) shows the energy conversion during the first bounce. The CM energy in figure 10(a) is converted from gravitational to kinetic energy without any losses during the approach flight. A very small scatter is observed in the constant CM energy (162 nJ before the first bounce) because of the inaccuracy in the position determination of the centre of mass. Only during ‘quasi-contact’ do the CM dynamics couple to the oscillation dynamics, and CM energy is temporarily buffered into internal energy while the drop is strongly decelerated. However, a large part of the energy is restored in the CM motion while the drop lifts off, again yielding a constant but slightly lower CM energy of 128 nJ. The internal energy is shown in figure 10(b). During the ‘quasi-contact phase’ the internal flow field has two peaks in the kinetic energy – one before and one after the maximum deformation of the droplet – while the potential energy is maximum when the flow reverses. In the transition to the subsequent flight phase the drop keeps a small residual oscillation energy of 6 nJ, continuously converting kinetic and potential energy with a weak decay due to dissipation.
Figure 10(c) shows the sum of the droplet energy
 $E_{tot}=E_{CM}+E_{int}$
plotted in black. We calculate the internal dissipation
 ${\rm\Delta}E_{drop}^{visc}$
(grey area) by time-integration of (3.11), and add this term to the droplet energy (resulting in the black dotted line). During the flight phases this sum is constant (plateaus in the black dotted line) which implies that the small decay in internal drop energy (blue) is indeed due to
 ${\rm\Delta}E_{drop}^{visc}$
, while the CM energy (red) is conserved. However, accumulated over an entire bounce series, the above-mentioned viscous dissipation during the flight phases amounts to only 20 % of the total energy loss of the droplet. During the short ‘quasi-contact’ phases another 10 % is dissipated via this mechanism but most of the energy (70 %) is dissipated via another mechanism, not yet identified. After each ‘quasi-contact’ or bounce the CM energy has decreased significantly while the internal energies just before and after a bounce are nearly equal. This loss in CM energy cannot be fully accounted for by the internal dissipation
 ${\rm\Delta}E_{drop}^{visc}$
, as evidenced by the clear jump in the black dotted line. (The scatter during each ‘quasi-contact’ phase is due to limitations of the linear decomposition of the drop shape. As dissipation is always negative, the black curves should be monotonically decreasing.) The green area in figure 10(c) indicates the ‘excess’ dissipation
 ${\rm\Delta}E_{excess}^{visc}$
, cumulative over the entire bouncing series. It represents the missing 70 % of the total energy loss, dissipated during the ‘quasi-contact’ phases. Inaccuracies of the linear approximation during ‘quasi-contact’, as suggested by the 10 % reductions in
 $R_{0}+c_{0}$
in figure 9, are expected to cause deviations of the order of 20 %, and yet the amount of
 ${\rm\Delta}E_{excess}^{visc}$
shown in figure 10(c) suggests a second dissipation channel, namely dissipation in the lubricating air layer.
4.2. Air film dynamics during bouncing
4.2.1. Interface shape
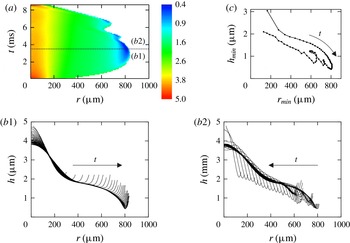
The interaction of the droplet with the squeezed air layer during ‘quasi-contact’ can be analysed from the film thickness profiles as obtained from the bottom view images using interferometry. As an example, figure 11 shows the evolution of the air film for the first impact of a water drop bouncing series at
 $\mathit{We}=0.76$
. A height plot of the air film evolution in time is shown in figure 11(a), while the corresponding thickness profiles are plotted in two separate figures: figure 11(b1) shows the spreading of the confined film up to the maximum lateral extension, while figure 11(b2) shows the contraction phase. The transient film has a typical height of only
 $1~{\rm\mu}\text{m}$
while the lateral extension is about 1 mm, resulting in a small
 $O(10^{-3})$
height-to-radius aspect ratio. The air film is thus remarkably flat. However, if we stretch the
 $y$
-axis as in figure 11(b), we observe the typical thickness profile of the air film. The largest film thickness is attained in the centre of the film (i.e. the droplet–air interface is dimpled), and the film is bounded by a ‘kink’ of high interfacial curvature where the film thickness is minimum (near the rim of the film). Outside this kink the interfacial slope diverges.
Time evolution of the squeezed air film during the first bounce phase for an
 $R_{0}=1.01~\text{mm}$
water droplet (
 $v=0.22~\text{m}~\text{s}^{-1}$
) shown in figure 13. (a) Contour plot
 $h(r,t)$
of the film height as a function of radial position and time. The corresponding interface profiles are shown with
 ${\rm\Delta}t=0.1~\text{ms}$
for (b1) the spreading stage up to 3.6 ms, and (b2) the contraction stage up to 8.6 ms. As the minimum is hard to follow in these diagrams, we show the time evolution of this minimum explicitly in (c), which clearly reveals the curling motion at the turning point. Partly reproduced from de Ruiter et al. (Reference de Ruiter, Lagraauw, van den Ende and Mugele2015a
, figure 4).

First of all, an obvious condition for non-contact bouncing is the presence of an air film during the full ‘quasi-contact’ phase. This requires a minimum film thickness larger than
 ${\sim}200~\text{nm}$
on glass substrates (de Ruiter et al.
Reference de Ruiter, Oh, van den Ende and Mugele2012, Reference de Ruiter, Lagraauw, van den Ende and Mugele2015a
): when the film thickness becomes smaller, liquid–solid contact is formed and bouncing is inhibited. It was shown that for larger
 $\mathit{We}\gtrsim 1$
the minimum film thickness develops around the shoulder near
 $r=300~{\rm\mu}\text{m}$
: see figure 11(b1). For increasing
 $\mathit{We}$
it is at this location where the film thins to the critical value needed to obtain liquid–solid contact. Mandre et al. (Reference Mandre, Mani and Brenner2009) demonstrated the influence of surface tension on the minimum film thickness: the strong curvature near the shoulder generates a capillary pressure that prevents further thinning of the air film. This leads to an equilibrium film thickness
 $h_{c}=5R~\mathit{Oh}_{g}^{8/9}\mathit{We}^{-10/9}$
, where the Ohnesorge number
 $\mathit{Oh}_{g}={\it\mu}_{g}({\it\sigma}{\it\rho}R_{0})^{-1/2}$
is the ratio between gas viscosity and surface tension and inertia. Hence,
 $h_{c}$
decreases with
 $\mathit{We}$
. We previously verified this scaling in our experiments (de Ruiter et al.
Reference de Ruiter, Oh, van den Ende and Mugele2012), and use it here to estimate the critical Weber number for which
 $h_{c}<200~\text{nm}$
, and bouncing is inhibited. Since
 $\mathit{Oh}_{g}$
only varies by a factor of two for millimetre-sized droplets, the film is expected to collapse when
 $\mathit{We}\gtrsim 4{-}6$
, which is a narrow range independent of liquid properties. These predictions are plotted in figure 4(b) and are in good agreement with experiments in which
 $\mathit{We}$
is pushed to its maximum limits while still obtaining a bounce series.
From figure 11 one observes that the evolution of the air film during spreading and contraction of the drop is not time-symmetric: the height plot in figure 11(a) shows that the spreading phase is significantly shorter, and the size of the confined air film grows monotonically up to its maximum extension. During the contraction phase however, the air film shows repeated small contractions and expansions. Figures 11(b1, b2) provide more detail on this asymmetry. During the spreading phase in figure 11(b1) the interface unfolds ever more outwards, while the inner region remains almost unchanged. The initial stagnation area under the centre of the droplet expands into an ever larger region, and the interface moves almost vertically outside this stagnation region. In contrast, during the contraction phase shown in figure 11(b2), the outer kink moves inward towards the centre of the film. Simultaneously the minimum thickness gradually increases after some initial wiggles that coincide with the contraction/expansion cycles. The typical ‘curling’ behaviour of the kink is shown by plotting the air film thickness versus the position of the kink in figure 11(c). It is important to note that the air film thickness inside the kink still decreases but it increases outside the kink as the drop ‘peels off’ the substrate. The pronounced asymmetry between the spreading and the receding phase turns out to be crucial for the bouncing process, as we will see in the next section.
The air film shapes obtained for subsequent bounces can be described by a few simple characteristic parameters, despite the film complexity. As discussed in § 3.2, we use the volume of the air film
 $V_{sq}$
, its average height
 $\overline{h}$
, and its minimum film thickness
 $h_{min}$
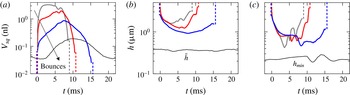
, which determines whether the squeezed air layer is stable so that no liquid–solid contact is formed. Figure 12 shows the time evolution of these parameters for a few selected bounces. As expected, all parameters vanish or diverge outside the ‘quasi-contact’ phase, i.e. when the drop is not interacting with the substrate, and we verify again that the ‘quasi-contact’ time increases during a bouncing series until it becomes infinite at the onset of the hover stage (thin black lines). In the hover stage each oscillation continuously passes into the next one as the droplet interface is permanently deformed.
Time evolution for successive bounces of (a) squeezed film volume, (b) average and (c) minimum film thickness. Three bounces are shown from the experiment in figure 13,
 $\mathit{We}=0.76$
, 0.26, 0.05 (grey, bounce 1; red, 5; blue, 12), and one hover oscillation,
 $\mathit{We}=0.007$
(black, 10).

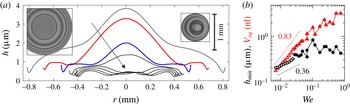
For successive bounces the maximum volume of trapped air decreases from typically 3 to 0.2 nl: see figure 12(a). We plot the maximum entrapped volume as a function of the Weber number of the bounce in figure 13(b). The increase in dimple volume with
 $\mathit{We}$
is characteristic for the low-velocity regime in which capillarity smooths out the dimple. When the inertia of the drop becomes important, for
 $\mathit{We}>1$
, the dimple volume again decreases with
 $\mathit{We}$
, leading to a maximum in dimple volume (Bouwhuis et al.
Reference Bouwhuis, van der Veen, Tran, Keij, Winkels, Peters, van der Meer, Sun, Snoeijer and Lohse2012; Klaseboer, Manica & Chan Reference Klaseboer, Manica and Chan2014; de Ruiter et al.
Reference de Ruiter, van den Ende and Mugele2015c
). The latter regime is not reached in the experiment of figure 13. We obtain the scaling
 $\tilde{V}_{sq}\sim \mathit{We}^{0.83}$
in the hovering phase (i.e. the limit of small
 $\mathit{We}$
), which is slightly stronger than the exponent of
 $1/2$
predicted in the low-velocity regime (Bouwhuis et al.
Reference Bouwhuis, van der Veen, Tran, Keij, Winkels, Peters, van der Meer, Sun, Snoeijer and Lohse2012). The volume decrease is strongly linked to the decrease in spreading radius
 $r_{sq}$
from
 ${\sim}0.8~\text{mm}$
in the first bounce to only
 ${\sim}0.4~\text{mm}$
in the hover stage, as shown in figure 13(a).
Interference signals and shape of the air film at minimum thickness for successive bounces. (a) The same bounces as in figure 12, as well as hover oscillations 1, 3, 5, 7, and 9 (
 $\mathit{We}=0.02\dots 0.008$
). Insets: snapshots of the film at maximum lateral extension for the first bounce (left) and the ninth hover (right). The 1 mm scale bar relates to both snapshots. (b) Absolute minimum of the film thickness (black circles) with accompanying dimple volume (red triangles) for all bounces and hover oscillations (closed and open symbols respectively).

The average film thickness decreases as shown in figure 12(b), thus the droplet interface on average approaches the substrate closer and closer with each bounce. However, the minimum film thickness exhibits a rather random behaviour. For each bounce in figure 12(c) it shows several oscillations in time, indicating that the kink comes down repeatedly or new kinks are formed. For the stability of the air film we are interested in the spatiotemporally obtained absolute minimum thickness during each bounce. The air film profiles obtained at the instant of minimum film thickness are shown in figure 13(a). No trend is observed in the minimum film thickness during the bouncing stage, which is confirmed for a full bouncing series in figure 13(b): it varies between 300 and 900 nm depending on the details of the squeeze-out. This is sufficiently large (
 ${>}200~\text{nm}$
) to prevent solid–liquid contact during all subsequent ‘quasi-contacts’.
The dynamics in the hover stage are different. With decreasing
 $\mathit{We}$
the influence of surface tension becomes ever more prominent and the droplet interface shows smaller fluctuations (both in time and with radial position): see figures 12(c) and 13(a). In fact the vertical impulse on the droplet is too low to replenish the air film, and the centre of the dimple suddenly collapses to a height of, here, approximately 500 nm. From then on the centre of the dimple is more or less stationary and the droplet hovers on a micrometric air layer. The outer kink gradually approaches the substrate more closely with each oscillation until the critical film height of
 ${\sim}200~\text{nm}$
is reached and liquid–solid contact is established. Figure 13(b) shows the transition between the bouncing and the hover phase: the minimum film thickness in the hover phase shows a clear trend with
 $\mathit{We}$
. Empirically we find
 $\tilde{h}_{min}\sim \mathit{We}^{0.36}$
.
4.2.2. Momentum transfer and dissipation
Although the air viscosity is small, the effects of the viscous flow in the squeezed air film may become substantial if the shear rate and pressure gradient diverge, due to the small film thickness. Indeed we find a significant lower number of bounces than the maximum of 1000 that can be obtained in a Leidenfrost situation where the air film has a much larger thickness of about
 $100~{\rm\mu}\text{m}$
(Biance et al.
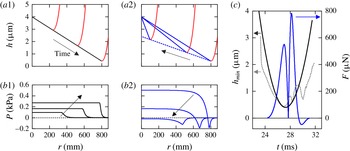
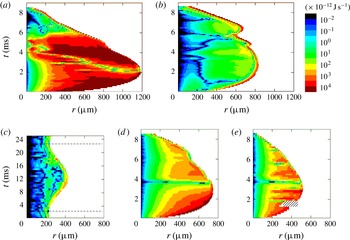
Reference Biance, Chevy, Clanet, Lagubeau and Quéré2006). This strongly suggests that air film dissipation is substantial. The build-up of a viscous pressure simultaneously leads to an upward force that decelerates the droplet and should provide the impulse to let the droplet bounce, i.e. reverse the drop velocity before continued air film thinning leads to formation of solid–liquid contact. For the experimental air film profiles we calculate the viscous squeeze force and the local dissipation rate, (3.20) and (3.18) respectively, using the lubrication equations.
We notice that the squeezed air film has an extreme radius-to-height aspect ratio, leading to the first naive approach of assuming a flat disk with time-dependent radius and radially invariant height – either
 $h_{min}(t)$
for an upper limit, or
 $\overline{h}(t)$
for a lower limit of the force and dissipation. However, the flat disk approximation fails because the viscous force is always oriented opposite to the direction of motion, implying a reversal of the force towards attractive as soon as the drop starts to move away from the substrate (lift-off) and air is flowing radially inward. For the bouncing drops this is evidently not the case as the force is repulsive at all times, as shown from the CM analysis in figure 6. This implies that the interface – at least locally – should exhibit a downward motion, to obtain a net outward air flow. An effective momentum transfer thus arises from the fact that the air film is not flat! The details of the kink motion as described in figure 11(b) are in fact essential to understanding the momentum reversal during the air cushioning quantitatively. Unfortunately, we miss crucial shape information outside the kink due to the steepness of the interface compared to the lateral resolution of the recording: all profiles abruptly end just outside the kink (see figure 11
b). As a result the squeeze force
 $F_{sq}$
cannot be determined from the experimental data as it relies on the unknown reference pressure just outside the measurable region. To overcome this problem we use a simple parametrization of the interface: figure 14(a) shows a sketch of the interface evolution that is generic for all our experiments. At each time, the radial description of the interface shape is given by a straight line from dimple centre to kink inside the kink, matched to a relatively steep parabola outside the kink, described with respect to the kink by
 ${\rm\Delta}h=a({\rm\Delta}r)^{2}$
(where
 $a=1.45\times 10^{-3}~{\rm\mu}\text{m}^{-1}$
for the experiment in figure 11). The kink moves along straight lines: for the experiment in figure 11 the kink approaches the substrate from
 $[r,z]=[0,4.0]$
to
 $[800,0.4]$
during the spreading phase (see figure 14
a1) and retracts along another straight line from
 $[r,z]=[800,0.4]$
to
 $[0,3.67]~{\rm\mu}\text{m}$
during the contraction phase (see figure 14(a2), while the dimple centre remains fixed at a height of
 $4~{\rm\mu}\text{m}$
. The approach and retraction of the kink is assumed to be parabolic in time (see figure 14
c, black line).
Role of air film asymmetry on interaction force. (a) Sketch of the idealized profiles showing the asymmetry in the spreading (a1) and contraction (a2) of the squeezed air layer: red, parabolic outer kink profile; black and blue, linear inner profile during spreading and contraction respectively. To stress the asymmetry, the kink height retracts in the sketch (blue dashed) to a lower value than in the actual parametrization. (b1,2) Examples of pressure profiles calculated from the idealized air film shape. (c) Integrated squeeze force (blue, right axis), together with the minimum air film height
 $h_{min}$
in the idealized case (black) and the actual experimental evolution (grey dotted). Partly reproduced from de Ruiter et al. (Reference de Ruiter, Lagraauw, van den Ende and Mugele2015a
, figures 2 and 4).

In this description the interface unfolds ever more outwards during the spreading phase, while the inner region is stationary. Hence, inside the kink no flow occurs, while outside the kink the flow radiates outwards, and thus the pressure inside the kink is positive. During the contraction phase the outer kink moves inwards but does not follow the slope of the interface, as indicated in figure 14(a2). Now there are two contributions to the flow field: outside the kink the interface moves back up, thus the flow is radially inwards, and the pressure gradient is positive. In addition the region inside the kink is shrinking, still leading to an effectively downward motion of the interface and thus leading to a radially outward flow, resulting in a negative pressure gradient. As a result the pressure is positive for the largest part of the dimple. The calculated pressure profiles are shown in figure 14(b1) during the spreading phase and in figure 14(b2) during the contraction phase. The integrated squeeze force is shown in figure 14(c). The calculated force
 $F_{sq}$
thus shows two positive peaks with a minimum around maximum drop extension. This is in good agreement with the interaction force
 $F$
obtained from the drop acceleration described in figure 6. Thus the squeeze force indeed provides the impulse necessary to reverse the drop momentum during the bounce. Further refinement of the result (e.g. elimination of the very small attractive force at the final lift-off) may be obtained by considering a more complex interface evolution: the idealized profiles in figure 14 now assume a simple parabolic approach of the kink in time: see the black line in figure 14(c). Instead one could also implement the repetitive up–down motion of the kink, as observed in the experiment (see grey dotted line), while still forcing the kink to move in a straight line in the
 $(r,h)$
space as in figure 14(a).
The corresponding viscous dissipation has been calculated from the original experimental air film data, but is restricted to the contribution within the measurable region. First we determine the local height-averaged velocity
 $\overline{v}$
of the squeezed air using (3.14). From this velocity and the film profile we calculate the local dissipation rate using (3.18). Very high local outward velocities up to
 ${\sim}0.1~\text{m}~\text{s}^{-1}$
are obtained, in particular in the narrow gap near the outer kink. The velocity is not monotonically increasing in the direction of the kink, in contrast to previous results by van der Veen et al. (Reference van der Veen, Tran, Lohse and Sun2012) where radially averaged rather than local velocities were considered. Instead, after formation of the first kink we also observe regions of moderately negative velocity in the inner region of the squeezed air film. However, the highest velocities are observed at the kink and are positive. This allows for the above-mentioned net outward flow. The local dissipation rate
 ${\dot{w}}_{sq}\,\text{d}r~(\text{J}~\text{s}^{-1})$
, integrated over the film height, is shown in a contour plot versus radial position and time in figure 15. Obviously, the dissipation rate is diverging (indicated in dark red) at the location where the air gap is both narrow and fast thinning, i.e. close to the outer kink, while the dissipation is negligible in the centre of the dimple which is almost stationary (cf. figure 11). This divergence is consistently observed for all experiments, although to a different extent, depending purely on the shape evolution of the dimple. For the bounce series of a water droplet the divergence at the kink is strongest for intermediate
 $\mathit{We}$
as in figure 15(b), while for lower and higher
 $\mathit{We}$
also significant dissipation is obtained in the inner region, as shown most clearly in figure 15(a).
Local dissipation rate in the air film. The local dissipation rate
 ${\dot{w}}_{sq}\,\text{d}r~(\text{J}~\text{s}^{-1})$
, with
 $\text{d}r=3.3~{\rm\mu}\text{m}$
, is plotted versus radial position and time for (a–c) the impact of an
 $R_{0}=1.03~\text{mm}$
droplet with
 $\mathit{We}=3.79$
, 0.76, 0.007, (d) the impact of an
 $R_{0}=0.79~\text{mm}$
90 wt% propanol droplet with
 $\mathit{We}=1.18$
, and (e) the impact of an
 $R_{0}=0.52~\text{mm}$
FC-40 droplet with
 $\mathit{We}=1.93$
(shaded: no data). The colour scale is logarithmic. The time axis in (c) is compressed by a factor of 3.

The local dissipation rate can be integrated in space and time to obtain the total energy
 $W_{sq}$
dissipated in the air film. Results are given in table 2. As expected
 $W_{sq}$
decreases during the bounce series of a water droplet because air is squeezed out more gently at lower drop momentum. For high-viscosity droplets (85 wt% glycerol),
 $W_{sq}$
is relatively high at similar
 $\mathit{We}$
due to the small air film thickness during the bounce. This is caused by the ‘stiffer’ droplet shape on short time scales due to the higher droplet viscosity. It is important to note that all measured dissipation values are a lower bound estimate, due to the divergence of the dissipation rate at the kink and the restricted field of view of the interference pattern at that location. Using rough parabolic extrapolations of the interface profiles in the neighbourhood of the kink, we expect that the region of high dissipation rate extends a bit further outside the kink, before it decreases steeply when the local film height diverges. So we miss the contribution from a small region just outside the kink. Nevertheless, we compare the estimated contribution of the air film dissipation with the excess dissipation determined from the side view analysis in § 4.1.3. Table 2 shows that the percentage of air film dissipation roughly increases during a bouncing series. Aside from the underestimation of air film dissipation just discussed, it can be expected that for high
 $\mathit{We}$
impacts part of the excess dissipation is accounted for by nonlinearities in the drop shape decomposition. At low
 $\mathit{We}$
the drop oscillations are extremely small and this contribution is negligible. Overall, a conservative estimate yields that air film dissipation accounts only partially for the excess energy loss at the first high-
 $\mathit{We}$
impacts and for the complete loss during later low-
 $\mathit{We}$
bouncing events.
Squeeze dissipation in various bounces: total dissipation measured in the confined region, and percentage of excess dissipation found in figure 10.

a For high-viscosity glycerol the viscous dissipation in the drop cannot be estimated by (3.11), thus the excess dissipation cannot be determined.
4.3. A single oscillation mode model
4.3.1. Model description
To explain the bouncing due to a purely dissipative squeeze force at least qualitatively, we model an impacting droplet as a deformable cylindrical pill box. The droplet has radius
 $a$
and height
 $2b$
. The minimal energy surface then demands
 $a=b=R_{c}$
, where
 $2{\rm\pi}R_{c}^{3}=V$
is the volume of the droplet. The mass is given by
 $=2{\rm\pi}R_{c}^{3}{\it\rho}$
, and the relative height by
 ${\it\beta}=b/R_{c}$
: see figure 16(a). The flow field within the drop is given by
 ${\dot{z}}=\dot{{\it\varepsilon}}z$
and
 ${\dot{r}}=-(\dot{{\it\varepsilon}}r)/2$
, where
 $\dot{{\it\varepsilon}}={\dot{b}}/b$
. Here
 $r$
and
 $z$
are constrained to
 $0\leqslant r\leqslant a=\sqrt{R_{c}^{3}/b}$
and
 $-b\leqslant z\leqslant b$
. For a bouncing drop we find the following expressions for the kinetic energy
 $K$
, the potential energy
 $U$
, and the dissipation rate
 ${\dot{W}}$
, in terms of the vertical droplet length
 $2b$
and the height
 $z$
of the centre of mass:
 $$\begin{eqnarray}\displaystyle & \displaystyle K={\textstyle \frac{1}{2}}M{\dot{b}}^{2}\left({\textstyle \frac{1}{3}}+{\textstyle \frac{1}{8}}{\it\beta}^{-3}\right)+{\textstyle \frac{1}{2}}M{\dot{z}}^{2}, & \displaystyle\end{eqnarray}$$
 $$\begin{eqnarray}\displaystyle & U=2{\rm\pi}{\it\sigma}R_{c}^{2}({\it\beta}^{-1}+2{\it\beta}^{1/2}-3)+Mgz, & \displaystyle\end{eqnarray}$$
 $$\begin{eqnarray}\displaystyle & {\dot{W}}=-6{\rm\pi}{\it\mu}R_{c}{\dot{b}}^{2}{\it\beta}^{-2}+({\dot{z}}-{\dot{b}})F_{sq}(b,{\dot{b}},z,{\dot{z}}), & \displaystyle\end{eqnarray}$$
 ${\dot{h}}F_{sq}$
, where
 $h=z-b$
is the air film thickness.
Properties of the ‘pill box’ droplet with height
 $2b$
and radius
 $a$
. (a) Sketch of the equilibrium droplet with the radius of the squeezed layer
 $a_{sq}$
shaded in grey. (b)
 $a$
(black dashed) and
 $a_{sq}$
according to (4.5) (red solid) versus
 $b$
. Insets: compressed and elongated droplet.

In our pill box model the bottom of the droplet is a flat disk, thus the squeeze force
 $F_{sq}$
is given by
 $$\begin{eqnarray}F_{sq}(b,{\dot{b}},z,{\dot{z}})=-\frac{3}{2}{\rm\pi}{\it\mu}a_{sq}^{4}(b)\frac{{\dot{z}}-{\dot{b}}}{(z-b)^{3}},\end{eqnarray}$$
where the radius of the squeezed layer
 $a_{sq}(b)$
in principle is given by the radius
 $a(b)=\sqrt{R_{c}^{3}/b}$
of the pill box. In the experiments, the droplet interface is flattening during the impact, which cannot be captured by our simple model. Instead, we implement a flat interface from the start as it ensures that the pressure increases rapidly enough to sustain a micrometre-thick air layer, in contrast to a spheroid model droplet where the pressure increases too gradually (
 ${\rm\Delta}p\sim h^{-1}$
only). This simple flat disk shape obviously has its limitations in capturing the exact mechanism of momentum transfer: we demonstrated experimentally that the asymmetric downward and inward motion of the kink is critical to sustaining a repulsive force. However, in the model the asymmetry will be induced via an asymmetry of the ‘quasi-contact’ radius during approach and lift-off. A completely symmetric bounce would lead to a zero momentum transfer; bouncing can only be achieved if the ‘quasi-contact’ area is on average larger during the approach phase than during the contraction. In the model this is achieved by the large elongation in the vertical direction (see figure 16
b) of the drop at lift-off, at the cost of large oscillations during the free-flight phase. To suppress these large oscillations we implemented an additional asymmetry,
 $a_{sq}(b)=f(b/R_{c})\sqrt{R_{c}^{3}/b}$
, where
 $$\begin{eqnarray}f({\it\beta})=\left\{{\it\epsilon}+\frac{1-{\it\epsilon}}{1+c{\it\beta}^{25}}\right\}^{1/4}\end{eqnarray}$$
with
 ${\it\epsilon}=0.001$
and
 $c=32.38$
: see the red curve and the grey shaded ‘quasi-contact’ areas in figure 16(b). Here the function
 $f({\it\beta})$
and the values for
 ${\it\epsilon}$
and
 $c$
are pragmatically chosen to optimize the model for the experimentally observed restitution.
As the drop makes no direct contact with the substrate, the squeeze force is, besides gravity, the only external force acting on the droplet. Hence, the momentum equation reads
 $$\begin{eqnarray}F_{sq}=M(\ddot{z}+g).\end{eqnarray}$$
Because
 $\partial _{t}(K+U)={\dot{W}}$
, we obtain a second differential equation which together with (4.6) describes the behaviour of both the CM height
 $z$
and the deformation of the droplet in terms of
 $b$
(see appendix B for details):
 $$\begin{eqnarray}{\it\alpha}M\ddot{b}=-F_{sq}-6{\rm\pi}{\it\mu}R_{c}{\dot{b}}-3{\rm\pi}{\it\sigma}R_{c}{\textstyle \frac{2}{3}}({\it\beta}^{-1/2}-{\it\beta}^{-2}),\end{eqnarray}$$
where
 $a\approx 11/24=0.46$
. In free flight when
 $F_{sq}=0$
, and for small deviations of
 ${\it\beta}$
from unity, (4.7) reduces to a damped harmonic oscillator equation (see appendix B). The resonance frequency and quality factor of this oscillator are given by
 ${\it\omega}_{ff}=(3{\rm\pi}{\it\sigma}/{\it\alpha}M)^{1/2}$
and
 $Q=(3{\rm\pi}{\it\sigma}{\it\alpha}M)^{1/2}/6{\rm\pi}{\it\mu}R_{c}$
, respectively. In the hovering state when
 $z=b$
, it again reduces to a damped harmonic oscillator equation, now with
 ${\it\omega}_{ho}=(3{\rm\pi}{\it\sigma}/(1+{\it\alpha})M)^{1/2}$
and
 $Q=(3{\rm\pi}{\it\sigma}(1+{\it\alpha})M)^{1/2}/6{\rm\pi}{\it\mu}R_{c}$
. So the ratio between the oscillation frequencies in the flight and hovering phase is equal to
 ${\it\omega}_{ff}/{\it\omega}_{ho}=\sqrt{1/{\it\alpha}+1}=1.8$
, which is in reasonable agreement with the observed ratio
 $T_{ho}/T_{ff}=2.3$
(cf. figure 9). Based on last value of this ratio we should estimate
 $a=0.23$
instead of
 $a=0.46$
.
Equations (4.6) and (4.7) can be written in dimensionless form, where the dimensionless heights
 $Z,H,B$
are obtained by scaling
 $z,h$
, and
 $b$
with
 $R_{c}$
and the dimensionless time
 $T$
by scaling
 $t$
with
 $t_{0}=(R_{c}/g)^{1/2}$
(
 ${\approx}10~\text{ms}$
for a millimetric drop):
 $$\begin{eqnarray}\ddot{Z}=-{\it\lambda}_{A}\frac{{\dot{H}}}{B^{2}H^{3}}-1\quad \text{and}\quad {\it\alpha}\ddot{B}={\it\lambda}_{A}\frac{{\dot{H}}}{B^{2}H^{3}}-{\it\lambda}{\dot{B}}-{\it\kappa}\frac{2}{3}(B^{-1/2}-B^{-2}),\end{eqnarray}$$
which depend on the four parameters
 ${\it\alpha},{\it\kappa},{\it\lambda}$
and
 ${\it\lambda}_{A}$
. Here,
 ${\it\kappa}=3{\it\sigma}/(2{\it\rho}gR_{c}^{2})=3/(2\mathit{Bo}_{c})$
represents the stiffness of the liquid spring,
 ${\it\lambda}=(3{\it\mu}/{\it\rho})(gR_{c}^{3})^{-1/2}$
the damping coefficient in the droplet and
 ${\it\lambda}_{A}=(3{\it\mu}_{air}/4{\it\rho})(gR_{c}^{3})^{-1/2}=1.58\times 10^{-4}$
the damping coefficient in the air.
To get better agreement with the experiments, the parameters
 ${\it\alpha},{\it\kappa}$
and
 ${\it\lambda}$
are determined as follows. The restitution of the bounce is largely determined by the effective mass in vibration;
 ${\it\alpha}$
is adapted using the effective mass in the potential flow assumption,
 ${\it\alpha}=3/(2n^{2}+n)$
. We choose
 $n=3$
, i.e. the lowest mode resulting in a flattened interface, leading to
 $a=1/7$
. Both
 ${\it\sigma}$
and
 ${\it\mu}$
are optimized to obtain the observed resonance frequency and quality factor. This yields estimates for
 ${\it\lambda}$
and
 ${\it\kappa}$
, i.e.
 ${\it\lambda}={\it\alpha}({\it\omega}_{0}t_{0})/Q$
and
 ${\it\kappa}={\it\alpha}({\it\omega}_{0}t_{0})^{2}$
. Experimentally we measure the oscillation and damping times of the second mode and find that
 ${\it\omega}_{0}t_{0}=6.61$
and
 $Q=97$
. This leads to
 ${\it\lambda}=1.01\times 10^{-2}$
and
 ${\it\kappa}=6.24$
.
4.3.2. Results: energy transfer and air film dynamics
We have solved (4.6) and (4.7) for
 $z$
and
 $b$
numerically, using the scaling just described. The result for an initial height
 $z_{0}/R_{c}=4$
is given in figure 17(a). The calculations show six bounces before the droplet starts and continues to hover; this phase extends infinitely as wetting is not implemented. Our main observation from figure 17(b) is that the oscillation amplitude during the flight phases is considerably larger than observed in the experiments (see also the inset of figure 9). This implies a significant transfer of energy to internal modes during lift-off of the droplet.
Calculated bouncing series for a pill box droplet. (a) Time evolution of CM height
 $Z$
(red, upper curve) and air layer thickness
 $H$
(grey, lower curve). The bouncing series can be subdivided into a bouncing phase and a hovering phase (shaded blue) that shows an equilibrium sag
 ${\it\delta}$
. This particular simulation extends to only
 $T=30$
, but more hover oscillations can be obtained afterwards. (b) Half droplet height
 $B$
. The first two bounces are shown, as well as a few hover oscillations with equilibrated gravitational sag. The time axis has been scaled on
 $t_{0}=10.2~\text{ms}$
. Compare to figures 5 and 9 respectively.

The energy transfer from the centre of mass to internal modes and backwards are shown in figure 18. Figure 18(c) shows the entire bouncing series. Similar to the experiments, the total droplet energy (black solid) shows a step decrease during each contact phase, and a gradual decrease during each flight. The latter is fully attributed to a decrease in internal droplet energy (blue) associated with a single dissipation channel, being dissipation in the internal fluid flow (grey shaded area). Indeed, the sum of the total droplet energy and the internal dissipation (black dotted) is conserved during the flight phases. However, the in-flight internal dissipation amounts to only 12 % of the total energy loss. The other 88 % is lost during the bounce phases, and fully attributed to squeeze dissipation (green shaded area). This squeeze dissipation is fully localized in time at the initial impact of each bounce. This is in line with the energy evolution near the first bounce in figure 18(a,b), where we observe a sudden conversion (to kinetic internal energy, dark blue) and dissipation of kinetic CM energy (dark red) at the approach near
 $T\sim 2.4$
. The abruptness is due to the diverging build-up of pressure in the air film resulting in a strongly peaked repulsive force. This divergence (see the black line in figure 18
d at
 $T\sim 2.4$
) is a consequence of the ‘flat plate’ description of the air film. The force decelerates the droplet interface almost instantaneously to a height
 $H\approx 0.003$
which remains almost constant afterwards while the force suddenly drops, preluding a gradual squeeze-out phase. In reality the droplet interface flattens from an initial spherical shape, which smooths the transition: both the dissipation (figure 15) and the interaction force (figure 6) show a much broader distribution. After the maximum lateral stretch of the model droplet at
 $T\sim 2.8$
the CM energy initially increases towards its former value, but decreases again shortly before detachment at
 $T\sim 3.2$
: see the red line in figure 18(a). Because the lower side of the drop moves upwards now, a small attractive force converts CM energy back into internal oscillations and the drop stretches vertically: see the blue line in figure 18(b) at
 $T\sim 3.2$
. This attractive force is indicated by the black dashed line in figure 18(d). In reality a very small attractive force occurs only at the final lift-off, if at all (see figures 6 and 14
c), resulting in a smaller oscillation amplitude and a higher restitution coefficient.
Energy conversion and air film dynamics. (a,b) Details of the first bounce showing the conversion of the kinetic (dark solid) and potential (dark dashed) contributions to (a) the total CM energy (red) and (b) the total internal energy (blue); (a) also shows the squeeze dissipation
 $\int {\dot{W}}\,\text{d}t|_{squeeze}$
(green, lower curve). (c) Total energy (black solid) and the sum (black dotted) of the total energy plus the internal dissipation
 $\int {\dot{W}}\,\text{d}t|_{drop}$
(grey shaded region), and squeeze dissipation (green shaded region).
 $E_{0}$
is the initial total energy. (d) Time evolution of the air film thickness
 $H$
(green), CM height
 $Z$
(red), and squeeze force
 $F$
(black) during the first bounce. The squeeze force becomes attractive in the final stage so
 $-F$
is plotted instead (dashed).

The single oscillation mode model thus successfully captures the energy conversion and dissipation during a non-wetting bounce; and at the same time it highlights the importance of asymmetry in the air film evolution for obtaining a high-restitution bounce. In the model the asymmetry is introduced by (4.5), which suppresses the attractive force at lift-off. This attraction would otherwise lead to large free oscillations at the cost of droplet momentum.
5. Conclusions
We have demonstrated that millimetre-sized droplets are able to bounce multiple times on flat solid substrates. This holds equally well for fluids with a high or low surface tension, and for wetting and non-wetting surfaces. The independence of wettability is explained by the presence of a squeezed air film, which has been observed using reflection interferometry. This micrometre-thick air film prohibits liquid–solid contact for
 $\mathit{We}\lesssim 4$
, largely independent of liquid properties. Moreover, we show that this air layer, and in particular its time-asymmetry in spreading and contraction, plays a crucial role in the momentum transfer of the droplet, a role that has often been overlooked or neglected in previous studies. In the low Weber number regime investigated (
 $\mathit{We}\lesssim 1$
), the local air film velocities are smaller than
 $0.1~\text{m}~\text{s}^{-1}$
, so the air film can be considered as incompressible, and the normal reaction force is purely dissipative. Assuming a flat droplet–air film interface, based on its extreme
 $r/h$
aspect ratio, leads to an attractive force when the lower side of the drop moves away from the substrate. In our numerical model it can be solved artificially by introducing a strong asymmetry in the size of the ‘quasi-contact’ area, and yet the experiments show asymmetry of a different nature, namely in the motion of the outer kink bounding the air film. The kink moves outwards and downwards in the approach phase, but inwards rather than upwards in the contraction phase: see figure 11. This leads to a net outward air flow and an upward force during the total ‘quasi-contact’ phase, as shown in figure 14, also during retraction. The corresponding dissipation in the air film is strongly localized around the kink region near the rim of the air film. Because we can only partially observe this region (due to experimental resolution), we can only make a conservative estimate which attributes several 10–100 % of the excess energy loss during each ‘quasi-contact’ phase to air film lubrication. In particular, in the hover stage (when the shape oscillations show negligible internal dissipation) we indeed observe an almost 100 % dissipation in the air film. Moreover, only 20 % of the total energy loss is dissipated during the flight phases, again indicating a significant contribution of air film dissipation to the overall bouncing dynamics.
Acknowledgements
We thank HIPRINS for supporting this work. The project is co-sponsored by the Dutch Ministry of Economic Affairs, Agriculture and Innovation, the provinces Overijssel, Limburg, and Noord-Brabant, and city region Eindhoven (SRE).
Appendix A
This appendix describes the expressions for the potential and kinetic energy and the dissipation in the internal flow field within the drop, in terms of the shape mode decomposition.
A.1. Determination of internal potential energy
The internal potential energy is given by the surface energy of the deformed droplet interface. When deforming the droplet interface with respect to its spherical equilibrium shape, surface tension tends to contract the interface, thus acting as a liquid spring. In spherical coordinates this internal energy
 $U_{int}={\it\sigma}A_{surf}$
is given by
 $$\begin{eqnarray}U_{int}=2{\rm\pi}{\it\sigma}\int _{0}^{{\rm\pi}}R\,\sin {\it\theta}\sqrt{R^{2}+(\partial _{{\it\theta}}R)^{2}}\,\text{d}{\it\theta},\end{eqnarray}$$
where
 $R({\it\theta})$
is the angle-dependent radius of the droplet. In the limit of small deformations this expression reduces to
 $U_{int}\simeq 2{\rm\pi}{\it\sigma}\int _{-1}^{1}\{R^{2}+((\partial _{{\it\theta}}R)^{2})/2\}\,\text{d}x$
, where
 $x=\cos {\it\theta}$
. The potential energy can now be expressed in terms of the spherical interface decomposition
 $R(t,{\it\theta})=R_{0}+\sum _{n=0}^{\infty }c_{n}(t)P_{n}(x)$
obtained from analysing the side view recordings. The energy for each mode
 $n=2\dots \infty$
can be calculated separately and then linearly superposed, because the modes are independent for small amplitudes. Thus, the summation sign is temporarily dropped for convenience: we describe a single mode
 $n$
imposed on the undisturbed droplet, i.e.
 $R=(R_{0}+c_{0})+c_{n}P_{n}(x)$
with a correction
 $c_{0}$
to account for volume conservation. The surface area integral is evaluated using the orthogonality of the Legendre polynomials:
 $$\begin{eqnarray}U_{int}=2{\rm\pi}{\it\sigma}\left(2(R_{0}+c_{0})^{2}+c_{n}^{2}\frac{n(n+1)+2}{2n+1}\right).\end{eqnarray}$$
To find the potential energy apart from a constant
 $4{\rm\pi}{\it\sigma}R_{0}^{2}$
for the equilibrium spherical shape, we need to take into account that
 $c_{0}\neq 0$
. To calculate the correction we start from volume conservation:
 $$\begin{eqnarray}V=\frac{4}{3}{\rm\pi}R_{0}^{3}=2{\rm\pi}\int _{0}^{{\rm\pi}}\int _{0}^{R({\it\theta})}r^{2}\sin {\it\theta}\,\text{d}r\,\text{d}{\it\theta}=\frac{2}{3}{\rm\pi}\int _{-1}^{1}R^{3}\,\text{d}x.\end{eqnarray}$$
Substituting
 $R^{3}=((R_{0}+c_{0})+c_{n}P_{n})^{3}$
up to second order, and exploiting the properties of the Legendre polynomials, we obtain
 $$\begin{eqnarray}V=\frac{4}{3}{\rm\pi}\left[(R_{0}+c_{0})^{3}+\frac{3(R_{0}+c_{0})c_{n}^{2}}{2n+1}\right].\end{eqnarray}$$
Defining
 $(R_{0}+c_{0})/R_{0}=1+{\it\delta}$
and dividing by
 $(4/3){\rm\pi}R_{0}^{3}$
last equation can be rewritten as
 $$\begin{eqnarray}1=(1+{\it\delta})^{3}+3(1+{\it\delta})\frac{(c_{n}/R_{0})^{2}}{2n+1}.\end{eqnarray}$$
Evaluating this expression for small
 ${\it\delta}$
and
 $c_{n}$
(up to second order), we obtain
 $$\begin{eqnarray}{\it\delta}\simeq -\frac{(c_{n}/R_{0})^{2}}{2n+1},\end{eqnarray}$$
which yields the final expression for
 $(R_{0}+c_{0})$
,
 $$\begin{eqnarray}(R_{0}+c_{0})^{2}=\left(R_{0}-\frac{c_{n}^{2}}{R_{0}(2n+1)}\right)^{2}\simeq R_{0}^{2}-2\frac{c_{n}^{2}}{2n+1},\end{eqnarray}$$
which is accurate up to second order and can be substituted back into the expression for the potential energy, (A 2). This yields, apart from the constant contribution,
 $$\begin{eqnarray}U_{int}=2{\rm\pi}{\it\sigma}\frac{(n-1)(n+2)}{2n+1}c_{n}^{2}.\end{eqnarray}$$
To calculate the total potential energy to second-order accuracy of
 $c_{0}$
, we sum (A 8) over the individual modes.
A.2. Determination of internal kinetic energy
Given the velocity potential, (3.8), we calculate the kinetic energy:
 $$\begin{eqnarray}K_{int}=\frac{1}{2}{\it\rho}\int {\it\phi}(\boldsymbol{n}\boldsymbol{\cdot }\boldsymbol{{\rm\nabla}}{\it\phi})\,\text{d}A.\end{eqnarray}$$
In the small deformation limit the surface integral can simply be evaluated over a sphere with mean radius
 $R_{0}$
, allowing us to substitute the normal vector
 $\boldsymbol{n}$
by the radial unit vector
 $\hat{\boldsymbol{e}}_{r}$
; the expression then reads
 $$\begin{eqnarray}K_{int}={\rm\pi}{\it\rho}R_{0}^{2}\int _{0}^{{\rm\pi}}({\it\varphi}\partial _{r}{\it\varphi})|_{R_{0}}\sin {\it\theta}\,\text{d}{\it\theta}.\end{eqnarray}$$
The latter expression can be evaluated for each individual mode describing the velocity field. We substitute the radial velocity
 $\partial _{r}{\it\varphi}=A_{n}nr^{n-1}P_{n}(x)$
at the boundary
 $r=R_{0}$
, and use the properties of the Legendre polynomials:
 $$\begin{eqnarray}K_{int}={\rm\pi}{\it\rho}{R_{0}}^{2}\int _{-1}^{1}nA_{n}^{2}R_{0}^{2n-1}{P_{n}}^{2}(x)\,\text{d}x=2{\rm\pi}{\it\rho}{R_{0}}^{2n+1}A_{n}^{2}\frac{n}{2n+1}.\end{eqnarray}$$
Given the relation between
 $c_{n}$
and
 $A_{n}$
in the limit of small deformation (3.9),
 ${\dot{c}}_{n}=nA_{n}R_{0}^{n-1}$
, the final expression for the kinetic energy is
 $$\begin{eqnarray}K_{int}=2{\rm\pi}{\it\rho}R_{0}^{3}\frac{1}{n(2n+1)}{\dot{c}}_{n}^{2},\end{eqnarray}$$
which can again be summed over the individual modes.
A.3. Determination of dissipation in the droplet
The internal dissipation rate is given in terms of the rate of strain tensor
 $\unicode[STIX]{x1D63F}$
by
 ${\dot{W}}_{drop}=\int (2{\it\mu}\unicode[STIX]{x1D63F}:\unicode[STIX]{x1D63F})\,\text{d}V$
where
 $\unicode[STIX]{x1D63F}$
is given by
 $$\begin{eqnarray}\displaystyle \unicode[STIX]{x1D63F} & = & \displaystyle (\partial _{r}u_{r})\hat{\boldsymbol{e}}_{r}\hat{\boldsymbol{e}}_{r}+\left(\frac{1}{r}\partial _{{\it\theta}}u_{{\it\theta}}+\frac{u_{r}}{r}\right)\hat{\boldsymbol{e}}_{{\it\theta}}\hat{\boldsymbol{e}}_{{\it\theta}}+\left(\frac{u_{r}}{r}+\cot {\it\theta}\frac{u_{{\it\theta}}}{r}\right)\hat{\boldsymbol{e}}_{{\it\phi}}\hat{\boldsymbol{e}}_{{\it\phi}}\nonumber\\ \displaystyle & & \displaystyle +\,\frac{1}{2}\left(r\partial _{r}\left(\frac{u_{{\it\theta}}}{r}\right)+\frac{1}{r}\partial _{{\it\theta}}u_{r}\right)(\hat{\boldsymbol{e}}_{r}\hat{\boldsymbol{e}}_{{\it\theta}}+\hat{\boldsymbol{e}}_{{\it\theta}}\hat{\boldsymbol{e}}_{r})\end{eqnarray}$$
in the case of rotational symmetry. Evaluating this expression in terms of the mode decomposition, it can be shown after some tedious calculations that (Moláček & Bush Reference Moláček and Bush2012)
 $$\begin{eqnarray}{\dot{W}}_{drop}=8{\rm\pi}{\it\mu}R_{0}\mathop{\sum }_{n}\frac{n-1}{n}{\dot{c}}_{n}^{2}.\end{eqnarray}$$
Appendix B
This appendix describes the details of the ‘single oscillation mode’ model. The flow field within the drop is given by
 ${\dot{z}}=\dot{{\it\varepsilon}}z$
and
 ${\dot{r}}=-(\dot{{\it\varepsilon}}r)/2$
, where
 $0\leqslant r\leqslant \sqrt{R_{c}^{3}/b}$
,
 $-b\leqslant z\leqslant b$
and
 $\dot{{\it\varepsilon}}={\dot{b}}/b$
. So the internal kinetic energy is given by
 $$\begin{eqnarray}K_{int}=\frac{1}{2}{\it\rho}\int _{0}^{a}\int _{-b}^{b}({\dot{z}}^{2}+{\dot{r}}^{2})\,\text{d}z\,2{\rm\pi}r\,\text{d}r=\frac{1}{2}{\it\rho}V{\dot{b}}^{2}\left(\frac{1}{3}+\frac{1}{8}{\it\beta}^{-3}\right),\end{eqnarray}$$
where
 $=b/R_{c}$
. The internal dissipation can be expressed as
 $$\begin{eqnarray}{\dot{W}}=\int _{0}^{a}\int _{-b}^{b}(-3{\it\mu}\dot{{\it\varepsilon}}^{2})\,\text{d}z\,2{\rm\pi}r\,\text{d}r=-6{\rm\pi}{\it\mu}R_{c}{\dot{b}}^{2}{\it\beta}^{-2}.\end{eqnarray}$$
The internal potential energy is given by the excess surface of the drop,
 $U={\it\sigma}(2{\rm\pi}a^{2}+4{\rm\pi}ab-6{\rm\pi}R_{c}^{2})$
, where
 $a=(R_{c}^{3}/b)^{1/2}$
. Hence we obtain for the total kinetic energy
 $K$
, the total potential energy
 $U$
, and the dissipation rate equations (4.1)–(4.3). Substitution of these equations in the energy expression
 ${\dot{W}}=\partial _{t}(K+U)$
results in the following differential equation:
 $$\begin{eqnarray}\displaystyle -6{\rm\pi}{\it\mu}R_{c}{\dot{b}}^{2}{\it\beta}^{-2}+({\dot{z}}-{\dot{b}})F_{sq} & = & \displaystyle \left(\frac{1}{3}+\frac{1}{8}{\it\beta}^{-3}\right)M\ddot{b}{\dot{b}}+\frac{3M}{16R_{c}}{\it\beta}^{-4}{\dot{b}}^{3}\nonumber\\ \displaystyle & & \displaystyle +\,M\ddot{z}{\dot{z}}+3{\rm\pi}{\it\sigma}R_{c}\frac{2}{3}({\it\beta}^{-\frac{1}{2}}-{\it\beta}^{-2}){\dot{b}}+Mg{\dot{z}}.\end{eqnarray}$$
Because
 $F_{sq}=M(\ddot{z}+g)$
, the terms with
 ${\dot{z}}$
cancel and the equation reduces to
 $$\begin{eqnarray}-6{\rm\pi}{\it\mu}R_{c}{\dot{b}}{\it\beta}^{-2}-F_{sq}=\left(\frac{1}{3}+\frac{1}{8}{\it\beta}^{-3}\right)M\ddot{b}+\frac{3M{\it\beta}^{-4}}{16R_{c}}{\dot{b}}^{2}+3{\rm\pi}{\it\sigma}R_{c}\frac{2}{3}({\it\beta}^{-1/2}-{\it\beta}^{-2}).\end{eqnarray}$$
Neglecting higher-order terms except for the interfacial tension contribution, because otherwise the droplet height becomes negative, this results in (4.7)
 $$\begin{eqnarray}{\it\alpha}M\ddot{b}=-F_{sq}-6{\rm\pi}{\it\mu}R_{c}{\dot{b}}-3{\rm\pi}{\it\sigma}R_{c}{\textstyle \frac{2}{3}}({\it\beta}^{-1/2}-{\it\beta}^{-2}),\end{eqnarray}$$
where for small deviations of
 ${\it\delta}={\it\beta}-1$
we obtain
 $$\begin{eqnarray}{\textstyle \frac{2}{3}}({\it\beta}^{-1/2}-{\it\beta}^{-2})={\textstyle \frac{2}{3}}((1+{\it\delta})^{-1/2}-(1+{\it\delta})^{-2})={\it\delta}-{\textstyle \frac{7}{4}}{\it\delta}^{2}=({\it\beta}-1)+\cdots\end{eqnarray}$$
for the internal potential energy. So for small deviations and no interaction with the substrate,
 $F_{sq}=0$
, (4.7) transforms into the damped harmonic oscillator equation
 $$\begin{eqnarray}\ddot{b}+\frac{6{\rm\pi}{\it\mu}R_{c}}{{\it\alpha}M}{\dot{b}}+\frac{3{\rm\pi}{\it\sigma}}{{\it\alpha}M}(b-R_{c})=0.\end{eqnarray}$$
The resonance frequency is given by
 ${\it\omega}_{0}=(3{\rm\pi}{\it\sigma}/{\it\alpha}M)^{1/2}$
and damping time
 $t={\it\alpha}M/6{\rm\pi}{\it\mu}R_{c}$
. So the quality factor of the resonator is
 $Q=(3{\rm\pi}{\it\sigma}{\it\alpha}M)^{1/2}/6{\rm\pi}{\it\mu}R_{c}$
. In the hovering phase, when the drop is nearly in contact with the substrate,
 $b=z+h$
, where
 $h\ll b$
and almost constant. Hence
 $$\begin{eqnarray}\ddot{b}+\frac{6{\rm\pi}{\it\mu}R_{c}}{{\it\alpha}M}{\dot{b}}+\frac{3{\rm\pi}{\it\sigma}}{{\it\alpha}M}(b-R_{c})=-\frac{M(\ddot{b}+g)}{{\it\alpha}M}.\end{eqnarray}$$
In this case the resonance frequency is given by
 ${\it\omega}_{0}=(3{\rm\pi}{\it\sigma}/(1+{\it\alpha})M)^{1/2}$
and the quality factor by
 $Q=(3{\rm\pi}{\it\sigma}(1+{\it\alpha})M)^{1/2}/6{\rm\pi}{\it\mu}R_{c}$
, indicating that in the hover phase the dissipation is lower.