I. INTRODUCTION
It is well known that the statistical uncertainties of powder diffraction data strongly depend on the crystallite size of powder (Alexander et al., Reference Alexander, Klug and Kummer1948; De Wolff, Reference De Wolff1958; De Wolff et al., Reference De Wolff, Taylor and Parrish1959). The author has demonstrated that the crystallite size effect on diffraction intensities from stationary specimens can quantitatively evaluated by statistical analysis of measured intensities collected on step-wise rotation of the specimen (Ida et al., Reference Ida, Goto and Hibino2009). It has been suggested that the method can be used for crystallite size evaluation, for example, but the method is useless for conventional powder diffraction analysis, because continuous rotation of powder specimen generally reduces uncertainties of measured intensities, and the measurements of stationary specimen would be exceptional, given that a specimen spinner is attached to the measurement system. It should also be noted that it is difficult to establish the theory about rotating specimens, because it depends on the geometry and configuration of optics, the spectroscopic distribution of source X-ray (De Wolff, Reference De Wolff1958), and also the correlation of them.
On the other hand, it has become widely recognized that the use of position-sensitive detectors, one-dimensional (1D) or two-dimensional (2D), is a highly efficient method for data collection in X-ray diffraction measurements. Sulyanov et al. (Reference Sulyanov, Popov and Kheiker1994) have proposed a simple algorithm to reduce the 2D powder diffraction intensity data measured with a flat detector to a series of 1D intensities mapped onto the values of diffraction angles 2θ. The method of Sulyanov et al. is based on calculation of average intensity of the pixels assigned to a certain diffraction angle 2θ. Geometrical corrections are applied to each pixel intensity before calculation of average, as it should be equivalent to the value expected to be measured at the center position of the detector.
It is quite easy to calculate the variance and standard deviation of the corrected pixel intensities as well as the average of them. In this study, the author has slightly modified the method of Sulyanov et al. in order to evaluate the standard deviation σ for the average intensity I. The method has been applied to the diffraction data of fine quartz powder measured with a flat 2D detector on a powder diffraction beam line BL5S2 at Aichi Synchrotron Radiation Center (AichiSR) in Japan. It is demonstrated that the values of σ thus estimated can be treated as if it were statistical errors of powder diffraction intensities I, even if the origin of the deviations might intrinsically be deterministic.
II. DATA REDUCTION
A. Compilation of pixel intensities
A practical procedure of the data reduction by the method of Sulyanov et al. (Reference Sulyanov, Popov and Kheiker1994) can be summarized as follows.
-
(i) Prepare bins for the sum of intensities {S 0, S 1, …, S n−1} and number of pixels {N 0, N 1, …, N n−1} for discrete 2θ values, {2θ 0, 2θ 1, …, 2θ n−1}. It is not mandatory but divisions with constant separation Δ2θ, and 2θ j = 2θ 0 + jΔ2θ for j = 0, 1, …, n − 1, are assumed here. Each bin indexed by the number j then covers the 2θ range expressed by 2θ 0 + (j − 1/2)Δ2θ ≤ 2θ < 2θ 0 + (j + 1/2)Δ2θ.
-
(ii) Apply the following treatments to each of all the valid pixels indexed by (X, Y) (just skip known invalid pixels).
-
(a) Calculate the diffraction angle 2θ XY for the center position of the pixel (see Section II B-1).
-
(b) Correct the pixel intensity I XY by multiplying the factor f(X, Y), as it is expected to be measured at the center position (X = 0, Y = 0) of the flat detector (see Section II B-2).
-
(c) Search the index of the bin j that satisfies 2θ 0 + (j − 1/2)Δ2θ ≤ 2θ < 2θ 0 + (j + 1/2)Δ2θ. In case of constant separation Δ2θ, the index is simply given by
(1)where [x] is the floor function (squared bracket notation by Gauss) that gives largest integer not greater than a real number x. $$j = \displaystyle\left [{{2\theta - 2\theta _0 \; } \over {\Delta2\theta}} + {1\over2}\right],$$
-
(d) Add the corrected pixel intensity to the intensity bin, S j ← S j + I XY f(X, Y) by assignment operation, and simultaneously add unity to the number bin, N j ← N j + 1.
-
-
(iii) Finally, calculate the average intensities I j by division of S j by N j ,
(2)for the bins that satisfy 0 < N j , after all the valid pixels have been processed.
$$I_j = \displaystyle{{S_j} \over {N_j}}, $$


The above algorithm looks much simpler than a method, which is applied by Ingham (Reference Ingham2014), and has many favorable features: (i) all the information available from a 2D detector can be utilized; (ii) invalid (dead) pixels, which are sometimes found in a semiconductor detector, can be treated just by exclusion of the pixels on summation; (iii) even if the detector is not perfectly aligned, the effect of misalignment can numerically be corrected by linear transformation before calculation of 2θ; (iv) arbitrary values of the division Δ2θ can be used, no matter what is the nominal angular resolution determined by the ratio of the pixel size to camera length; (v) even the intensities observed close to the lowest 2θ positions, usually restricted by the head-piece of the direct-beam stopper, can be used, if the pixels in the shade of the supporting rod of the beam-stopper are excluded; and (vi) the resulting diffraction peak profile should be free of axial-divergence effect, because the procedure is virtually equivalent with the average of the diffraction intensities along the Debye and Scherrer (Reference Debye and Scherrer1916) or Hull (Reference Hull1917) rings.
The author would like to emphasize that only slight modification of the method of Sulyanov et al. enables experimental evaluation of the errors of the observed intensities. It is realized just by preparing another series of bins, {V 0, V 1, …, V n−1}, and addition of squared intensities, V j ← V j + [I XY f(X, Y)]2, followed by calculation of standard deviation for the sample average,
 $$\sigma _j = \left[ {\displaystyle{{V_j - N_j I_j^2} \over {N_j (N_j - 1)}}} \right]^{1/2}, $$
for all the bins that satisfy 1 < N j . Statistical independence of the corrected pixel intensities [I XY f(X, Y)] is assumed here.
The author would like to emphasize that the method of error estimation proposed here should be more effective than the method proposed by Yang et al. (Reference Yang, Juháa and Billinge2014), which is based on statistical analysis about multiple frames, because the exposure period for each frame should be shortened for multiple-frame data collection.
The analytical formula to calculate the diffraction angle 2θ XY and the intensity correction factor f(X, Y) for a flat 2D detector used in transmission geometry will be described in the following section.
B. Mapping and intensity correction for a flat 2D detector used in transmission geometry
1. Mapping pixel positions (X, Y) to diffraction angles 2θ
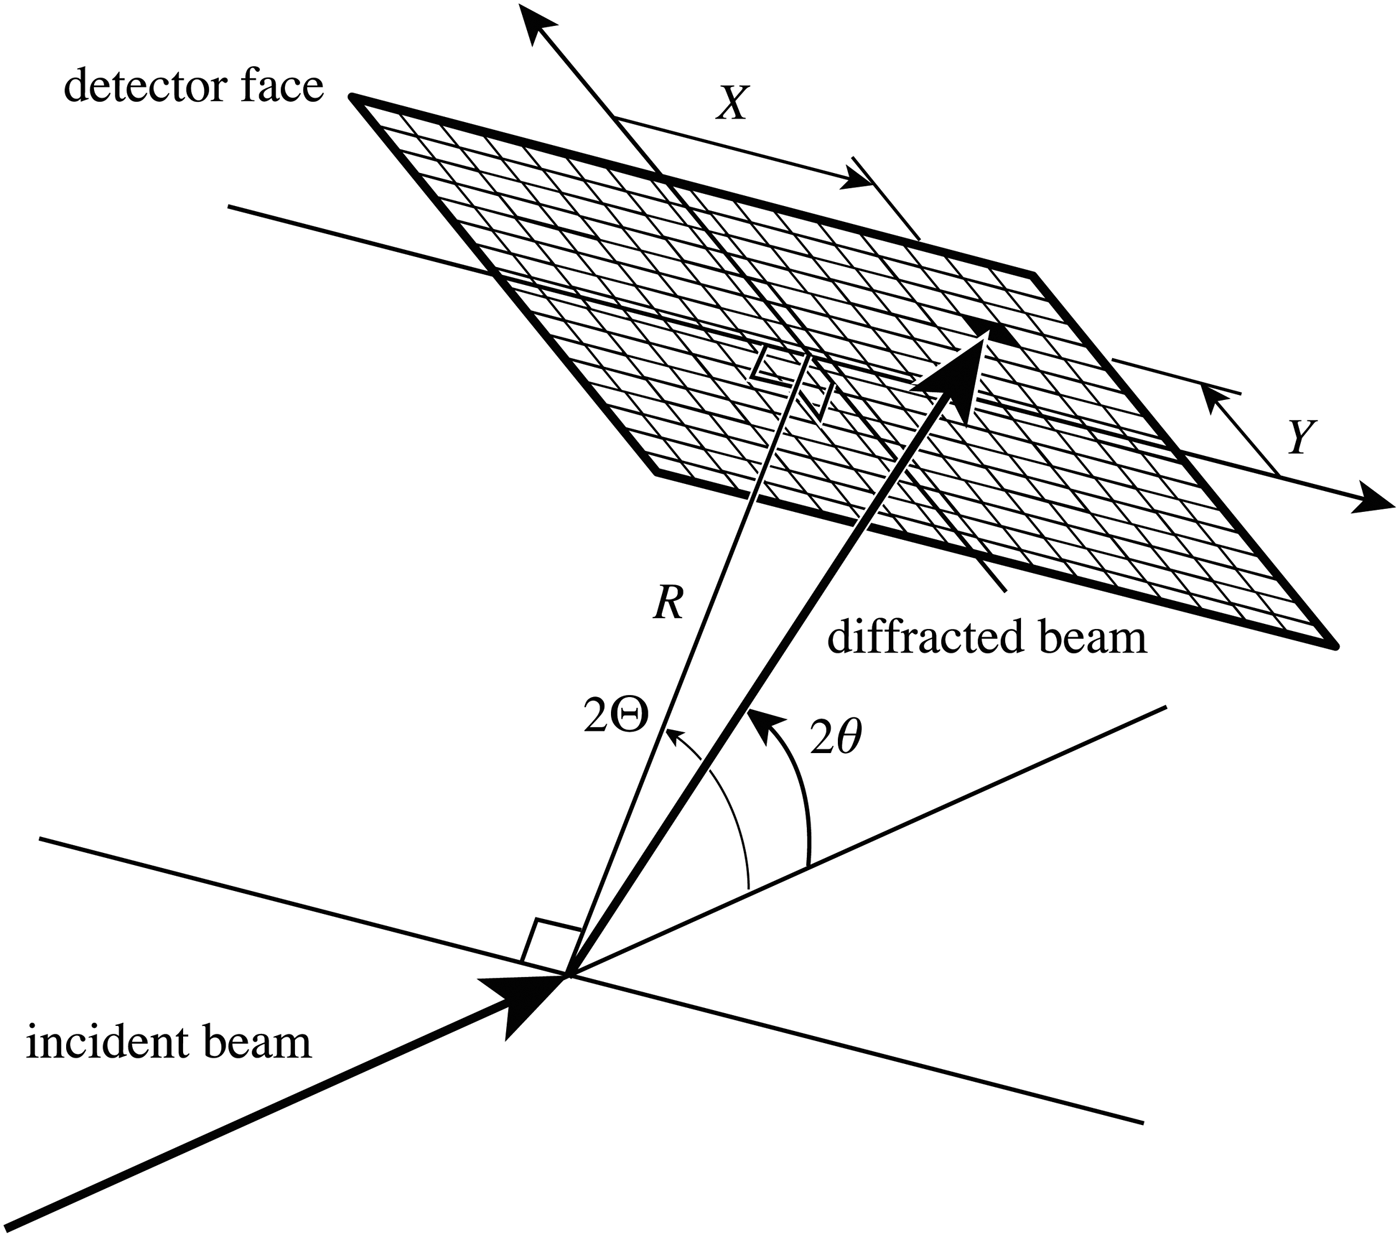
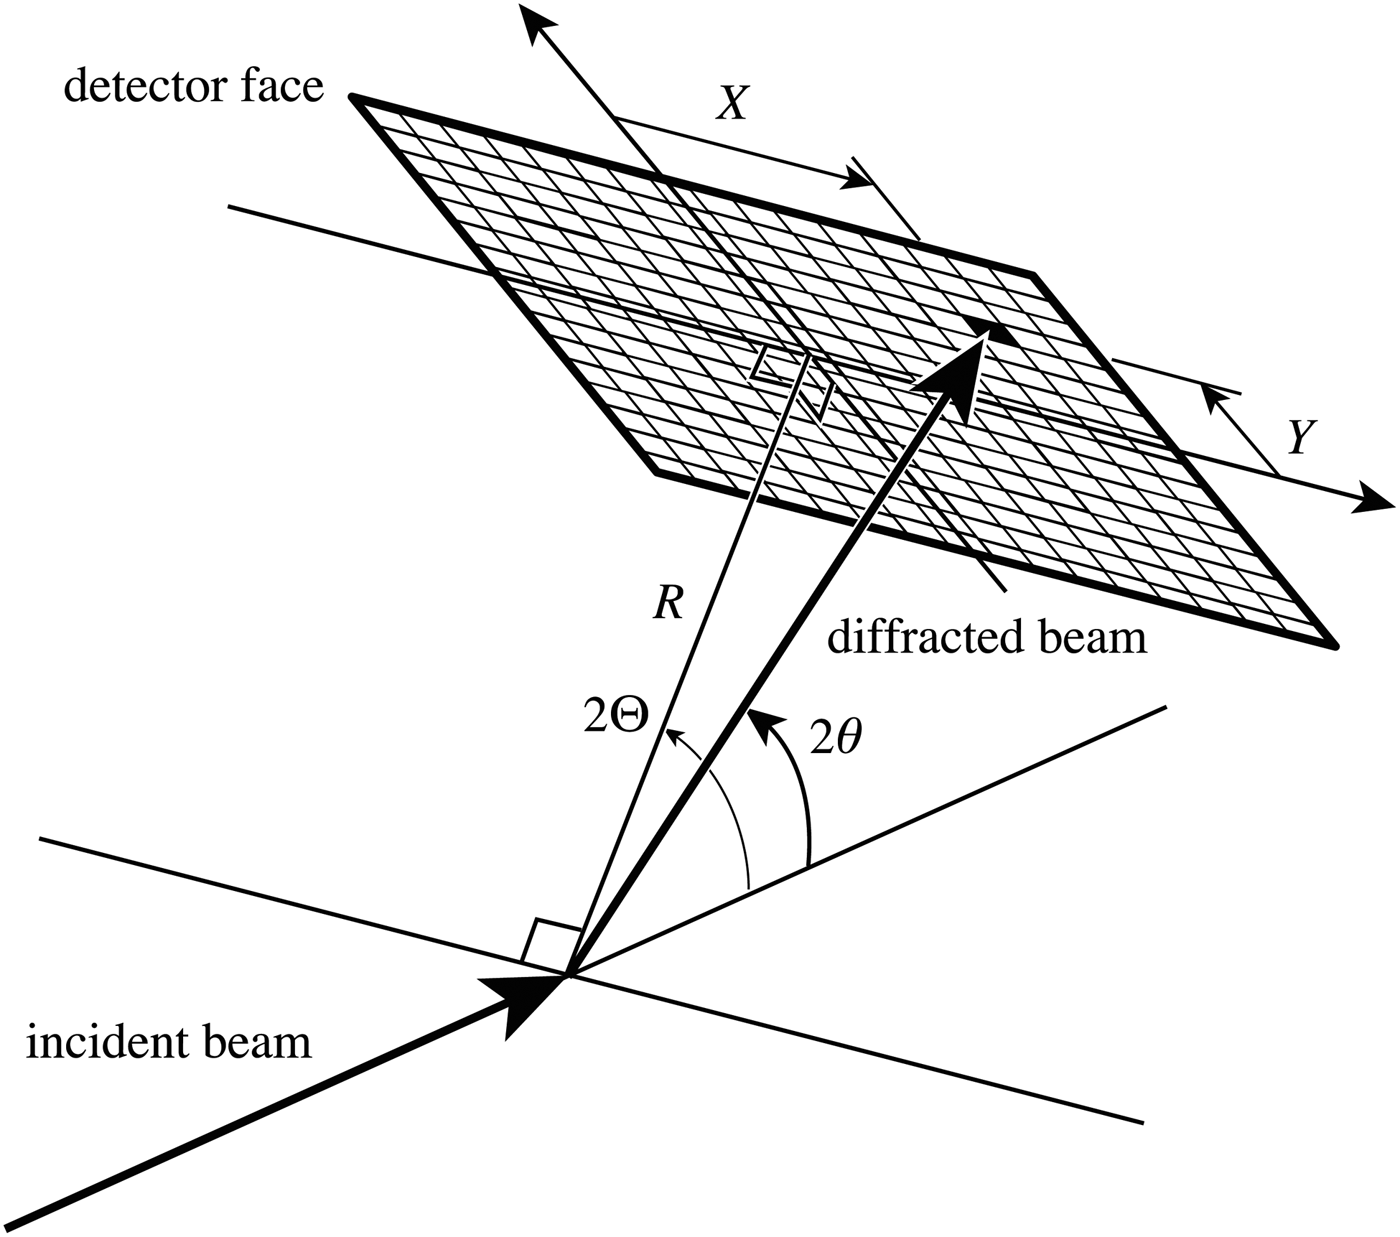
Assume a flat 2D detector is attached to the 2Θ wheel of a goniometer, and the horizontal and vertical positions of the pixels on the detector are given by X and Y, and let the pixel origin (X, Y) = (0, 0) at the center of spot irradiated by the incident beam, when the goniometer angle is positioned at 2Θ = 0°. Note that the goniometer (detector) angle 2Θ and the diffraction angle 2θ are distinguished by capital and lower case letters in this paper. The camera length R is defined as the distance of the center position of the detector at (X, Y) = (0, 0) from the specimen. Figure 1 illustrates the definitions of the camera length R, detector angle 2Θ, diffraction angle 2θ, and irradiated pixel position (X, Y).
Definitions of the camera length R, detector angle 2Θ, diffraction angle 2θ, and irradiated pixel position (X, Y).
The diffraction angle 2θ of the pixel (X, Y) on the detector at the goniometer angle 2Θ is given by
 $$2\theta _{XY} = {\rm arccos}\displaystyle{{R{\rm cos}2{\rm \Theta} - Y{\rm sin}2{\rm \Theta}} \over {\sqrt {R^2 + X^2 + Y^2}}}. $$
2. Corrections of pixel intensity in transmission-mode measurement
The pixel intensity of a flat detector should be treated with (a) non-spherical, (b) oblique-incidence, and (c) polarization corrections. The former two corrections (a) and (b) are combined as “solid angle correction” in the formula proposed by Sulyanov et al. (Reference Sulyanov, Popov and Kheiker1994), but they are separated here, partly because the author prefers to include the effect of difference in extinction (absorption and scattering by air) of the diffracted beam into the non-spherical correction, and the formula of oblique-incidence correction may be modified in future because of the penetration of X-ray into the detector layer of a semiconductor device.
a. Non-spherical correction
The non-spherical correction should be applied to the pixel intensity of a flat detector, because the distance r to a pixel at (X, Y) on the detector from the specimen given by
 $$r = \sqrt {R^2 + X^2 + Y^2}, $$
is generally different from the distance R to the center position (0, 0) of the detector face. If the linear extinction coefficient of air is given by μ a, the intensity to be observed should be proportional to r −2exp( − μ a r), and the non-spherical correction factor f NS (X, Y) should then be given by
 $$\eqalign{f_{{\rm NS}} (X,Y) = & \displaystyle{{r^2} \over {R^2}} {\rm exp[}\mu _{\rm a} (r - R){\rm ]} \cr = & \displaystyle{{R^2 + X^2 + Y^2} \over {R^2}} {\rm exp}\left[ {\mu _{\rm a} \left( {\sqrt {R^2 + X^2 + Y^2} - R} \right)} \right].} $$
b. Oblique-incidence correction
The oblique-incidence correction is connected with the secant of the angle of incidence at the detector face, and the correction factor should be given by
 $$f_{{\rm OI}} (X,Y) = \displaystyle{r \over R} = \displaystyle{{\sqrt {R^2 + X^2 + Y^2}} \over R}.$$
c. Polarization correction for bending-magnet synchrotron X-ray
Linear polarization with horizontal electric-field vector can be assumed for a bending-magnet synchrotron beam, while Kahn et al. (Reference Kahn, Fourme, Gadet, Janin, Dumas and Andre1982) have described more detailed formula, including the vertical component of the electric field for the laboratory X-ray sources. The rotation axis of the goniometer is usually directed in horizontal and perpendicular to the direction of the synchrotron beam, the length of the projection of the polarization vector onto the cross-section of the diffracted beam should be proportional to the cosine of the deviation angle of the diffraction beam from the vertical plane parallel to the incident X-ray beam. As the intensity of the electromagnetic wave is proportional to the squared amplitude of the electric field, the polarization correction factor for the pixel should be given by
 $$f_{\rm P} (X,Y) = \displaystyle{{R^2 + X^2} \over {R^2}}. $$
d. Overall correction factor for bending-magnet synchrotron X-ray
The overall correction factor for a flat 2D detector used with synchrotron X-ray in transmission geometry is given by the product of f NS (X, Y), f OI (X, Y), and f P(X, Y), that is,
 $$\eqalign{& f\,(X,Y) = \displaystyle{{(R^2 + X^2 + Y^2 )^{3/2} (R^2 + X^2 )} \over {R^5}} \cr & \quad {\rm exp}\left[ {\mu _{\rm a} \left( {\sqrt {R^2 + X^2 + Y^2} - R} \right)} \right].} $$
III. EXPERIMENTAL
Fine quartz powder with typical crystallite size between 3 and 7 µm, prepared by pulverization and sedimentation of Brazilian natural quartz was used as the test sample. The powder was filled into a glass capillary tube (Hilgenberg, Mark-tube, no. 14) of 0.5 mm in diameter. The capillary specimen was rotated at the speed of 1 rev min−1 during the diffraction measurement.
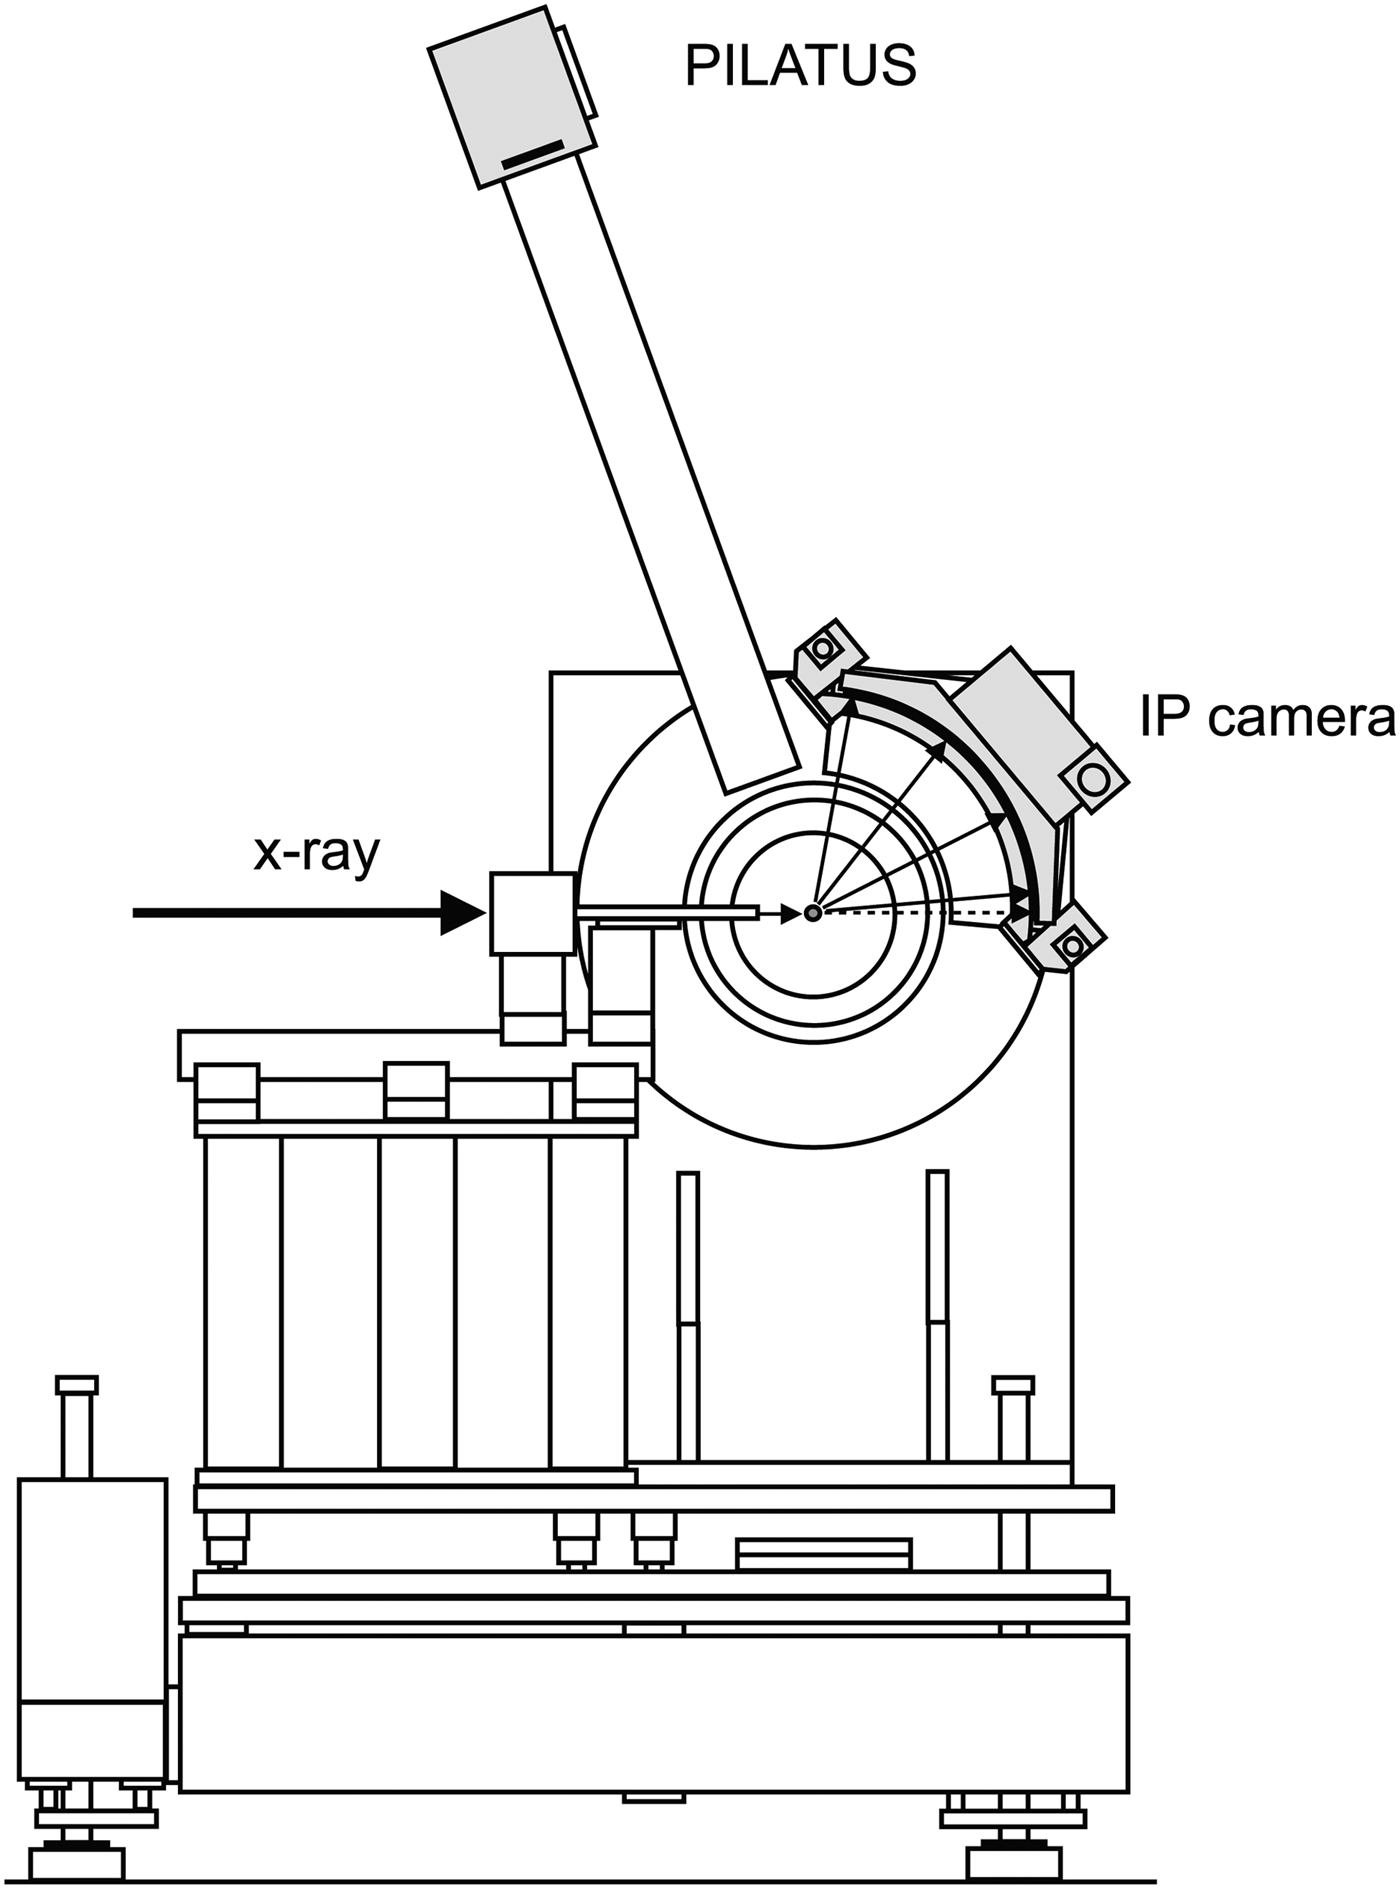
The powder diffraction intensities were recorded with a flat 2D pixel detector (Dectris, PILATUS 100K) attached to the powder diffraction measurement system (Figure 2) on the beam line BL5S2 at AichiSR in Japan, where the hard X-ray beam radiated from a superconducting bending magnet inserted in the storage ring operated in top-up mode at the acceleration voltage of 1.2 GeV is available. The synchrotron beam was collimated and monochromated with a couple of cylindrical mirrors and a Si 111 double-crystal monochromator, and effectively focused to the position close to the detector face. The peak wavelength of the source X-ray was assumed to be 0.9970 Å from the observed peak positions of the quartz sample and the typical value of the lattice constant a = 4.913 Å reported for natural and synthetic quartz in literatures (Brice, Reference Brice1980). The linear extinction coefficient of air is estimated at μ a = 1.9 × 10⁻³ cm−1.
Schematic illustration of the powder diffraction measurement system on the beam line BL5S2 at Aichi Synchrotron Radiation Center (AichiSR). A flat pixel detector PILATUS and a cylindrical Debye–Scherrer camera with Imaging Plate are attached to the 2Θ wheel of the goniometer.

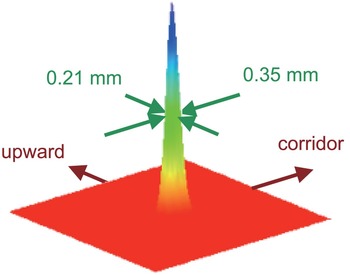
Figure 3 demonstrates the cross-section intensity profile of the attenuated direct X-ray beam recorded on an X-ray film (Fuji Film, Imaging Plate; IP) and digitized with an IP reader (Rigaku, R-AXIS DS3C) with nominal resolution of 0.05 mm. The intensity profile has been well fitted with a 2D Gaussian function, and the full widths at half-maximum along the horizontal and vertical directions were estimated at 0.35 and 0.21 mm, respectively. Taking the smearing of the IP image into account, the intrinsic widths of the source X-ray should be narrower than those values. Similar analysis applied to the direct-beam intensity profile taken with a PILATUS detector yielded 0.23 and 0.17 mm along the horizontal and vertical directions, which suggests that the cross-section intensity profile of the source X-ray is certainly more restricted than the IP image, but it is difficult to quantify it, because the pixel size of the PILATUS detector is 0.172 mm. It should be noted that highly definite image of Debye-Scherrer (Hull) rings can be recorded on this beam line over wide detector area, owing to the focusing of the synchrotron beam onto the detector face.
(Color online) Bird's eye view of the direct-beam intensity profile recorded with the IP camera on BL5S2 beam line at AichiSR.

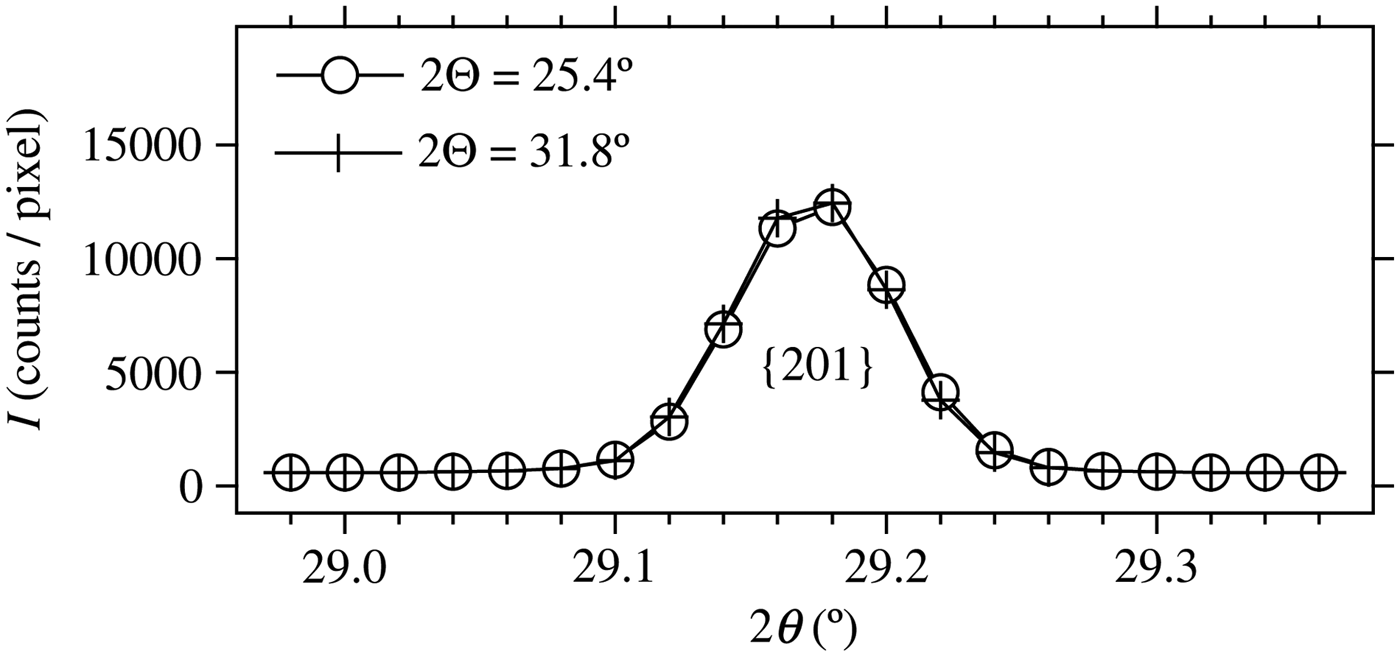
Two sets of diffraction intensity data of quartz powder were collected at the goniometer angles of 2Θ = 25.4° and 31.8°, where {111} and {112}-reflections of quartz are expected to be located near the center of the PILATUS detector, respectively. The camera length was estimated at 284.19 mm by analysis of the recorded diffraction intensity data to match the peak locations of the {201}-reflection commonly observed at both the goniometer angles.
IV. RESULTS
A. Average intensity
Figure 4(a) shows a 2D diffraction intensities from quartz powder recorded with the PIATUS detector positioned at the goniometer angle of 2Θ = 25.4°, where the darkness of each pixel is displayed proportional to the logarithm of the recorded intensity.
(a) Two-dimensional intensity profile (logarithmic contrast) of quartz powder measured at the goniometer angle of 2Θ = 25.4°, where the dead or bad pixels are marked by white dots. (b) The sum of pixel intensities and (c) number of pixels mapped onto the discrete 2θ values with the sampling interval of Δ2θ = 0.02°. (d) Average pixel intensities I, and (e) standard deviations σ calculated from the data recorded at 2Θ = 25.4°.

The locations of dead pixels, which output extraordinary counts, are marked by white dots in Figure 4(a). Most of the dead pixels of the PILATUS detector had been indexed on delivery from the manufacturer (Dectris), but some additional dead pixels were found in the recorded data, which were probably induced by mechanical shock on transport, assembling or handling after the delivery.
Sum of the corrected pixel intensities S and number of pixels N mapped to the discrete 2θ values at the interval of Δ2θ = 0.02° are shown in Figures 4(b) and 4(c), respectively. The number of pixels sampled with the interval of Δ2θ = 0.02°, shown in Figure 4(c), vary around 280 in the region 23.6° < 2θ < 28.8°, which is consistent with the pixel resolution of about 0.035° and the total number of pixels 487 along the horizontal direction of the PILATUS 100K detector.
The average intensity I and the standard deviation σ about the calculated average intensities are plotted in Figures 4(d) and 4(e).
Figures 5(a)–5(c) are magnified plots of S, N, and I, demonstrating the effect of the averaging process, the corresponding areas of which are marked as thin rectangles in Figures 4(b)–4(d), respectively. The integrated intensities S in Figure 5(a) and the numbers of pixels N in Figure 5(b) are similarly corrugated because of the mismatch between the nominal angular pixel resolution of 0.035° and the sampling interval of 0.02° on the analysis, and the averaged pixel intensities I in Figure 5(c) certainly show smooth profile as expected.
Magnified profile of (a) the total intensities, (b) number of pixels for each 2θ bin, and (c) averaged pixel intensities from the data recorded at 2Θ = 25.4°.

B. Standard deviation of averaged intensity
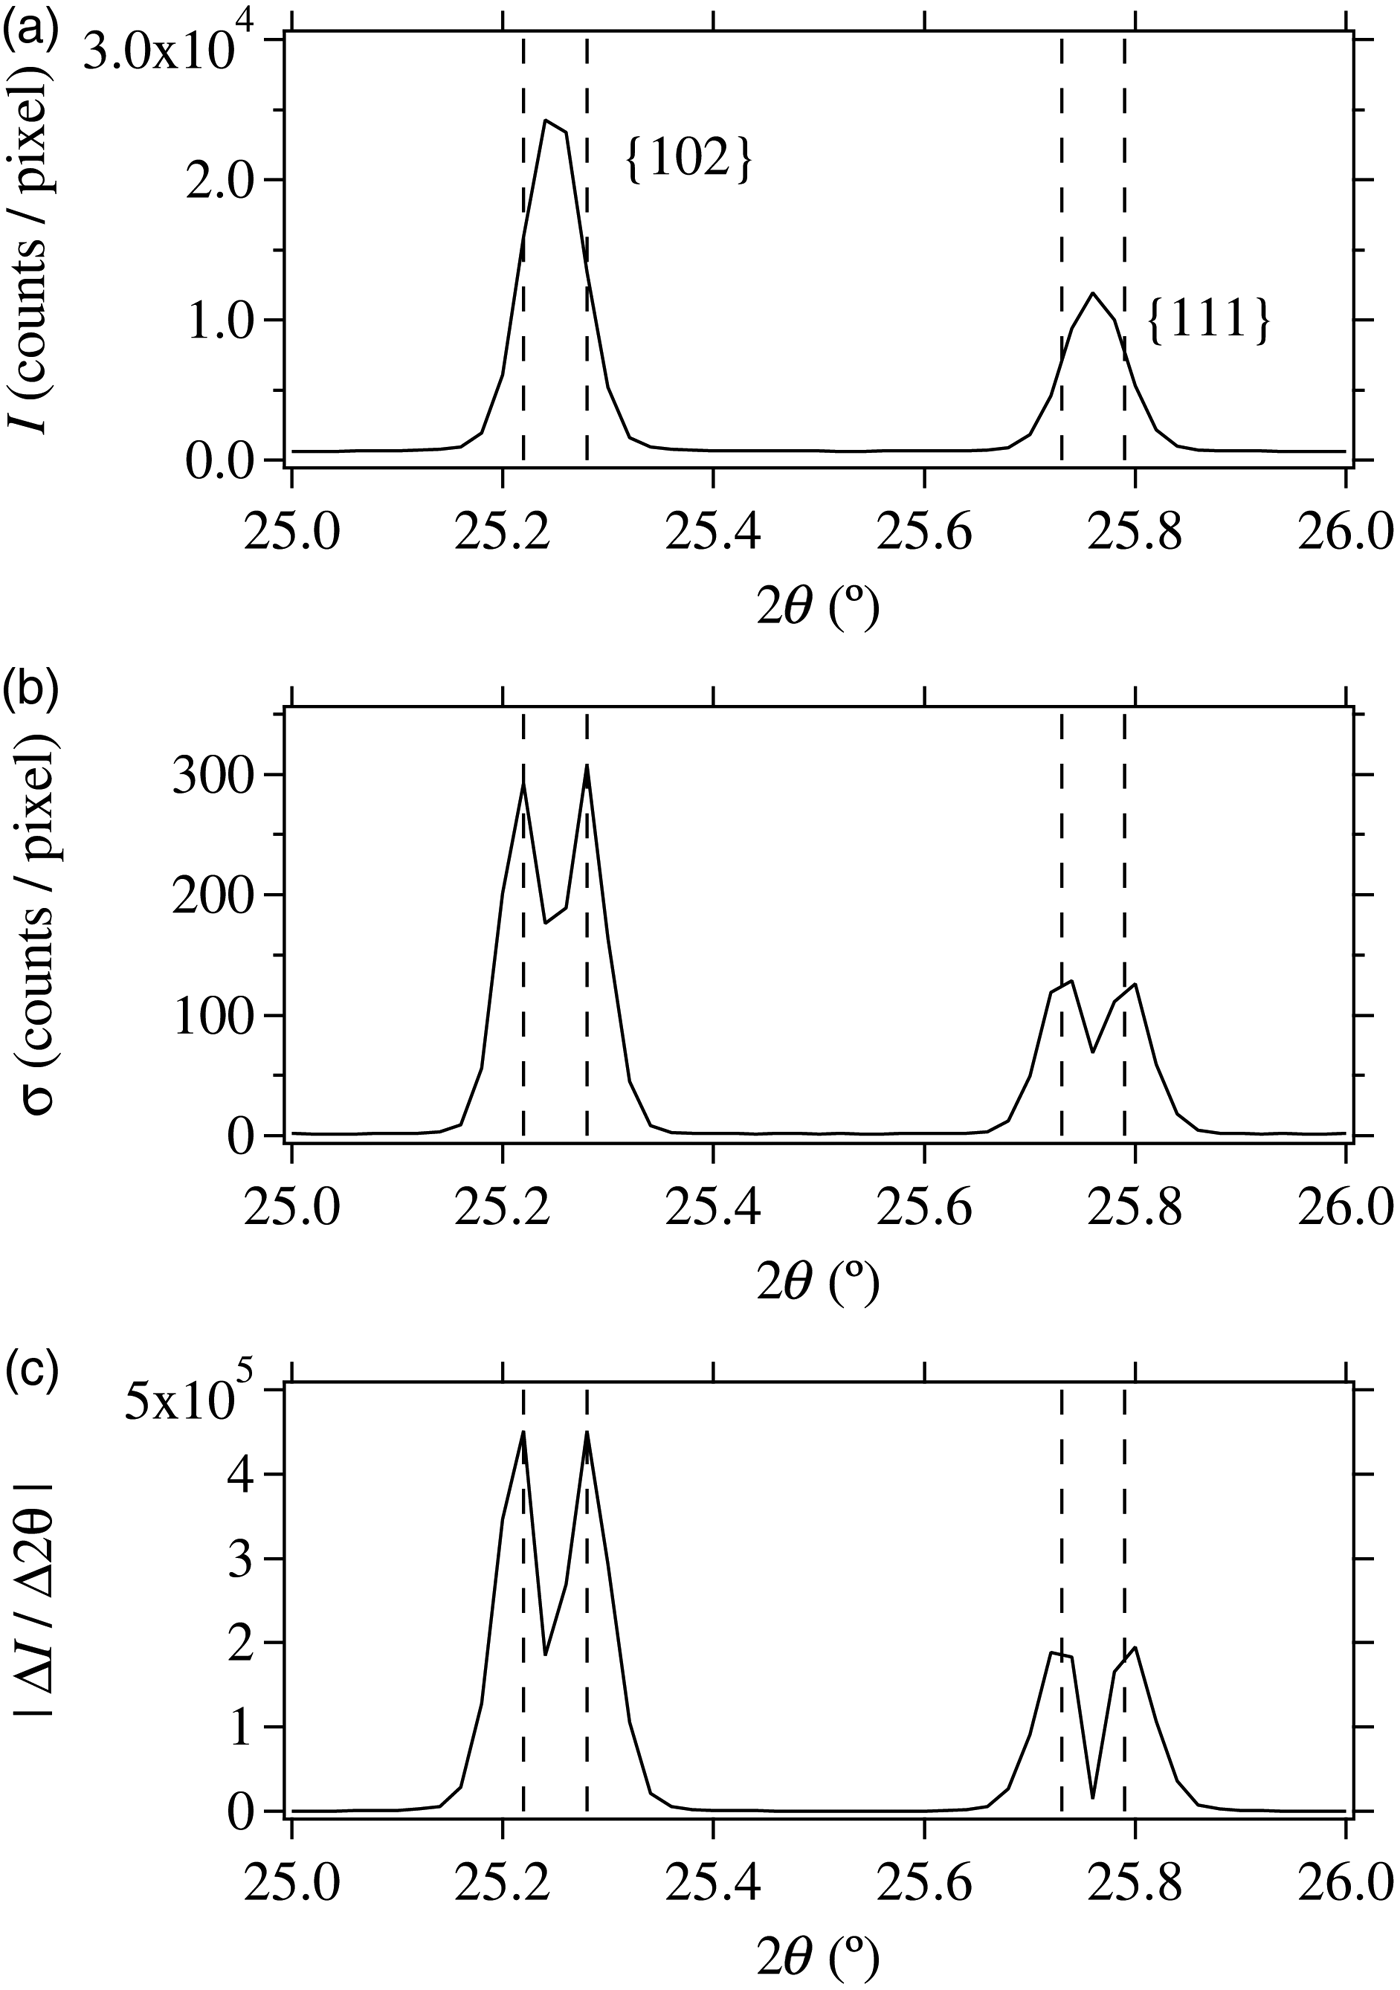
Figures 6(a) and 6(b) display the detailed profile of the average intensities I and the standard deviations σ about the quartz {102} and {111}-reflections, the corresponding areas of which are shown as thin broken rectangles in Figures 4(c) and 4(d), respectively. Figure 6(c) shows the absolute values of numerical differentials of I by 2θ, |ΔI / Δ2θ|. The locations of the peak tops of the double-peak σ profile are marked by vertical broken lines in Figures 6(a)–6(c). The similarity between the σ profile and the |ΔI / Δ2θ| profile suggests that the statistical variation of the average intensity I mainly comes from the propagation of the errors in 2θ. The ratio of σ to |ΔI / Δ2θ|, which can be related to the horizontal error, is found to be about 0.0007° at the peak positions of σ and |ΔI / Δ2θ| profiles. This value is close to the standard deviation expected for the pixel resolution of 0.035° and number of pixels about 280 on averaging, which is estimated at 0.0006° as follows:
 $$\displaystyle{1 \over {\sqrt {280}}} \mathop \int \limits_{ - 0.035^{\circ} /2}^{0.035^{\circ} /2} \displaystyle{{x^2 {\rm d}x} \over {0.035^{\circ}}} \approx 0.0006^{\circ}. $$
Profile of (a) average pixel intensities and (b) standard deviation for quartz {102} and {111} reflections from the data recorded at the goniometer angle of 2Θ = 25.4°. (c) The absolute values of the numerical differential, |ΔI/Δ2θ|, calculated from the data shown in (a).

It has already been suggested by the author (Ida, Reference Ida2013) that the effect of the errors in 2θ on the observed diffraction intensities is comparable with that of particle statistics in case of ordinary laboratory X-ray powder diffraction measurements. Since it is expected that the effect of particle statistics of the fine quartz crystallites is not strong, and effectively reduced by continuous rotation of the capillary specimen during the exposure (Ida, Reference Ida2011), it is likely that the propagation of the errors in 2θ is dominant as the origin of the estimated uncertainty about the average diffraction intensity on this analysis. At the same time, finite values estimated in the σ-profile close to the positions of |ΔI/Δ2θ| = 0 may be assigned to the effect of particle statistics, though the angular resolution and sampling interval in this analysis is not sufficiently fine to validate it.
C. Connection of segmented intensity data
Figures 7(a)–7(c) show the 2D diffraction image, 1D diffraction intensity, and error data on diffraction angle 2θ of the quartz powder collected with the PILATUS detector at the goniometer angle of 2Θ = 31.8°.
(a) Two-dimensional intensity profile (logarithmic contrast) of quartz powder recorded at the goniometer angle of 2Θ = 31.8°. (b) Average pixel intensities I and (c) standard deviations σ calculated from the data shown in Figure 7(a).

The profiles of quartz {201}-reflection, commonly recorded at the two goniometer angles 2Θ = 25.4° and 31.8° are compared in Figure 8. Note that the meridian part of the {201}-ring is lost in the data recorded at 2Θ = 25.4° [see Figure 4(a)], while the {201}-data recorded at 2Θ = 31.8° only include the meridian part [see Figure 5(a)]. The good coincidence of the two intensity profiles supports that the intensity corrections applied to the flat 2D detector is appropriate.
Quartz {201}-reflection peak profile measured at the goniometer angles of 2Θ = 25.4° and 31.8°. The estimated intensity values are marked by white circles and crosses for 2Θ = 25.4° and 31.8°, respectively.

The combined average and standard errors of the intensities, {I, σ}, in the overlapping region can be calculated from the two data sets, {I 1, σ 1} and {I 2, σ 2}, measured at different detector positions, by the following equations:
 $$I = \displaystyle{{I_1 /\sigma _1^2 + I_2 /\sigma _2^2} \over {1/\sigma _1^2 + 1/\sigma _2^2}}, $$
 $$\sigma = \displaystyle{1 \over {\sqrt {1/\sigma _1^2 + 1/\sigma _2^2}}}, $$
D. Application of Rietveld refinement to the connected intensity data
Provided that the experimental errors {σ j } for the powder diffraction intensities {I j } are known, the Rietveld refinement to minimize the sum of the weighted squares of deviations:
 $$S = \mathop \sum \limits_{\,j = 0}^{n - 1} \displaystyle{1 \over {\sigma _j^2}} \left[ {I_j - f\left( {2\theta _j ;\;x_1, x_2, {\rm \ldots}} \right)} \right]^2, $$
where f(2θ j ; x 1, x 2, …) is the overall profile model function with variable parameters x 1, x 2,…, can be considered to be a kind of maximum-likelihood estimation (Ida and Izumi, Reference Ida and Izumi2011, Reference Ida and Izumi2013), and the errors of the optimized parameters {x i } are automatically estimated through the propagation of experimental errors in most of Rietveld refinement codes.
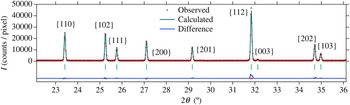
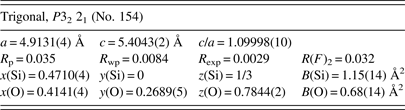
The results of Rietveld refinement applied to the connected diffraction intensity data of quartz powder are shown in Figure 9 and Table I. The RIETAN-FP code (Izumi and Momma, Reference Izumi and Momma2007) was used for the optimization. Space group P3221 (No. 154) was assumed, and the initial structure parameters were taken from literature values (PDF No. 04-012-0490). Symmetric pseudo-Voigt function with the formula of Caglioti et al. (Reference Caglioti, Paoletti and Ricci1958) for line broadening was applied as the peak profile model. No corrections for preferred orientation and absorption were applied. Twelve-term polynomial of diffraction angle was used as the background function.
(Color online) Result of the Rietveld refinement for the combined intensities from two data sets measured at the goniometer angles of 2Θ = 25.4° and 31.8°.

Results of Rietveld refinement.

The optimized constant peak shift parameter has been estimated at −0.0020(14)°, the estimated error of which is slightly larger than the values discussed in Section IV B. It is likely that additional errors are induced by defects of the mechanism and/or control of the measurement system.
The small value of R wp = 0.84% may partly be caused by low angular resolution of 0.035° and the restricted 2θ range from 22.14° to 36.12° on this analysis.
It is expected that no need for application of asymmetric profile function or shift correction confirms the reliability of the evaluation of the peak locations and hence optimized lattice parameters.
The effect of Poisson's statistics about the observed photon counts is negligible in this measurement, because the total counts of X-ray photons for the strongest peak exceed 1.3 × 10⁷, where the average value 46 800 counts pixel−1 located at 2θ = 31.84° comes from 286 pixels of the 2D detector.
The estimated uncertainties about the lattice constants shown in the parentheses, a = 4.9131(4) Å and c = 5.4043(2) Å, look quite reasonable for this measurement, while questionably many significant digits about lattice constants have frequently been reported in literatures, which are likely to be caused by the ignorance of possible errors in 2θ.
Appropriate estimation of errors may be achieved even from the data measured with a zero or 1D detector by more comprehensive application of the maximum-likelihood estimation (Ida, Reference Ida2013), but the analytical method proposed in this article seems to be more straightforward and easier.
V. CONCLUSION
The method of Sulyanov et al. (Reference Sulyanov, Popov and Kheiker1994) to obtain powder diffraction intensity data from a flat 2D detector has slightly been modified to enable experimental estimation of errors in diffraction intensity data. Extraordinary values counted with dead pixels have easily been excluded on analysis. Calculated 1D diffraction peak profiles have satisfactorily been reproduced with a symmetric profile function, and systematic peak shift has not been detected within the experimental errors, which mean that this method can provide aberration-free diffraction data. The profile and magnitude of the estimated errors have shown that the propagation of the errors in the diffraction angle 2θ is dominant in the uncertainties of the measured intensities. The errors of the parameters optimized by the Rietveld method, lattice constants for example, have appropriately been evaluated just by the least-squares method weighted by the reciprocal of the squared experimental errors.