INTRODUCTION
Uganda is a landlocked East African country, with an estimated populace of some 30 million, the majority of whom live in rural environments with a large proportion (70%) having limited or no access to adequate sanitation (WHO, 2008). Such conditions often foster the transmission of helminthic diseases and throughout the country there are also aquatic habitats that harbour freshwater snails of the genera Biomphalaria and Bulinus (Stensgaard et al. Reference Stensgaard, Jorgensen, Kabatereine, Rahbek and Kristensen2006). These snails are of particular importance as intermediate hosts of schistosomes which cause schistosomiasis in man and livestock. The aquatic landscape of Uganda is dominated by two major features, Lake Victoria, the largest lake in Africa, and Lake Albert; their surface areas are 68 800 km2 and 5300 km2, respectively. In contrast to the rather uniform, linear shoreline of Lake Albert, that of Lake Victoria is both intricate and expansive owing to the numerous islands and islets found there. The lakes are physically connected by the Victoria Nile which flows northwards from its source at Jinja, broadening into the marshy lakes of Kyoga and Kwania, before joining Lake Albert at its northern end, then exiting to become the Albert Nile (see Fig. 1).
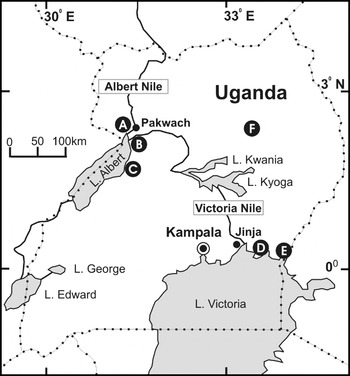
Outline map of Uganda showing major lakes. The dominant aquatic feature is Lake Victoria, which possesses over 3000 islands and islets (not shown), and gives rise to the Victoria Nile. Lakes Edward (and George) are linked to Lake Albert by the Semuliki River which flows northwards, entering Albert at its southern end. Locations of the selected areas (A–E) from which the 9 primary schools (PS) were sampled are indicated: A – (1) Panyimur PS, Nebbi district; B – (2) Walukuba PS, (3) Waaki (Butiaba) PS, Buliisa district; C – (4) Runga PS, (5) Tonya PS, Hoima district; D – (6) Bwondha PS, (7) Bugoto PS, (8) Musubi PS, Mayuge district and E – (9) Buloosi PS, Busia district. An additional school from the central region of Uganda, Aloi PS, is found in Lira district indicated by F.

Just over one hundred years ago, intestinal schistosomiasis was first recorded in Uganda and today infections with Schistosoma mansoni are particularly common within communities that live in close proximity to the lacustrine and riverine environments of the Victoria and Albert Nile (Odongo-Aginya et al. Reference Odongo-Aginya, Grigull, Schweigmann, Loroni-Lakwo, Enrich, Gryseels and Doehring2002). Whilst urinary schistosomiasis is also present in Uganda, it remains restricted to an area just north of Lake Kwania, likely tracking the geographical distribution of its permissive Bulinus host (Kabatereine et al. Reference Kabatereine, Brooker, Tukahebwa, Kazibwe and Onapa2004). Owing to its extensive distribution and disease burden, intestinal schistosomiasis is considered a major public health problem (Dunne et al. Reference Dunne, Vennervald, Booth, Joseph, Fitzsimmons, Cahen, Sturrock, Ouma, Mwatha, Kimani, Kariuki, Kazibwe, Tukahebwa and Kabatereine2006; Kabatereine et al. Reference Kabatereine, Tukahebwa, Kazibwe, Namwangye, Zaramba, Brooker, Stothard, Kamenka, Whawell, Webster and Fenwick2006) and from surveys conducted before 2003, the disease was known from 38 of 56 Ugandan districts, being absent in those too dry or too cold to sustain natural transmission (Kabatereine et al. Reference Kabatereine, Brooker, Tukahebwa, Kazibwe and Onapa2004). These boundaries are being revised, however, as intestinal schistosomiasis has been found at unusually cooler, higher altitudes in south-western Uganda (John et al. Reference John, Ezekiel, Philbert and Andrew2008). Nationally, up to 4 million people are infected, with an estimated 16·7 million at risk (Kabatereine et al. Reference Kabatereine, Brooker, Tukahebwa, Kazibwe and Onapa2004).
To counter the detrimental impact of the disease, a national control programme (NCP) was launched in 2003 with primary focus upon regular de-worming with annual mass distribution of praziquantel (PZQ), and albendazole (ALB), to school-aged children and communities living within high-risk environments (Kabatereine et al. Reference Kabatereine, Tukahebwa, Kazibwe, Namwangye, Zaramba, Brooker, Stothard, Kamenka, Whawell, Webster and Fenwick2006). Receiving support from the Schistosomiasis Control Initiative (SCI), over 20 million PZQ/ALB treatments have been administered during four rounds of annual treatment, and during this period there has been an active monitoring and evaluation programme assessing the impact of anthelminthics (Kabatereine et al. Reference Kabatereine, Brooker, Koukounari, Kazibwe, Tukahebwa, Fleming, Zhang, Webster, Stothard and Fenwick2007). A striking feature of the disease in Uganda is that the relationship between host infection status and morbidity is not always clear (Balen et al. Reference Balen, Stothard, Kabatereine, Tukahebwa, Kazibwe, Whawell, Webster, Utzinger and Fenwick2006; de Moira et al. Reference de Moira, Fulford, Kabatereine, Kazibwe, Ouma, Dunne and Booth2007). For instance, Balen et al. (Reference Balen, Stothard, Kabatereine, Tukahebwa, Kazibwe, Whawell, Webster, Utzinger and Fenwick2006) showed that the classic sign of infection, the swollen abdomen typical of hepatosplenomegaly, has a peculiar heterogeneous geographical occurrence and some children (~2·5%) had remarkably advanced morbidity for their age. The latter observation is thought resultant from infections of a much longer duration than commonly assumed, for infants and pre-school children have now been shown to have egg-patent schistosomiasis (Odogwu et al. Reference Odogwu, Ramamurthy, Kabatereine, Kazibwe, Tukahebwa, Webster, Fenwick and Stothard2006; Stothard and Gabrielli, Reference Stothard and Gabrielli2007a, Reference Stothard and Gabriellib), although it remains to be determined how uniform S. mansoni is throughout its endemic range.
Across this disease landscape, the potential and (or) actual intermediate hosts of S. mansoni do differ. For example, in Lake Victoria Biomphalaria sudanica and B. choanomphala occur while in Lake Albert B. sudanica and B. stanleyi are present (Brown, Reference Brown1994). A fourth species, B. peifferi, has also been reported but has a poorly known distribution owing to difficulties in morphological identification of natural populations (Brown, Reference Brown1994). A recent molecular appraisal has cast doubt even on these specific-distinctions and at a local level has revealed a more complex underlying taxonomy and distribution(s) (Jorgensen, Kristensen and Stothard, Reference Jorgensen, Kristensen and Stothard2007; Plam et al. Reference Plam, Jorgensen, Kristensen and Madsen2008), confirming that the exact snail-S. mansoni relationship, as well as their relative roles in natural transmission cycles, need clarification(s). In so doing, better characterization of populations of S. mansoni is needed as preliminary molecular evidence reveals, rather surprisingly, considerable intra-specific diversity (Morgan et al. Reference Morgan, Dejong, Snyder, Mkoji and Loker2001, Reference Morgan, Dejong, Adeoye, Ansa, Barbosa, Bremond, Cesari, Charbonnel, Correa, Coulibaly, D'Andrea, De Souza, Doenhoff, File, Idris, Incani, Jarne, Karanja, Kazibwe, Kpikpi, Lwambo, Mabaye, Magalhaes, Makundi, Mone, Mouahid, Muchemi, Mungai, Sene, Southgate, Tchuente, Theron, Yousif, Magalhaes, Mkoji and Loker2005).
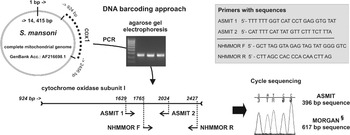
More broadly, in recent years there has been a growing impetus to explore and record the genetic diversity of parasitic species, and hosts thereof, using DNA barcoding approaches (Besansky, Severson and Ferdig, Reference Besansky, Severson and Ferdig2003; Frezal and Leblois, Reference Frezal and Leblois2008). As typified in a recent study of Bulinus by Kane et al. (Reference Kane, Stothard, Emery and Rollinson2008), an outline of the DNA barcoding approach is shown in Fig. 2, whereby sequence variation in the mitochondrial cytochrome oxidase sub-unit I (cox1) gene is compared between sampled specimens to identify evolutionary differences, as well as, similarities. Such studies have benefited from knowledge of the complete mitochondrial genome of S. mansoni, as well as other schistosomes (Le et al. Reference Le, Blair, Agatsuma, Humair, Campbell, Iwagami, Littlewood, Peacock, Johnston, Bartley, Rollinson, Herniou, Zarlenga and McManus2000; Zarowlecki, Huyse and Littlewood, Reference Zarowlecki, Huyse and Littlewood2007), enhancing population-focused studies (Blair et al. Reference Blair, Le, Despres and McManus1999; Morgan et al. Reference Morgan, DeJong, Kazibwe, Mkoji and Loker2003). From a molecular analysis of an extensive collection of S. mansoni isolates, Morgan et al. (Reference Morgan, Dejong, Adeoye, Ansa, Barbosa, Bremond, Cesari, Charbonnel, Correa, Coulibaly, D'Andrea, De Souza, Doenhoff, File, Idris, Incani, Jarne, Karanja, Kazibwe, Kpikpi, Lwambo, Mabaye, Magalhaes, Makundi, Mone, Mouahid, Muchemi, Mungai, Sene, Southgate, Tchuente, Theron, Yousif, Magalhaes, Mkoji and Loker2005) postulated that the evolutionary origin of this parasite was in East Africa, between 300 000–430 000 years ago, and that worms of differing genetic backgrounds may have altered phenotypic traits, i.e. respond differently to control measures, influence host-related morbidity or effect snail-parasite compatibility.
Schematic of the DNA barcoding approach for S. mansoni. The complete mitochondrial genome is known for a laboratory-maintained isolate originally retrieved from Puerto Rico. The cox1 gene initiates at base-pair position 924, being 1533 nucleotides in length. A 396 sub-region of the cox1 can be conveniently amplified by polymerase chain reaction (PCR) using the primers ASMIT 1 & 2 and sequenced to assemble a DNA data-set for comparisons§. To link these data to that of Morgan et al. (Reference Morgan, Dejong, Adeoye, Ansa, Barbosa, Bremond, Cesari, Charbonnel, Correa, Coulibaly, D'Andrea, De Souza, Doenhoff, File, Idris, Incani, Jarne, Karanja, Kazibwe, Kpikpi, Lwambo, Mabaye, Magalhaes, Makundi, Mone, Mouahid, Muchemi, Mungai, Sene, Southgate, Tchuente, Theron, Yousif, Magalhaes, Mkoji and Loker2005), new PCR primers NHMMOR F&R were designed to obtain the necessary 617 base pairs for comparisons.

Taking a DNA barcoding approach, the aim of this study was to better document genetic variation within Ugandan S. mansoni testing for putative population divergence and sub-division.
Materials and Methods
Sampling schools and screening children: Lake Albert and Lake Victoria
As part of the annual monitoring and evaluation activities of the Ugandan NCP which began in 2003, some 4000 children, from a total of 37 primary schools, have undergone parasitological examination for intestinal schistosomiasis each year (Kabatereine et al. Reference Kabatereine, Brooker, Koukounari, Kazibwe, Tukahebwa, Fleming, Zhang, Webster, Stothard and Fenwick2007). During 2003 and 2004, a representative sample of S. mansoni across lakes Albert and Victoria was collected, balancing logistics and costs, from nine primary schools (PS) [(1 – Panyimur PS, 2 – Walukuba PS, 3 – Waaki (Butiaba PS), 4 – Runga PS, 5 – Tonya PS, 6 – Bwondha PS, 7 – Bugoto PS, 8 – Musubi PS and 9 – Buloosi PS), as outlined in the sketch map of Fig. 1].
To identify infected children at each school, each child provided a single stool sample from which two Kato-Katz (41·7 mg) thick smears were prepared and read at the school-site. At each location, egg-patent stool samples (>100 eggs per gram of stool [EPG]) from 5–8 children were pooled together for later retrieval of miracidia (see below). All children participating in these surveys were treated with PZQ (40 mg/kg) and ALB (400 mg) (Kabatereine et al. Reference Kabatereine, Brooker, Koukounari, Kazibwe, Tukahebwa, Fleming, Zhang, Webster, Stothard and Fenwick2007).
Retrieval of schistosome eggs and laboratory culture of adult worms
Pooled stools were first homogenized in 0·2 L of bottled mineral water before being passed through a metal sieve of 212 μm pore size to remove larger debris. The remaining aqueous slurry was then passed through a home-made Pitchford and Visser funnel (Pitchford and Visser, Reference Pitchford and Visser1975) and washed copiously with bottled mineral water (~1 L) to dilute occluding material. The final elutant (~20 ml), containing schistosome eggs, was poured into a large glass Petri dish which was then placed in direct sunlight to initiate hatching of miracidia.
Using a dissection microscope at ×25 magnification, miracidia were collected by pipette and used to infect laboratory-bred Biomphalaria glabrata at a dose of 5 miracidia per snail. For each attempted isolate, between 15–20 snails were exposed to fresh-hatched micracidia for a period of at least one hour. Typically, between 10–20 snails survived the pre-patent period with approximately half of those later shedding cercariae on a regular basis. Cercariae were collected from shedding snails and used to infect laboratory mice (~150 cercariae per mouse). After maturation of schistosomes, mice were euthanized and adult worms were collected by perfusion, and dissection by hand, according to standard methodology (Smithers and Terry, Reference Smithers and Terry1965). Worms were stored in liquid nitrogen before being processed for DNA analysis.
DNA barcoding: generation of cox1 sequences
Total genomic DNA from 50 adult schistosome worms (30 from Lake Albert and 20 from Lake Victoria, of which two thirds were male) was extracted using a DNeasy Blood & Tissue Kit (Qiagen Ltd, Crawley, UK). A 396 bp region of the cox1 was amplified using the primers ASMIT 1 and ASMIT 2, see Fig. 2, using Ready-To-Go PCR Beads (GE Healthcare, Chalfont St Giles, UK) and standard thermal cycling conditions (Stothard and Rollinson, Reference Stothard and Rollinson1997). To enable a comparison between the ASMIT region and that used by Morgan et al. (Reference Morgan, Dejong, Adeoye, Ansa, Barbosa, Bremond, Cesari, Charbonnel, Correa, Coulibaly, D'Andrea, De Souza, Doenhoff, File, Idris, Incani, Jarne, Karanja, Kazibwe, Kpikpi, Lwambo, Mabaye, Magalhaes, Makundi, Mone, Mouahid, Muchemi, Mungai, Sene, Southgate, Tchuente, Theron, Yousif, Magalhaes, Mkoji and Loker2005), primers NHMMOR F and NHMMOR R were designed using MacVector™ 7.2.2 (http://www.macvector.com/) and alignments of existing S. mansoni data, flanking the corresponding 617 bp Morgan region of the cox1. These were used to amplify 617 bp of the cox1 Morgan region of selected individual worms (1 from each district or ASMIT barcode group) using Ready-To-Go PCR Beads and cycling conditions; 95°C for 2 min and then 40 cycles of 95°C for 30 sec, 55°C for 30 sec and 72°C for 1 min followed by a final elongation step of 72°C for 10 min. Three μl of each amplicon was visualised on a 0·8% ethidium bromide agarose gel and positive PCR's were purified for sequencing using a QIAquick PCR purification Kit (Qiagen Ltd, Crawley, UK) and quantified using a Nanodrop ND-1000 spectrophotometer (Nanodrop Technologies Inc., Wilington, USA). Forward and reverse sequencing reactions were performed directly on each purified PCR product using an Applied Biosystems Big Dye Kit version 1.1 and run on an Applied Biosystems 3730 DNA analyzer (Applied Biosystems, Carlsbad, USA).
The sequences were assembled and manually edited using Sequencher ver. 4.6 (http://www.genecodes.com). Sequences from individual worms were aligned together in Sequencher and any polymorphic positions between sequences were checked by visualisation of the sequence chromatograms and the correct base assigned. All true polymorphic positions were recorded and the species identity of the sequence was confirmed using the Basic Local Alignment Search Tool (BLAST) and submitted to EMBL/Genbank.
Sampled children from central Uganda: Aloi
On the preliminary molecular evidence that a genetic partition between Lake Albert and Lake Victoria populations was appearing, an ad hoc parasitological survey was undertaken in October 2006 to retrieve S. mansoni from the central part of the country. Following the cessation of civil insecurities, it was possible to visit Lira district in which the NCP had only recently initiated activities. Egg-patent stool samples were processed from 3 children from Aloi PS (see Fig. 1), who were confirmed to have been born and raised locally. All children participating in these surveys were treated with PZQ (40 mg/kg) and ALB (400 mg) (Kabatereine et al. Reference Kabatereine, Brooker, Koukounari, Kazibwe, Tukahebwa, Fleming, Zhang, Webster, Stothard and Fenwick2007).
Retrieval of S. mansoni larval stages from Aloi: FTA card methodology
Eggs and miracidia were obtained from each individual stool sample from the three children using the Pitchford and Visser funnel method as described earlier. Using a dissection microscope, schistosome eggs or hatched miracidia were individually transferred onto Whatman FTA® indicator cards (Whatman plc, Maidstone, Kent, UK) in a volume of 3 μl of water and allowed to dry for 1 hour. Addition of the sample activates chemicals in the cards that lyse cells, inactivate proteins and immobilize the genomic nucleic acids. For DNA extraction, a 2·0 mm diameter disc was removed from the card at the centre, where the sample was loaded using a Harris Micro Punch and incubated for 5 min in 200 μl of FTA® purification reagent (Whatman plc., Maidstone, Kent, UK). The FTA® purification reagent was removed and the disc was incubated for a further 5 min in 200 μl of fresh FTA® purification reagent. This process was repeated for a total of 3 washes and was followed by 2×5 min incubations in 200 μl of TE buffer. Samples were air dried at 56°C for 10–30 min and the disc was visually checked to make sure it was dry before being used directly in PCR reactions using the ASMIT 1 & 2 primer set as described above. Positive PCRs were sequenced and data analysed as described above.
DNA barcoding: numerical analysis of ASMIT and MORGAN regions
The 50 ASMIT sequences were analyzed using Collapse version 1.2 (http://darwin.uvigo.es/software/collapse.html) to group identical sequences and identify different ASMIT cox1 haplotypes, or barcodes. Each unique haplotype was given an identifier code and the frequencies of each type within each school were plotted. To assess the putative evolutionary divergence between haplotypes the haplotypes were aligned using MacClade 4.05 (http://macclade.org/macclade.html) and then a minimum spanning network was created using the programme TCS (http://darwin.uvigo.es/software/tcs.html). The MORGAN cox1 region for each unique ASMIT cox1 haplotype was determined and later aligned with those sequences reported by Morgan et al. (Reference Morgan, Dejong, Adeoye, Ansa, Barbosa, Bremond, Cesari, Charbonnel, Correa, Coulibaly, D'Andrea, De Souza, Doenhoff, File, Idris, Incani, Jarne, Karanja, Kazibwe, Kpikpi, Lwambo, Mabaye, Magalhaes, Makundi, Mone, Mouahid, Muchemi, Mungai, Sene, Southgate, Tchuente, Theron, Yousif, Magalhaes, Mkoji and Loker2005) from the Lake Albert and Lake Victoria regions. To represent this evolutionary divergence, the haplotypes were aligned and a TCS network was again created, as well as, representation in a bifurcating tree, using Kimura's 2 parameter model (K-2-P) for pair-wise distance calculations, and subject to neighbour-joining analysis, with bootstrapping (100 replicates), using the programme PAUP* 4.0 (http://paup.csit.fsu.edu/). Within and between population diversity by lake was calculated and compared using Mega 4.1 (http://www.megasoftware.net/).
Sequence analysis of the ribosomal internal transcribed spacer (ITS)
To investigate further DNA variation within Ugandan S. mansoni and corroborate Morgan et al. (Reference Morgan, Dejong, Adeoye, Ansa, Barbosa, Bremond, Cesari, Charbonnel, Correa, Coulibaly, D'Andrea, De Souza, Doenhoff, File, Idris, Incani, Jarne, Karanja, Kazibwe, Kpikpi, Lwambo, Mabaye, Magalhaes, Makundi, Mone, Mouahid, Muchemi, Mungai, Sene, Southgate, Tchuente, Theron, Yousif, Magalhaes, Mkoji and Loker2005) observations, the complete ITS region (923 bp) was amplified and sequenced, from all worms inspected for the MORGAN cox1 region, using the primers ITSF – TAACAAGGTTTCCGTAGGTGAA and ITSR – TGCTTAAGTTCAGCGGGT and conditions previously described (Kane and Rollinson, Reference Kane and Rollinson1994).
RESULTS
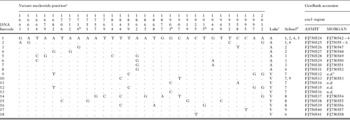
In total, 50 DNA barcodes were generated for the ASMIT region and from these data 18 unique barcodes, or haplotypes, were identified. These ASMIT DNA barcodes, denoted 1 to 18, and their associated GenBank accession numbers, are shown in Table 1, as well as, their variant nucleotides therein. Thirty nucleotide positions were found to vary across the alignment and using the flatworm mitochondrial DNA codon table, three variants induced non-synonymous amino acid changes. Replacements took place at positions 1716 – isoleucine/valine, 1901 – leucine/phenylalanine and 1935 – phenylalanine/valine, all amino acids having hydrophobic side chain groups. For the ASMIT region, a K-2-P nucleotide distance was calculated for within and between lake samples as shown in Table 2, as well as, in comparison with two other S. mansoni sequences for outgroup comparison(s). There was slightly greater sequence diversity within the Lake Victorian sample, 1·4% vs. 1·0%, and within-population divergence exceeded divergence between which was very low (0·1%) as shown in Table 2.
Summary of the nucleotide variation within each of the 18 ASMIT barcodes identified and their occurrence within sampled schools from Lake Albert and Lake Victoria in Uganda. Each sequence has been deposited in GenBank, and the corresponding accession numbers are shown, together with the corresponding MORGAN sequence.

a The nucleotide position is taken from the numbering of the complete mitochondrial genome of S. mansoni (GenBank accession AF216698.1).
b The variation at these positions are non-synonymous changes which induce amino acid changes.
c A – Lake Albert, V – Lake Victoria.
d 1 – Panyimur PS, 2 – Walakuba PS, 3 – Waaki(Butiaba) PS, 4 – Runga PS, 5 – Tonya PS, 6 – Bwondha PS, 7 – Bugoto PS, 8 – Musubi PS, 9 – Buloosi PS.
e Not determined (n.d.) as the genomic DNA from these single worms was exhausted.
A matrix containing the K-2-P distances for the ASMIT (lower diagonal) and MORGAN (upper diagonal – shaded) cox1 regions for the Lake Albert and Lake Victoria populations; the population outgroups refer to cox1 sequences from a Puerto Rican and Senegalese sample of S. mansoni.

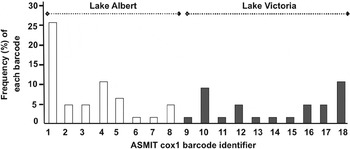
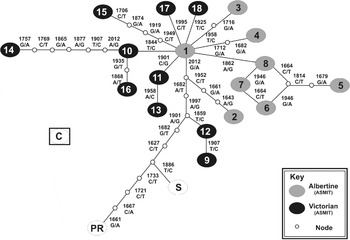
The frequency distribution of the 18 ASMIT barcodes is shown in Table 1. Most notable, barcodes 1 to 8 were found in Lake Albert villages while barcodes 9 to 18 were found in Lake Victoria villages. There was no cross-over of barcodes between lakes and a chi-square test of this distribution revealed a very significant imbalance (χ2=50, 1 d.f., P<0·001). Within Lake Albert, barcode 1 was most dispersed between schools, barcode 2 occurred in two schools, while barcodes 5, 6 and 7 were found in Waaki (Butiaba) alone indicating that at the school level, there is evidence of some genetic sub-structuring. By contrast in Lake Victoria, DNA barcodes were less dispersed between schools with only barcode 10 occurring in more than one location (Bugoto and Buloosi). The sample from Bwondha PS is of note for the presence of only one barcode, 18. The frequencies of each barcode across the total sample are shown in Fig. 3. Barcode 1 is most common with barcodes 4, 10 and 18 there after. In Lake Albert, barcode 1 predominated, while in Lake Victoria no single barcode dominated as there were five (10, 12, 16, 17 and 18) of similar frequencies. In consideration of the 15 ASMIT sequences from the central Ugandan sample from Aloi, 14 matched ASMIT barcode 1 while the remainder matched ASMIT barcode 2.
Frequency distributions of each ASMIT barcode type (1–18) across the whole Ugandan sample. Most notable is that barcodes 1–8 were encountered only in Lake Albert whereas 9–18 were encountered in Lake Victoria. Barcode 1 is most common and appears to dominate the Lake Albert sample.

Using statistical parsimony an evolutionary network representing the putative genealogy of barcodes is shown in Fig. 4 with the associated step changes indicated matching the variant positions in Table 1. The two outgroup sequences of S. mansoni from Senegal and Puerto Rico could be linked to this genealogical network whereas that from Cameroon could not owing to sequence divergence exceeding that of the linking algorithm break-point. Within this network, barcode 1 appears centrally placed, linked to 5 other barcodes on the basis of a single mutation, and is putatively ancestral to all other variants. Barcode 14 appears most divergent to the remainder while a closed loop links barcodes 6, 7 and 8. In this network barcodes 3, 16 and 11/13 possessed non-synonymous amino acid replacements at positions 1716, 1935 and 1901, respectively. Mapping the area of origin of the different barcodes onto this network reveals that Lake Victorian samples have likely originated from a diversification of barcode 1.
A genealogical network depicting the substitutional changes between the 18 ASMIT barcodes. While barcodes obtained from the Puerto Rican (PR) and Senegalese (S) S. mansoni can be linked into this network the divergence between these samples and that from Cameroon (C) exceeds the network break point. It can be assumed that the central placement of barcode 1 infers an ancestral position to the majority of the Ugandan sample.

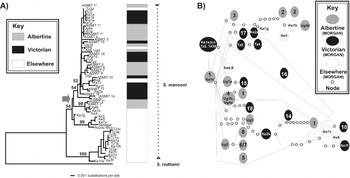
Representatives of the 18 ASMIT barcodes were sequenced for the MORGAN region and GenBank accession numbers are shown in Table 1. In total 17 sequences were generated each being unique with the exception that ASMIT barcodes 6 and 7 produced identical sequences for the MORGAN fragment. Three MORGAN sequences generated in this study matched exactly Ug1b/Ug4a, Ke1c and Ke1d reported by Morgan et al. (Reference Morgan, Dejong, Adeoye, Ansa, Barbosa, Bremond, Cesari, Charbonnel, Correa, Coulibaly, D'Andrea, De Souza, Doenhoff, File, Idris, Incani, Jarne, Karanja, Kazibwe, Kpikpi, Lwambo, Mabaye, Magalhaes, Makundi, Mone, Mouahid, Muchemi, Mungai, Sene, Southgate, Tchuente, Theron, Yousif, Magalhaes, Mkoji and Loker2005). Estimates of diversity and divergence between ASMIT and MORGAN regions were very similar; within-population diversity was one order of magnitude greater than that observed between (Table 2). Using all available sequences a neighbour-joining tree is presented in Fig. 5. From this dendrogram four major groupings are evident which correspond to the major lineages as determined by Morgan et al. (Reference Morgan, Dejong, Adeoye, Ansa, Barbosa, Bremond, Cesari, Charbonnel, Correa, Coulibaly, D'Andrea, De Souza, Doenhoff, File, Idris, Incani, Jarne, Karanja, Kazibwe, Kpikpi, Lwambo, Mabaye, Magalhaes, Makundi, Mone, Mouahid, Muchemi, Mungai, Sene, Southgate, Tchuente, Theron, Yousif, Magalhaes, Mkoji and Loker2005) ; lineage 1: Ke10a – Tz3c; lineage 5: Ke7g – Ke3; lineage 3: Ke4 – ASMIT 2 and Ke2b – ASMIT 1. Mapping the distribution of each barcode with geographical origin revealed, with one or two exceptions, that sub-lineages appeared to partition by lake. For example, the groups Ug2 – ASMIT 5 and Tz4 – ASMIT 16 were exclusive to Lake Albert and Lake Victoria, respectively. Another predominantly Lake Victorian group Ke2a – ASMIT 10 is confounded by two sequences, Ke8 and Ke7c, which have been found in central Kenya. The group Ke1c – ASMIT 1 is of particular note as containing Ugandan Lake Albert (ASMIT 1*), Kenyan (Ke1a,b,c,e) and Tanzanian (Tz2) Lake Victoria, as well as, central Tanzanian (Tz3d) representatives and is further evidence that ASMIT 1 is ancestral to all the haplotypes/barcodes.
Evolutionary relationships between samples inferred from the MORGAN cox1 region. Fig. 5A. A neighbour-joining tree representing the evolutionary divergence between samples and S. rohdaini. Note that there are four major lineages which correspond to the groups identified by Morgan et al. (Reference Morgan, Dejong, Adeoye, Ansa, Barbosa, Bremond, Cesari, Charbonnel, Correa, Coulibaly, D'Andrea, De Souza, Doenhoff, File, Idris, Incani, Jarne, Karanja, Kazibwe, Kpikpi, Lwambo, Mabaye, Magalhaes, Makundi, Mone, Mouahid, Muchemi, Mungai, Sene, Southgate, Tchuente, Theron, Yousif, Magalhaes, Mkoji and Loker2005). Fig 5B. A genealogical network of MORGAN cox1 barcodes reveals a complex pattern of substitutions with discrete clusters of types appearing by lake. Grey arrow in A depicts all Ugandan samples to the right.

Inspection of the ITS region from 18 worms, as examined for MORGAN cox1, revealed that all ITS sequences were identical. This sequence has been deposited in GenBank with accession number FJ750523.
DISCUSSION
Although sequence variation in mitochondrial genes has been widely used to infer species phylogeny for many years (Le et al. Reference Le, Blair, Agatsuma, Humair, Campbell, Iwagami, Littlewood, Peacock, Johnston, Bartley, Rollinson, Herniou, Zarlenga and McManus2000), only since the start of the millennium has there been a large-scale, coordinated effort to document and record the genetic diversity within natural populations which has centralized upon the DNA barcoding approach for cox1 [see CBOL-Consortium for the Barcode of Life (http://www.barcoding.si.edu)]; the appeal of which is to assemble datasets which enable cross-comparison(s) between sampled taxa in more meaningful ways to assess levels of population structure and genetic diversity within ‘typical’ species (Frezal and Leblois, Reference Frezal and Leblois2008). Infraspecifc levels of DNA divergence have typically been shown to be less than 2% (Besansky et al. Reference Besansky, Severson and Ferdig2003), although there can be some notable exceptions, as recently shown in the barcoding appraisal of Bulinus by Kane et al. (Reference Kane, Stothard, Emery and Rollinson2008). Attractive features of mitochondrial DNA include a ‘fast rate’ of evolution and a predominantly maternal-mode of inheritance although for schistosomes it is known that bi-parental transmission can occur (Jannotti-Passos et al. Reference Jannotti-Passos, Souza, Parra and Simpson2001) which would immediately question the application of population genetic models that make strict assumptions on mode of transmission/inheritance.
Nevertheless, DNA barcodes can be used in a simple ‘genetic-identification-tag’ methodology where simple matching of identical sequences (i.e. presumably of common co-ancestry) reveals the existence of uniformity both within and between populations. In this instance, barcoding has revealed the existence of 18 types in our sample of Ugandan S. mansoni. More broadly, this means that approximately one in every three sampled worms had a different ASMIT cox1 sequence, although the frequencies of each of the DNA barcodes did differ as certain types are proportionally more common than others (see Fig. 3); ASMIT barcode 1, for example, occurred most frequently in a quarter of the total sample.
This rather remarkable level of numbers of unique barcodes has been previously observed by Morgan et al. (Reference Morgan, Dejong, Adeoye, Ansa, Barbosa, Bremond, Cesari, Charbonnel, Correa, Coulibaly, D'Andrea, De Souza, Doenhoff, File, Idris, Incani, Jarne, Karanja, Kazibwe, Kpikpi, Lwambo, Mabaye, Magalhaes, Makundi, Mone, Mouahid, Muchemi, Mungai, Sene, Southgate, Tchuente, Theron, Yousif, Magalhaes, Mkoji and Loker2005) who found that 85 of 143 worms sampled originating from Africa and the New World differed. This clearly affirms that mitochondrial genome of S. mansoni is genetically diverse at the populational level and that populations are unlikely to be uniform, or monomorphic, if sampled intensively. This diversity contrasts sharply with that of other traditional phylogenetic markers, for example, the nuclear ribosomal ITS, which has been shown to be uniform across S. mansoni (Morgan et al. Reference Morgan, Dejong, Adeoye, Ansa, Barbosa, Bremond, Cesari, Charbonnel, Correa, Coulibaly, D'Andrea, De Souza, Doenhoff, File, Idris, Incani, Jarne, Karanja, Kazibwe, Kpikpi, Lwambo, Mabaye, Magalhaes, Makundi, Mone, Mouahid, Muchemi, Mungai, Sene, Southgate, Tchuente, Theron, Yousif, Magalhaes, Mkoji and Loker2005) as well as within our Ugandan samples, which suggests perhaps that insufficient time has accrued to accumulate any mutations in this locus.
From a mitochondrial perspective, variation within cox1 is perhaps not surprising given that this gene can accumulate a considerable amount of nucleotide substitutions as shown upon cross-specific comparisons (Zarowlecki et al. Reference Zarowlecki, Huyse and Littlewood2007) but the most striking aspect of this Ugandan dataset, however, is the occurrence of barcodes 1–8 and 9–18 being restricted to Lake Albert and Lake Victoria schools, respectively and no apparent cross-over between lakes. This conclusively reveals a discrete geographical partition demonstrative of limited, if any, admixture of worms between these sampled populations. In so doing, this sheds new light on the known epidemiological heterogeneity of intestinal schistosomiasis between these lake environments (Balen et al. Reference Balen, Stothard, Kabatereine, Tukahebwa, Kazibwe, Whawell, Webster, Utzinger and Fenwick2006; Koukounari et al. Reference Koukounari, Fenwick, Whawell, Kabatereine, Kazibwe, Tukahebwa, Stothard, Donnelly and Webster2006) which could be due to parasite diversity itself. It is perhaps all the more surprising that the parasite population is still remaining partitioned, at least in school-aged children, given the considerable human migration of fishing communities between lake systems (Kabatereine et al. Reference Kabatereine, Tukahebwa, Kazibwe, Namwangye, Zaramba, Brooker, Stothard, Kamenka, Whawell, Webster and Fenwick2006). As part of the monitoring and evaluation activities, the Ugandan NCP was therefore sensible to document the infection dynamics of intestinal schistosomiasis in each lake system which has also uncovered some subtle differences in the way the parasite is perceived to respond to annual chemotherapy (Kabatereine et al. Reference Kabatereine, Brooker, Koukounari, Kazibwe, Tukahebwa, Fleming, Zhang, Webster, Stothard and Fenwick2007; Zhang et al. Reference Zhang, Koukounari, Kabatereine, Fleming, Kazibwe, Tukahebwa, Stothard, Webster and Fenwick2007).
In light of this genetic partition between lakes, and as intestinal schistosomiasis is known from the central region of Uganda (Kabatereine et al. Reference Kabatereine, Brooker, Tukahebwa, Kazibwe and Onapa2004), an immediate question would be – what are the population affiliation(s) of worms retrieved from central areas? Logically there could be four possibilities: (1) the population is unique, not matching samples from either lake; (2) the population matches Albertine samples; (3) the population matches Victorian samples; and (4) the population is a composite of both Albertine and Victorian samples or possesses unique types as well. Given that the Nile flows northwards and could potentially carry permissive intermediate hosts downstream to sustain local transmission, it is perhaps unusual that worms from central Uganda matched the two Albertine barcodes 1 and 2. There is of course a possibility that permissive snails might equally spread up-stream but in this instance it is highly unlikely given all alternatives, as the waterfall at Murchison acts as a considerable physical barrier to aquatic biota. From this ad hoc survey taking advantage of FTA card methodologies (Gower et al. Reference Gower, Shrivastava, Lamberton, Rollinson, Webster, Emery, Kabatereine and Webster2007), it was demonstrated that barcodes 1 and 2 were not exclusive to Lake Albert. Through further sequencing of the MORGAN region and comparison with GenBank information it was shown that barcode 1 exactly matched Ke1c, a sample retrieved from Homa Bay, Lake Victoria, Kenya. It can therefore be shown that whilst there is diversity between sampled areas, there can be barcode types which are found throughout the Nilotic region, albeit with a sporadic distribution(s). Another interesting aspect of the distribution of barcodes within each sampled lake is that those in Lake Albert appear more mixed while those in Lake Victoria appear more isolated (see Table 1). In this instance it could be influenced by the more uniform, linear shoreline environment of Lake Albert which sharply contrasts with the very intricate and convoluted shoreline of Lake Victoria which favors the likely sequestration of both human and snail populations. From an applied perspective it could be immediately inferred that population admixture would be greatest in Lake Albert while in Lake Victoria would be much lower, if at all. This population appraisal could shed new light on the spread of any locally evolved traits, for example, putative heritable resistance to anthelminthics, which might appear in the face of selection pressure(s) from ongoing control (Webster, Gower and Norton, Reference Webster, Gower and Norton2008).
With the availability of computer programmes that implement statistical parsimony, it is possible to infer genealogical networks without recourse to methods that enforce bifurcating tree structures, which are perhaps less appropriate for reconstruction of evolutionary pathways between closely related sequence lineages (Clement, Posada and Crandall, Reference Clement, Posada and Crandall2000). The inferred genealogical relationship between the 18 ASMIT barcodes shown in Fig. 4 brings a greater insight into the hypothetical relationships which have given rise to the observed geographical distribution. Foremost, barcode 1 can be considered ancestral and centrally placed to the majority of other barcodes, as well as, the Puerto Rican and Senegalese S. mansoni, but not, however, with a sequence obtained from Cameroon (Bonnie Webster, unpublished data). For example, five other barcodes (8, 10, 11, 17 and 18) differ from the core sequence of barcode 1 by one nucleotide substitution, with a further four barcodes (3, 4, 7 and 13) with only two substitutions. All these barcodes, except 7, 12 and 13, are quite common in frequency in the examined sample (Fig. 3). It would be therefore reasonable to suggest that each of these barcodes has evolved locally, perhaps in situ, where they are now found today, from an originally widely dispersed barcode 1 lineage. This might also better explain why the diversity in both ASMIT and MORGAN regions within Lakes Albert and Victoria is in excess of the net divergence between the two lakes (see Table 2); this in situ diversification has perhaps undergone in a parallel fashion independently. Notably the percentage levels of diversity within populations are surprisingly large, ~1·0% and ~1·4% for Lake Albert and Lake Victoria, respectively, and taken more generally within the DNA barcoding rubric, infer a diversity exceeding that of the majority of examined species (Frezal and Leblois, Reference Frezal and Leblois2008).
Assembling a larger cox1 dataset using the MORGAN region and comparing deeper lineage evolution with a bifurcating tree structure reveals that there is good stability of certain groups (see Fig. 5A) with high bootstrap support (>95%). It is immediately evident that the East African samples fall into four of the five previously described lineages of Morgan et al. (Reference Morgan, Dejong, Adeoye, Ansa, Barbosa, Bremond, Cesari, Charbonnel, Correa, Coulibaly, D'Andrea, De Souza, Doenhoff, File, Idris, Incani, Jarne, Karanja, Kazibwe, Kpikpi, Lwambo, Mabaye, Magalhaes, Makundi, Mone, Mouahid, Muchemi, Mungai, Sene, Southgate, Tchuente, Theron, Yousif, Magalhaes, Mkoji and Loker2005). Most notable is lineage 1 which is characterized by S. mansoni from central Kenya and Tanzania which has not, so far, been encountered in Lake Victoria nor in Uganda. This lineage is notable for its exclusive use of the intermediate host snail B. pfeifferi while in other lineages intermediate host associations do not appear clear-cut (Morgan et al. Reference Morgan, Dejong, Adeoye, Ansa, Barbosa, Bremond, Cesari, Charbonnel, Correa, Coulibaly, D'Andrea, De Souza, Doenhoff, File, Idris, Incani, Jarne, Karanja, Kazibwe, Kpikpi, Lwambo, Mabaye, Magalhaes, Makundi, Mone, Mouahid, Muchemi, Mungai, Sene, Southgate, Tchuente, Theron, Yousif, Magalhaes, Mkoji and Loker2005). This is perhaps not surprising given the recent molecular appraisal of Biomphalaria which would suggest the existing taxonomic designations are unreliable (Jorgensen et al. Reference Jorgensen, Kristensen and Stothard2007; Plam et al. Reference Plam, Jorgensen, Kristensen and Madsen2008).
The Ugandan samples of S. mansoni affiliate with two lineages 3 and 4, with the majority falling within 4 and forming sub-lineages within more equivocal bootstrap values. What is perhaps most interesting in this lineage is that there are five barcodes (Tz3d, Ke6, Ke8, Ke7c and Ke9) which likely represent the emigration of an originally lacustrine form of S. mansoni to central Kenya/Tanzania. Barcode 2 which has affiliations with lineage 3 is found in Lake Albert, central Uganda as well as central Kenya. With one or two exceptions, the sub-lineages within 4 appear to partition by Lake but the group incorporating Ke1c – ASMIT 1* seems most geographically diverse. Turning to a genealogical network analysis (see Fig. 5b), it could be considered that these seven sequences are ancestral to the majority of other types within lineage 4. While the network of Fig. 5b is more complicated in structure to that of Fig. 4, there appears to be good support to suggest that an ancestral sequence type (barcode 1 or Ke1a) has diversified in situ and given rise to other barcodes which appear ‘philopatric’, i.e. arisen where they are still found today. The only exception being barcode Ke6/Ke9 which is found at Taveta and Mtito River in Kenya (Morgan et al. Reference Morgan, Dejong, Adeoye, Ansa, Barbosa, Bremond, Cesari, Charbonnel, Correa, Coulibaly, D'Andrea, De Souza, Doenhoff, File, Idris, Incani, Jarne, Karanja, Kazibwe, Kpikpi, Lwambo, Mabaye, Magalhaes, Makundi, Mone, Mouahid, Muchemi, Mungai, Sene, Southgate, Tchuente, Theron, Yousif, Magalhaes, Mkoji and Loker2005) and for whatever reasons has been able to disperse.
CONCLUSIONS
A DNA barcoding approach has revealed that the population genetic structure of Ugandan S. mansoni is not uniform across the endemic area. Specifically there are two discrete evolutionary lineages present in the country and within each lineage there is considerable genetic diversity. This genetic diversity has a strong spatial element, appearing to have evolved in situ and in parallel within Lake Albert and Victoria environments, and is strongly suggestive that there is little if any admixture of present populations across lakes. This lack of mixing strongly suggests that any locally evolved traits, for example putative heritable resistance to anthelmintics, would likely stay local and not quickly spread throughout the population. In addition, it would be important to ascertain exactly what population factors have promoted and maintained these genetic partitions.
ACKNOWLEDGEMENTS
We would like to thank the children and teachers who took part in these studies as well as during the annual parasitological inspections as part of monitoring and surveillance activities of the Ugandan NCP. From 2003–2008, Vector Control Division, received substantial support from the SCI, Imperial College London, and we particularly thank Professor Alan Fenwick for his endeavors. Ms Poppy Lamberton kindly donated adult worm specimens from Musubi PS which were analysed in this paper. We also thank the VCD field teams, in particular, the contributions of Leopold Marembo and Richard Galimaka whom both died in a vehicle collision in January 2008 and are much missed. Funding of the survey of Aloi benefitted from EU contract support.