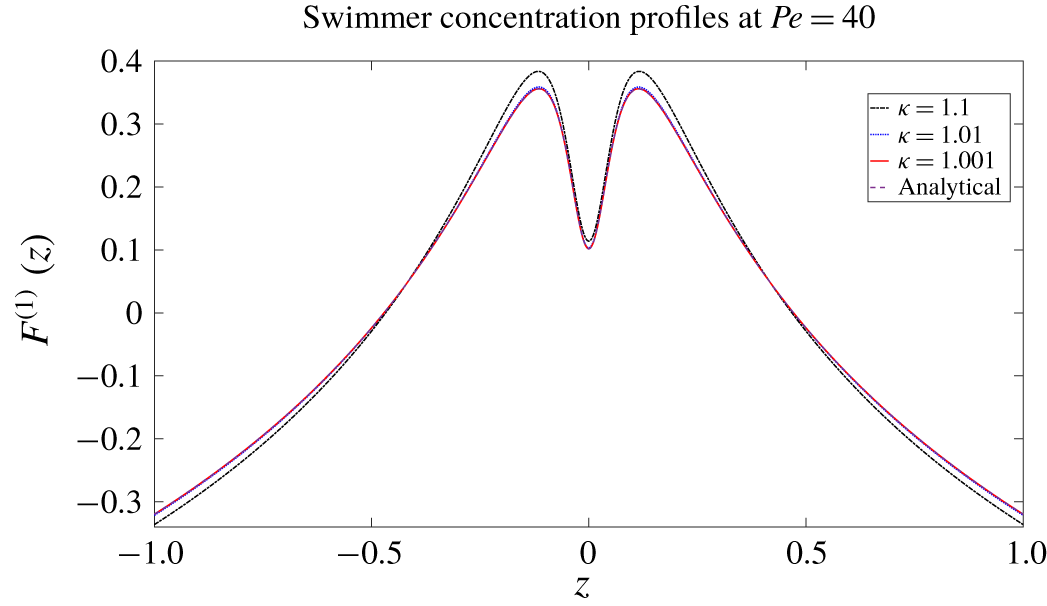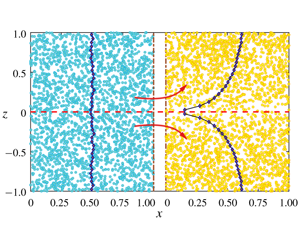


1 Introduction
Biologically active microswimmers, a subset of the low-Reynolds-number dwellers, have motivated research spanning over several decades (Hancock Reference Hancock1953; Gray & Hancock Reference Gray and Hancock1955; Brennen & Winet Reference Brennen and Winet1977; Pedley & Kessler Reference Pedley and Kessler1992; Koch & Subramanian Reference Koch and Subramanian2011; Guasto, Rusconi & Stocker Reference Guasto, Rusconi and Stocker2012; Marchetti et al. Reference Marchetti, Joanny, Ramaswamy, Liverpool, Prost, Rao and Simha2013). Owing to their intrinsic activity, suspensions of such microswimmers exhibit a host of interesting phenomena such as enhanced tracer diffusion (Wu & Libchaber Reference Wu and Libchaber2000; Underhill, Hernandez-Ortiz & Graham Reference Underhill, Hernandez-Ortiz and Graham2008; Leptos et al. Reference Leptos, Guasto, Gollub, Pesci and Goldstein2009; Krishnamurthy & Subramanian Reference Krishnamurthy and Subramanian2015; Patteson et al. Reference Patteson, Gopinath, Purohit and Arratia2016; Stenhammar et al. Reference Stenhammar, Nardini, Nash, Marenduzzo and Morozov2017), long-ranged orientational order (Saintillan & Shelley Reference Saintillan and Shelley2007, Reference Saintillan and Shelley2008; Underhill & Graham Reference Underhill and Graham2011; Stenhammar et al. Reference Stenhammar, Nardini, Nash, Marenduzzo and Morozov2017; Nambiar, Garg & Subramanian Reference Nambiar, Garg and Subramanian2019a), negative viscosities (Takatori & Brady Reference Takatori and Brady2014; Takatori, Yan & Brady Reference Takatori, Yan and Brady2014; López et al. Reference López, Gachelin, Douarche, Auradou and Clément2015; Takatori & Brady Reference Takatori and Brady2015; Bechtel & Khair Reference Bechtel and Khair2017; Nambiar, Nott & Subramanian Reference Nambiar, Nott and Subramanian2017; Nambiar et al. Reference Nambiar, Phanikanth, Nott and Subramanian2019b), collective motion/bacterial turbulence (Dombrowski et al. Reference Dombrowski, Cisneros, Chatkaew, Goldstein and Kessler2004; Underhill et al. Reference Underhill, Hernandez-Ortiz and Graham2008; Subramanian & Koch Reference Subramanian and Koch2009; Subramanian, Koch & Fitzgibbon Reference Subramanian, Koch and Fitzgibbon2011; Wensink et al. Reference Wensink, Dunkel, Heidenreich, Drescher, Goldstein, Löwen and Yeomans2012; Marchetti et al. Reference Marchetti, Joanny, Ramaswamy, Liverpool, Prost, Rao and Simha2013), among others. The underlying mechanisms driving most of these phenomena may be understood from studying quiescent swimmer suspensions, or those subjected to homogeneous shear flows. However, nearly all biologically relevant problems involve motile microorganisms in complex flow environments (Guasto et al. Reference Guasto, Rusconi and Stocker2012; Rusconi, Garren & Stocker Reference Rusconi, Garren and Stocker2014a). Complex flows, with or without boundaries, are known to alter the nutrient landscape (Taylor & Stocker Reference Taylor and Stocker2012), influence swimmer rheotaxis (Marcos & Stocker Reference Stocker2006; Marcos et al. Reference Fu, Powers and Stocker2012), result in shear-induced migration (Rusconi, Guasto & Stocker Reference Rusconi, Guasto and Stocker2014b; Barry et al. Reference Barry, Rusconi, Guasto and Stocker2015; Bearon & Hazel Reference Bearon and Hazel2015), in turn leading to shear-banding instabilities (Guo et al. Reference Guo, Samanta, Peng, Xu and Cheng2018; Vennamneni, Garg & Subramanian Reference Vennamneni, Garg and Subramanian2018) and possibly influencing biofilm formation (Rusconi et al. Reference Rusconi, Lecuyer, Guglielmini and Stone2010, Reference Rusconi, Garren and Stocker2014a; Kim et al. Reference Kim, Drescher, Pak, Bassler and Stone2014). The study in this paper examines the orientation dynamics and transport of microorganisms in one of the simplest inhomogeneous shearing flows – the pressure-driven flow between a pair of parallel plates.
Microorganisms, bacteria such as E. coli and B. subtilis, algae such as C. reinhardtii (Berg Reference Berg2008; Guasto et al. Reference Guasto, Rusconi and Stocker2012; Elgeti, Winkler & Gompper Reference Elgeti, Winkler and Gompper2015) and even artificial swimmers, exhibit an intrinsic stochasticity in their swimming motion owing to a tendency to reorient as they swim. The intrinsic stochasticity may be biologically motivated (Berg Reference Berg2008; Guasto et al. Reference Guasto, Rusconi and Stocker2012; Elgeti et al. Reference Elgeti, Winkler and Gompper2015), a consequence of reaction with the solvent (Ebbens et al. Reference Ebbens, Gregory, Dunderdale, Howse, Ibrahim, Liverpool and Golestanian2014; Moran & Posner Reference Moran and Posner2017) or driven by an external field (Chaturvedi et al. Reference Chaturvedi, Hong, Sen and Velegol2010; Fischer & Ghosh Reference Fischer and Ghosh2011; Peyer, Zhang & Nelson Reference Peyer, Zhang and Nelson2013). The reorientations occur either as discrete finite-amplitude events leading to run-and-tumble dynamics, or as continuous small-amplitude events leading to active Brownian dynamics. Regardless of its origin or detailed nature, the interplay between the stochastic dynamics of the swimmer and an imposed inhomogeneous shearing flow has been shown to result in migration patterns (Chilukuri, Collins & Underhill Reference Chilukuri, Collins and Underhill2014; Rusconi et al. Reference Rusconi, Guasto and Stocker2014b; Barry et al. Reference Barry, Rusconi, Guasto and Stocker2015; Bearon & Hazel Reference Bearon and Hazel2015; Chilukuri, Collins & Underhill Reference Chilukuri, Collins and Underhill2015; Ezhilan & Saintillan Reference Ezhilan and Saintillan2015; Sokolov & Aranson Reference Sokolov and Aranson2016; Sokolov et al. Reference Sokolov, Rubio, Brady and Aranson2018) that stand in sharp contrast to those known for suspensions of passive particles (Gadala-Maria & Acrivos Reference Gadala-Maria and Acrivos1980; Leighton & Acrivos Reference Leighton and Acrivos1987; Koh, Hookham & Leal Reference Koh, Hookham and Leal1994; Nott & Brady Reference Nott and Brady1994; Nitsche & Hinch Reference Nitsche and Hinch1997; Strednak et al. Reference Strednak, Shaikh, Butler and Guazzelli2018). Experiments and simulations on suspensions of passive particles in pressure-driven channel flow reveal, irrespective of particle geometry (rigid spheres and/or slender fibres), migration towards the channel centre (Koh et al. Reference Koh, Hookham and Leal1994; Nott & Brady Reference Nott and Brady1994; Strednak et al. Reference Strednak, Shaikh, Butler and Guazzelli2018). Microswimmers, on the other hand, depending on swimmer geometry and flow characteristics, exhibit migration both towards the wall (high-shear trapping) and channel centre (low-shear trapping) (Rusconi et al. Reference Rusconi, Guasto and Stocker2014b; Barry et al. Reference Barry, Rusconi, Guasto and Stocker2015; Bearon & Hazel Reference Bearon and Hazel2015). Recent experiments in a pressure-driven microchannel flow have found slender bacteria to migrate towards the walls (Rusconi et al. Reference Rusconi, Guasto and Stocker2014b), whereas relatively round algae have been found to migrate towards the wall or the centreline depending on the particular species and the prevailing shear rate (Barry et al. Reference Barry, Rusconi, Guasto and Stocker2015). Earlier computations by Ezhilan & Saintillan (Reference Ezhilan and Saintillan2015), for infinitely slender swimmers, have only confirmed the existence of high-shear trapping over a range of  $Pe$. Here,
 $Pe=U_{f}/(D_{r}H)$ is the rotary Péclet number, the shear rate (
 $U_{f}/H$) measured in units of the inverse rotary diffusivity (
 $D_{r}^{-1}$);
 $U_{f}$ and
 $H$ are, respectively, the centreline velocity and channel half-width, and
 $D_{r}$ the swimmer diffusivity. An independent computational investigation by Bearon & Hazel (Reference Bearon and Hazel2015) revealed regimes of both high- and low-shear trapping, but this was in contrast to the authors’ analysis which, similar to Ezhilan & Saintillan (Reference Ezhilan and Saintillan2015), predicted high-shear trapping regardless of swimmer aspect ratio (
 $\unicode[STIX]{x1D705}$); this apparent discrepancy remains unexplained. There have been additional simulations (Chilukuri et al. Reference Chilukuri, Collins and Underhill2014, Reference Chilukuri, Collins and Underhill2015) examining the spatial distribution, and the dispersion in the flow direction, of microswimmers (modelled as dumbbells), in pressure-driven channel flow. The channel in these cases was, however, quite narrow, and as a result, confinement effects, together with wall-mediated hydrodynamic interactions, were dominant. In contrast, the experiments mentioned above used channels much wider than the single swimmer dimension.
From the above summary, it is clear that a comprehensive understanding of the interplay between swimmer shape and shear-induced migration in a channel flow is lacking. In particular, there has been no attempt to interpret and explain the observations of Rusconi et al. (Reference Rusconi, Guasto and Stocker2014b) and Barry et al. (Reference Barry, Rusconi, Guasto and Stocker2015) based on a common theoretical framework. In this work, we use both theory and Langevin simulations, to comprehensively characterize shear-induced migration of microswimmers in the  $Pe{-}\unicode[STIX]{x1D705}$ plane, rationalizing the aforementioned observations in the process. Two distinct classes of swimmer concentration profiles are identified in this parameter plane, corresponding to high-shear and low-shear trapping behaviour. In § 2, the theoretical framework and the simulation protocol adopted are described. In § 2.1, beginning with the equation governing the swimmer probability density in position–orientation space, and using the separation of the fast
 $(O(D_{r}^{-1}))$ reorientation time scale and the much slower
 $(O(H^{2}D_{r}/U_{s}^{2}))$ time scale for migration across the channel (
 $U_{s}$ here being the swimming speed), we derive a drift-diffusion equation for the cross-stream swimmer concentration profile with the aid of the method of multiple scales. This is followed by the description of the simulation scheme in § 2.2; the scheme obtains the concentration profile by numerically integrating the Langevin equations of motion for the individual swimmers with periodic boundary conditions. The steady state swimmer concentration profiles obtained from the multiple scale analysis are presented in § 3; high-shear trapping is discussed in § 3.1 and low-shear trapping in § 3.2. In each case comparisons are drawn with both experiments (Rusconi et al. Reference Rusconi, Guasto and Stocker2014b; Barry et al. Reference Barry, Rusconi, Guasto and Stocker2015), and the Langevin simulations described in § 2.2. In § 3.3, the swimmer depletion index, a measure of the spatial inhomogeneity of the swimmer concentration, is plotted as a function of Pe for swimmers of different aspect ratios, highlighting both the singular behaviour of infinitely slender swimmers, and the centreline collapse that occurs for swimmers with
 $\unicode[STIX]{x1D705}$ finite but greater than (approximately) 2, for
 $Pe\rightarrow \infty$, in the low-shear trapping regime. Next, the shear-induced migration behaviour is organized on the
 $Pe{-}\unicode[STIX]{x1D705}$ plane, demarcating the low- and high-shear trapping regimes. In § 3.4, we examine the effect of an additional source of (passive) translational diffusion, independent from that arising due to swimming, and analyse the resulting transition from active to passive shear-induced migration patterns. Finally, in § 4, we present concluding remarks and directions for future work.
2 Theoretical framework and the Langevin simulation protocol
In § 2.1, we use the method of multiple scales to derive the swimmer concentration profiles as a function of the transverse coordinate in plane Poiseuille flow. Next, in § 2.2, we describe the scheme adopted to simulate a discrete system of swimmers in the same flow.
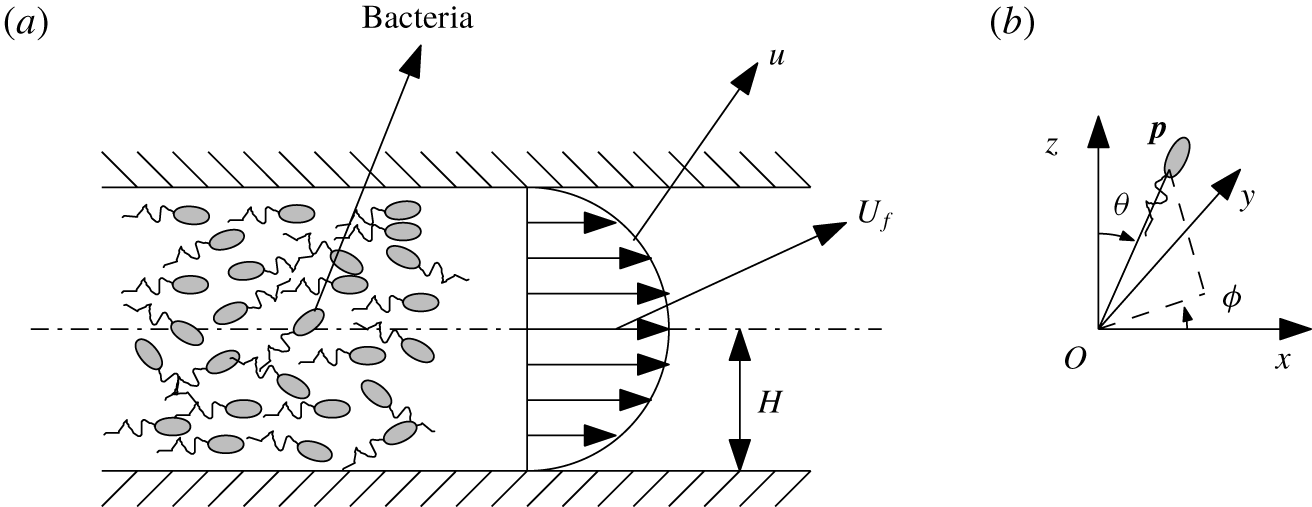
Schematic showing (a) a dilute swimmer (bacterial) suspension subject to a parabolic shearing flow ( $\boldsymbol{u}=(u,0,0)$) in a channel of width
 $2H$, and with a centreline velocity
 $U_{f}$. (b) The coordinate system used to analyse the swimmer orientation distributions.

2.1 Theoretical framework: the method of multiple scales
The time evolution of the probability density  $\unicode[STIX]{x1D6FA}(\boldsymbol{x},\boldsymbol{p},t)$ for a dilute swimmer suspension subject to a shearing flow (see figure 1) is given by (Subramanian & Koch Reference Subramanian and Koch2009)
 $$\begin{eqnarray}\frac{\unicode[STIX]{x2202}\unicode[STIX]{x1D6FA}}{\unicode[STIX]{x2202}t}+\unicode[STIX]{x1D735}_{\boldsymbol{x}}\boldsymbol{\cdot }((\boldsymbol{u}+U_{s}\boldsymbol{p})\unicode[STIX]{x1D6FA})+\unicode[STIX]{x1D735}_{p}\boldsymbol{\cdot }(\dot{\boldsymbol{p}}\unicode[STIX]{x1D6FA})+\frac{1}{\unicode[STIX]{x1D70F}}\left[\unicode[STIX]{x1D6FA}-\int \text{d}\,\boldsymbol{p}^{\prime }\,K(\,\boldsymbol{p}|\boldsymbol{p}^{\prime })\unicode[STIX]{x1D6FA}(\,\boldsymbol{p}^{\prime })\right]-D_{r}\unicode[STIX]{x1D6FB}_{p}^{2}\unicode[STIX]{x1D6FA}=0,\end{eqnarray}$$
where  $\boldsymbol{x}$ and
 $\boldsymbol{p}$ denote the swimmer position and orientation, respectively. The second term on the left-hand side of (2.1) denotes the spatial convection of probability density by both the fluid flow
 $\boldsymbol{u}$ and swimming velocity
 $U_{s}\boldsymbol{p}$, and the term involving
 $\dot{\boldsymbol{p}}$ denotes swimmer rotation by the ambient shear. The terms within brackets model a run-and-tumble process (Berg Reference Berg1993; Subramanian & Koch Reference Subramanian and Koch2009; Nambiar et al. Reference Nambiar, Nott and Subramanian2017), obeying Poisson statistics with a mean run duration
 $\unicode[STIX]{x1D70F}$; the kernel
 $K(\,\boldsymbol{p}|\boldsymbol{p}^{\prime })$ characterizes correlation between the pre (
 $\boldsymbol{p}^{\prime }$)- and post (
 $\boldsymbol{p}$)-tumble orientations, with
 $K(\,\boldsymbol{p}|\boldsymbol{p}^{\prime })=1/(4\unicode[STIX]{x03C0})$ for random tumbles. The last term on the left side of (2.1) models the stochastic orientation change due to rotary diffusion,
 $D_{r}$ being the rotary diffusivity. In writing (2.1), we have neglected any sources of translational diffusion other than that arising from swimming (for instance, a passive Brownian diffusivity). We examine the role of an additional source of translational diffusion in § 3.4.
In the experiments of Rusconi et al. (Reference Rusconi, Guasto and Stocker2014b) and Barry et al. (Reference Barry, Rusconi, Guasto and Stocker2015), the ratio of the channel width ( $H$) to the swimmer size (
 $L$) is approximately
 $40$. Thus, it is reasonable to assume that the swimmer senses a local linear flow, with its rotation governed by the Jeffery equation; therefore,
 $\dot{\boldsymbol{p}}=B[\boldsymbol{E}\boldsymbol{\cdot }\boldsymbol{p}-\boldsymbol{p}(\boldsymbol{E}\boldsymbol{ : }\boldsymbol{p}\boldsymbol{p})]+\boldsymbol{W}\boldsymbol{\cdot }\boldsymbol{p}$. Here,
 $B=(\unicode[STIX]{x1D705}^{2}-1)/(\unicode[STIX]{x1D705}^{2}+1)$ is the Bretherton constant,
 $E_{ij}=\dot{\unicode[STIX]{x1D6FE}}(z)(\unicode[STIX]{x1D6FF}_{i1}\unicode[STIX]{x1D6FF}_{j3}+\unicode[STIX]{x1D6FF}_{i3}\unicode[STIX]{x1D6FF}_{j1})/2$ and
 $W_{ij}=\dot{\unicode[STIX]{x1D6FE}}(z)(\unicode[STIX]{x1D6FF}_{i1}\unicode[STIX]{x1D6FF}_{j3}-\unicode[STIX]{x1D6FF}_{i3}\unicode[STIX]{x1D6FF}_{j1})/2$ are the strain rate and vorticity tensors, with
 $\dot{\unicode[STIX]{x1D6FE}}(z)=\text{d}u/\text{d}z$ being the shear rate at
 $z$, and
 $u(z)=U_{f}(1-(z/H)^{2})$ for the plane Poiseuille flow under consideration. In the above,
 $\unicode[STIX]{x1D6FF}_{ij}$ is the Kronecker delta, and the coordinate system used appears in figure 1. In using Jeffery’s equation above, we model the swimmers as equivalent spheroids with an aspect ratio
 $\unicode[STIX]{x1D705}$ (Leal & Hinch Reference Leal and Hinch1971), and it is via
 $\unicode[STIX]{x1D705}$ that the swimmer geometry enters the analysis, determining the nature of the shear-induced migration. This implicitly assumes an axisymmetric cross-section, which is a reasonable assumption, at least for bacteria (Darnton et al. Reference Darnton, Turner, Rojevsky and Berg2007; Das & Lauga Reference Das and Lauga2018), on account of the rapid (counter)-rotation on time scales much shorter than those characterizing shear-induced migration.
Non-dimensionalizing (2.1) using  $D_{r}^{-1}$,
 $U_{f}$, and
 $H$ as scales for time, velocity and length, respectively, yields
 $$\begin{eqnarray}\frac{\unicode[STIX]{x2202}\unicode[STIX]{x1D6FA}}{\unicode[STIX]{x2202}t}+\unicode[STIX]{x1D716}\unicode[STIX]{x1D735}_{\boldsymbol{x}}\boldsymbol{\cdot }(\unicode[STIX]{x1D6FA}\boldsymbol{p})+Pe\dot{\unicode[STIX]{x1D6FE}}\unicode[STIX]{x1D735}_{p}\boldsymbol{\cdot }(\tilde{\dot{\boldsymbol{p}}}\unicode[STIX]{x1D6FA})+\frac{1}{\unicode[STIX]{x1D70F}D_{r}}\left[\unicode[STIX]{x1D6FA}-\int \text{d}\,\boldsymbol{p}^{\prime }\,K(\,\boldsymbol{p}/\boldsymbol{p}^{\prime })\unicode[STIX]{x1D6FA}(\,\boldsymbol{p}^{\prime })\right]-\unicode[STIX]{x1D6FB}_{p}^{2}\unicode[STIX]{x1D6FA}=0,\end{eqnarray}$$
where  $\tilde{\dot{\boldsymbol{p}}}=\dot{\boldsymbol{p}}/\dot{\unicode[STIX]{x1D6FE}}(z)$ is a non-dimensional rotation rate. Note that convection by the fluid flow has now been omitted since we only examine the variations of the swimmer concentration in the gradient direction. The concentration variation being orthogonal to the direction of the fluid flow (either imposed or induced, the latter arising from the back coupling due to a swim stress; see Vennamneni et al. (Reference Vennamneni, Garg and Subramanian2018)), this convection term is identically zero. In (2.2),
 $\unicode[STIX]{x1D716}$, Pe and
 $\unicode[STIX]{x1D705}$ are dimensionless parameters that primarily determine the different regimes of shear-induced migration. The parameter
 $\unicode[STIX]{x1D716}=U_{s}/D_{r}H$, defined as the ratio of the swimmer mean free path
 $U_{s}/D_{r}$ to
 $H$, may be regarded as a swimmer Knudsen number. Note that in earlier efforts (Takatori et al. Reference Takatori, Yan and Brady2014; Takatori & Brady Reference Takatori and Brady2017),
 $\unicode[STIX]{x1D716}^{-1}$, which may be written as
 $U_{s}H/D_{t}$, with
 $D_{t}\sim U_{s}^{2}/(6D_{r})$ being the translational diffusivity, has been interpreted as the swim Péclet number. The parameter
 $\unicode[STIX]{x1D70F}D_{r}$ determines the roles of tumbling vis-a-vis rotary diffusion in the swimmer orientation dynamics. Active Brownian particles (ABPs) correspond to
 $\unicode[STIX]{x1D70F}D_{r}\rightarrow \infty$, and run-and-tumble particles (RTPs) to
 $\unicode[STIX]{x1D70F}D_{r}\rightarrow 0$ (Tailleur & Cates Reference Tailleur and Cates2009; Saintillan Reference Saintillan2010b); in the latter case, the swimmer Knudsen number is defined as
 $\unicode[STIX]{x1D716}=U\unicode[STIX]{x1D70F}/H$ instead. Regardless of the particular value of
 $\unicode[STIX]{x1D70F}D_{r}$, swimmers sample the channel cross-section diffusively for long times, the translational diffusivity being given by
 $D_{t}=(U_{s}^{2}/(6D_{r}))(\unicode[STIX]{x1D70F}D_{r}/(0.5+\unicode[STIX]{x1D70F}D_{r}))$ (Berg Reference Berg1993; Koch & Subramanian Reference Koch and Subramanian2011; Subramanian & Nott Reference Subramanian and Nott2012) in the general case; for
 $\unicode[STIX]{x1D70F}D_{r}\rightarrow \infty$,
 $D_{t}=U_{s}^{2}/(6D_{r})$ as above. In the experiments of Rusconi et al. (Reference Rusconi, Guasto and Stocker2014b),
 $\unicode[STIX]{x1D716}\sim 0.23$ for the bacterium B. subtilis. The modest value of
 $\unicode[STIX]{x1D716}$ implies that the time scales characterizing the swimmer orientation dynamics (of
 $O(\unicode[STIX]{x1D70F})$ or
 $O(D_{r}^{-1})$) and the diffusive sampling of the channel cross-section (of
 $O(H^{2}/U_{s}^{2})\unicode[STIX]{x1D70F}$ or
 $O(H^{2}D_{r}/U_{s}^{2})$) are well separated, their ratio being of
 $O(\unicode[STIX]{x1D716}^{2})$. Further, since the experimental range of flow rates corresponds to
 $U_{s}\ll U_{f}(\unicode[STIX]{x1D716}\ll Pe)$, we use the method of multiple scales to analyse the swimmer concentration profiles (Nitsche & Hinch Reference Nitsche and Hinch1997; Subramanian & Brady Reference Subramanian and Brady2004; Kasyap & Koch Reference Kasyap and Koch2012, Reference Kasyap and Koch2014; Vennamneni et al. Reference Vennamneni, Garg and Subramanian2018) for small
 $\unicode[STIX]{x1D716}$, but with
 $Pe$ and
 $\unicode[STIX]{x1D705}$ being arbitrary.
As a first step, we split the time derivative in (2.2) in terms of the fast intrinsic time scale  $t_{1}=t$ and the slow diffusive time scale
 $t_{2}=\unicode[STIX]{x1D716}^{2}t$, resulting in
 $\unicode[STIX]{x1D716}$
 $$\begin{eqnarray}\displaystyle & & \displaystyle \frac{\unicode[STIX]{x2202}\unicode[STIX]{x1D6FA}}{\unicode[STIX]{x2202}t_{1}}+\unicode[STIX]{x1D716}^{2}\frac{\unicode[STIX]{x2202}\unicode[STIX]{x1D6FA}}{\unicode[STIX]{x2202}t_{2}}+\unicode[STIX]{x1D716}\unicode[STIX]{x1D735}_{\boldsymbol{x}}\boldsymbol{\cdot }(\unicode[STIX]{x1D6FA}\boldsymbol{p})+Pe_{z}\unicode[STIX]{x1D735}_{p}\boldsymbol{\cdot }(\tilde{\dot{\boldsymbol{p}}}\unicode[STIX]{x1D6FA})+\frac{1}{\unicode[STIX]{x1D70F}D_{r}}\left[\unicode[STIX]{x1D6FA}-\int \text{d}\,\boldsymbol{p}^{\prime }\,K(\,\boldsymbol{p}/\boldsymbol{p}^{\prime })\unicode[STIX]{x1D6FA}(\,\boldsymbol{p}^{\prime })\right]\nonumber\\ \displaystyle & & \displaystyle \quad -\,\unicode[STIX]{x1D6FB}_{p}^{2}\unicode[STIX]{x1D6FA}=0,\end{eqnarray}$$
where  $Pe_{z}=Pe\dot{\unicode[STIX]{x1D6FE}}(z)$ is the local Péclet number. Now, expanding
 $\unicode[STIX]{x1D6FA}$ as
 $\unicode[STIX]{x1D6FA}(z,\boldsymbol{p},t;\unicode[STIX]{x1D716})=\unicode[STIX]{x1D6FA}_{0}(z,\boldsymbol{p},t_{1},t_{2})+\unicode[STIX]{x1D716}\unicode[STIX]{x1D6FA}_{1}(z,\boldsymbol{p},t_{1},t_{2})+\unicode[STIX]{x1D716}^{2}\unicode[STIX]{x1D6FA}_{2}(z,\boldsymbol{p},t_{1},t_{2})+\cdots \,$, yields the following set of equations at successive orders in
 $\unicode[STIX]{x1D716}$
 $$\begin{eqnarray}\displaystyle & \hspace{-8.39996pt}\displaystyle \mathit{O}(1):Pe_{z}\unicode[STIX]{x1D735}_{p}\boldsymbol{\cdot }(\,\tilde{\dot{\boldsymbol{p}}}G)+\frac{1}{\unicode[STIX]{x1D70F}D_{r}}\left[G-\int \text{d}\,\boldsymbol{p}^{\prime }\,K(\,\boldsymbol{p}/\boldsymbol{p}^{\prime })G(\,\boldsymbol{p}^{\prime })\right]-\unicode[STIX]{x1D6FB}_{p}^{2}G=0, & \displaystyle\end{eqnarray}$$
 $$\begin{eqnarray}\displaystyle & \hspace{-6.0pt}\displaystyle \mathit{O}(\unicode[STIX]{x1D716}):Pe_{z}\unicode[STIX]{x1D735}_{p}\boldsymbol{\cdot }(\,\tilde{\dot{\boldsymbol{p}}}\unicode[STIX]{x1D6FA}_{1})+\frac{1}{\unicode[STIX]{x1D70F}D_{r}}\!\left[\unicode[STIX]{x1D6FA}_{1}-\int \text{d}\,\boldsymbol{p}^{\prime }\,K(\,\boldsymbol{p}/\boldsymbol{p}^{\prime })\unicode[STIX]{x1D6FA}_{1}(\,\boldsymbol{p}^{\prime })\right]-\unicode[STIX]{x1D6FB}_{p}^{2}\unicode[STIX]{x1D6FA}_{1}=-\unicode[STIX]{x1D735}_{\boldsymbol{x}}\boldsymbol{\cdot }(\unicode[STIX]{x1D6FA}_{0}\boldsymbol{p}),\quad & \displaystyle \nonumber\\ \displaystyle & & \displaystyle\end{eqnarray}$$
 $$\begin{eqnarray}\displaystyle & & \displaystyle \displaystyle \mathit{O}(\unicode[STIX]{x1D716}^{2}):Pe_{z}\unicode[STIX]{x1D735}_{p}\boldsymbol{\cdot }(\,\tilde{\dot{\boldsymbol{p}}}\unicode[STIX]{x1D6FA}_{2})+\frac{1}{\unicode[STIX]{x1D70F}D_{r}}\left[\unicode[STIX]{x1D6FA}_{2}-\int \text{d}\,\boldsymbol{p}^{\prime }\,K(\,\boldsymbol{p}/\boldsymbol{p}^{\prime })\unicode[STIX]{x1D6FA}_{2}(\,\boldsymbol{p}^{\prime })\right]-\unicode[STIX]{x1D6FB}_{p}^{2}\unicode[STIX]{x1D6FA}_{2}\nonumber\\ \displaystyle & & \displaystyle \quad =-\frac{\unicode[STIX]{x2202}\unicode[STIX]{x1D6FA}_{0}}{\unicode[STIX]{x2202}t_{2}}-\unicode[STIX]{x1D735}_{\boldsymbol{x}}\boldsymbol{\cdot }(\unicode[STIX]{x1D6FA}_{1}\boldsymbol{p}).\end{eqnarray}$$
Here, we have written  $\unicode[STIX]{x1D6FA}_{0}$ as
 $\unicode[STIX]{x1D6FA}_{0}=F(z,t_{2})G(\,\boldsymbol{p};Pe_{z})$, with
 $\int \text{d}\,\boldsymbol{p}\,\unicode[STIX]{x1D6FA}(z,\boldsymbol{p},t_{2})=F(z,t_{2})$ denoting the
 $z$-dependent (normalized) swimmer concentration profile. The aforementioned ansatz assumes a quasi-steady response (
 $t_{1}\rightarrow \infty$), with the swimmer orientation distribution having relaxed to a
 $Pe_{z}$-dependent local equilibrium; accordingly, the fast time derivative (
 $\unicode[STIX]{x2202}/\unicode[STIX]{x2202}t_{1}$) has been omitted in (2.4)–(2.6) . Writing
 $\unicode[STIX]{x1D6FA}_{1}$ in (2.5) as
 $\unicode[STIX]{x1D6FA}_{11}\unicode[STIX]{x2202}F/\unicode[STIX]{x2202}z+\unicode[STIX]{x1D6FA}_{12}F$ on account of linearity, and using this form in (2.6) and integrating over orientation space, leads to a drift-diffusion equation for
 $F$
 $$\begin{eqnarray}\frac{\unicode[STIX]{x2202}F(z,t_{2})}{\unicode[STIX]{x2202}t_{2}}=\frac{\unicode[STIX]{x2202}}{\unicode[STIX]{x2202}z}\left(D_{zz}(z;Pe,\unicode[STIX]{x1D705})\frac{\unicode[STIX]{x2202}F(z,t_{2})}{\unicode[STIX]{x2202}z}-V_{z}(z;Pe,\unicode[STIX]{x1D705})F(z,t_{2})\right),\end{eqnarray}$$
where the diffusivity  $D_{zz}=-\int \text{d}\,\boldsymbol{p}\cos \unicode[STIX]{x1D703}\unicode[STIX]{x1D6FA}_{11}$ and drift
 $V_{z}=\int \text{d}\,\boldsymbol{p}\cos \unicode[STIX]{x1D703}\unicode[STIX]{x1D6FA}_{12}$. The diffusivity and drift in (2.7) are scaled with
 $U_{s}^{2}/D_{r}$ and
 $U_{s}^{2}/D_{r}H$, respectively. At steady state, for impermeable walls
 $$\begin{eqnarray}F(z)=\aleph \exp \left(\int _{-1}^{z}\,\text{d}z^{\prime }\frac{V_{z}(z^{\prime })}{D_{zz}(z^{\prime })}\right),\end{eqnarray}$$
where
 $$\begin{eqnarray}\aleph =\frac{1}{\int _{-1}^{1}\,\text{d}z\exp \left(\displaystyle \int _{-1}^{z}\,\text{d}z^{\prime }{\displaystyle \frac{V_{z}(z^{\prime })}{D_{zz}(z^{\prime })}}\right)}\end{eqnarray}$$
is determined from the normalization condition  $\int _{-1}^{1}\,\text{d}z\,F(z)=1$. Determining
 $D_{zz}$ and
 $V_{z}$ requires knowledge of the orientation distribution as a function of
 $Pe$ and
 $\unicode[STIX]{x1D705}$. For arbitrary
 $Pe$, the orientation distributions, at different orders in
 $\unicode[STIX]{x1D716}$, are written as a truncated series in spherical harmonics, with the resulting coefficients being obtained numerically (Nambiar et al. Reference Nambiar, Garg and Subramanian2019a) (see appendix A), while for small
 $Pe$, the orientation distribution is determined analytically via a perturbation expansion (see appendix B).
2.2 Langevin simulation scheme
The objective is to simulate a population of  $N$ swimmers subject to a parabolic flow profile, with the purpose of determining the cross-stream swimmer concentration profile. Thus, there are three degrees of freedom per swimmer: two orientation degrees of freedom and one spatial (the swimmer
 $z$ coordinate). In other words, while we keep track of the swimmer orientation in three dimensions, only the cross-stream location
 $z$ of each swimmer is recorded. Following the experimental protocol of Rusconi et al. (Reference Rusconi, Guasto and Stocker2014b), the swimmers are uniformly distributed along
 $z$ at the initial time, with their orientations following an isotropic distribution. Thereafter, at each time step
 $\unicode[STIX]{x1D6FF}t$, the swimmer orientation changes on account of either rotary diffusion or run-and-tumble motion, and due to the rotation by the flow. Here, the rotary diffusion process is modelled using the method outlined in Ghosh, Samuel & Sinha (Reference Ghosh, Samuel and Sinha2012), whereas run-and-tumble motion is implemented in accordance with Poisson statistics (Berg Reference Berg1993; Krishnamurthy & Subramanian Reference Krishnamurthy and Subramanian2015). The flow-induced rotation at any
 $z$ is determined using (2.2). Following the update in the swimmer orientations, their positions are updated using a second-order Runge–Kutta scheme, while also accounting for periodic boundary conditions in the
 $z$-direction. To avoid artefacts arising from a jump in shear rate which the swimmer encounters while swimming across the cross-stream (periodic) boundaries, the flow profile is chosen to be a double Poiseuille flow, which implies that the spatial extent of the simulation domain is
 $z\in [0,4H]$. Nevertheless, we have verified that both single and double Poiseuille flow profiles yield the same steady state concentration profiles. Every result reported here is obtained from simulating a set of ten independent initial conditions, with a given run having 18 000 swimmers; every run has been averaged over each of the four half-widths (
 $H$) of the double Poiseuille flow profile. For most runs, we fix
 $\unicode[STIX]{x1D716}=0.05$, and find this to be sufficient to capture the
 $\unicode[STIX]{x1D716}\ll 1$ regime that pertains to the multiple scale analysis.
3 Results and discussion
Herein, the results for the steady state cross-stream swimmer concentration profiles are presented primarily for ABPs. While RTPs exhibit analogous behaviour for small to  $O(1)~Pe$ numbers, the location of the boundary separating the high-shear and low-shear trapping regimes differs. The resulting implications, and the associated sensitivity of this boundary to the precise swimming mechanism, will be reported in a later communication. We first discuss swimmer migration towards walls leading to high-shear trapping, highlighting the ranges of
 $\unicode[STIX]{x1D705}$ and
 $Pe$ that correspond to this behaviour (§ 3.1), before moving on to examining migration towards the centreline leading to low-shear trapping (§ 3.2).
3.1 Swimmer migration towards walls – high-shear trapping
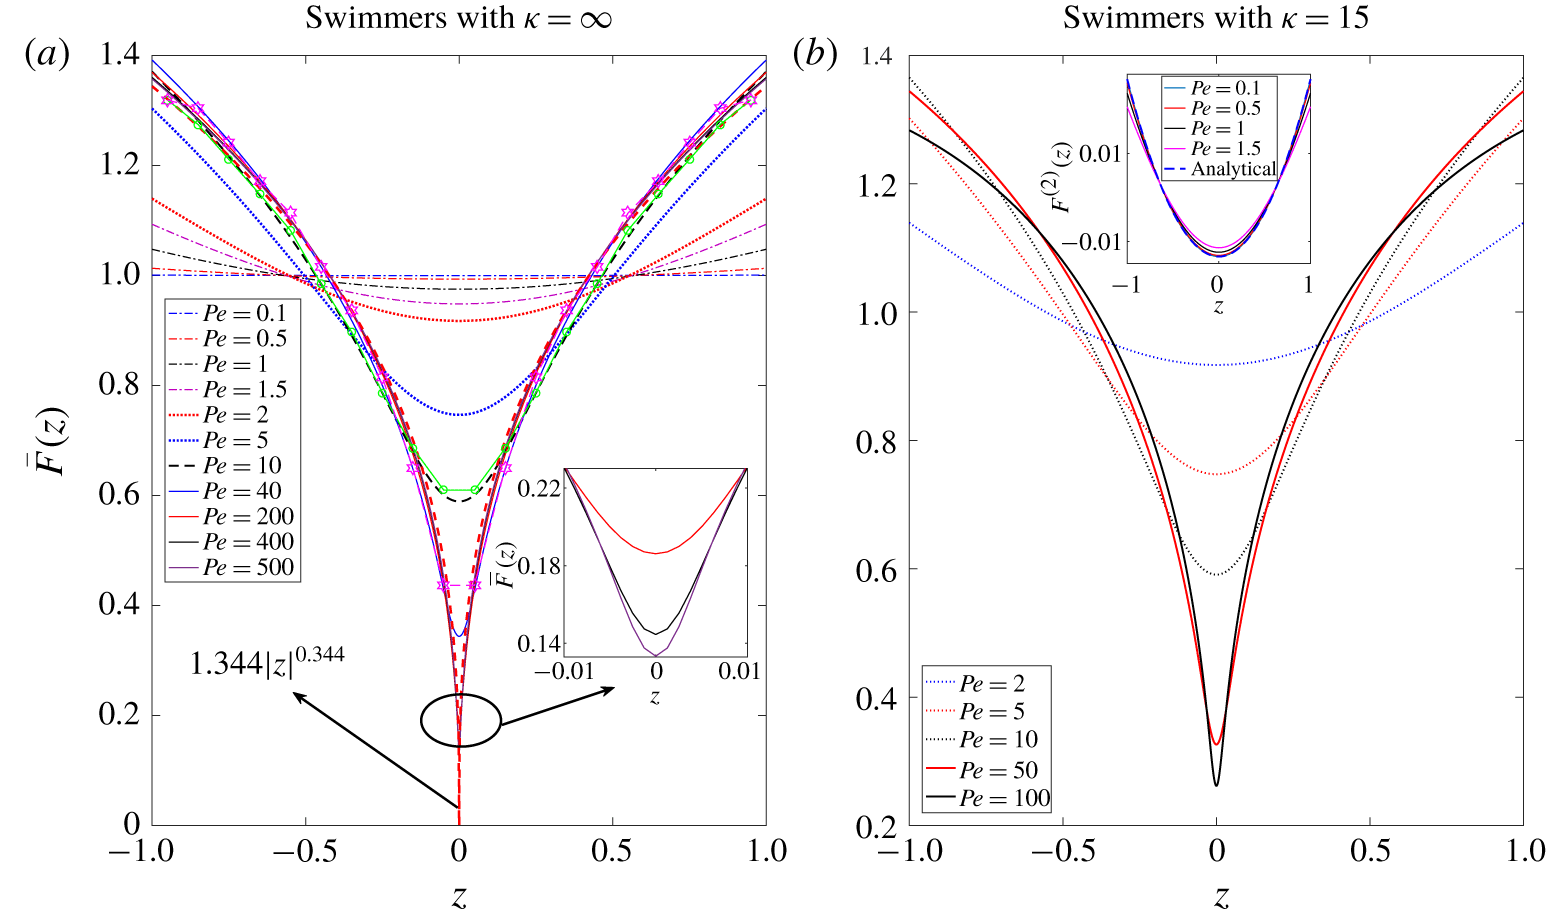
Swimmer concentration profiles for different Pe: (a)  $\unicode[STIX]{x1D705}=\infty$, (b)
 $\unicode[STIX]{x1D705}=15$. The red-dashed line in (a) denotes the
 $Pe\rightarrow \infty$ asymptote; the green colour line with circles and magenta colour line with hexagram symbols denote the simulation results for
 $Pe=10$ and 40, respectively. The inset in (a) highlights the concentration profiles, at the three largest Pe numbers, in the vicinity of the channel centreline. The inset in (b) is the comparison of the numerical profiles for
 $F^{(2)}(z)=(F-F^{(0)})/Pe^{2}$, with the parabolic depletion predicted by the small-
 $Pe$ analysis.

In figure 2, we plot the normalized steady state concentration profile [ $\bar{F}(z)=F(z,t_{2}\rightarrow \infty )/F(z,0)$], using (2.8) with
 $D_{zz}$ and
 $V_{z}$ determined numerically as mentioned in § 2.1, for infinitely slender swimmers (
 $\unicode[STIX]{x1D705}=\infty$), and for
 $\unicode[STIX]{x1D705}=15$, over a range of
 $Pe$. Also shown are the profiles obtained from Langevin simulations, for
 $\unicode[STIX]{x1D705}=\infty$, for
 $Pe=10$ and 40, which are in good agreement with the predictions of the multiple scale analysis. All profiles exhibit near-centre depletion caused by wallward migration of swimmers. For small
 $Pe$, a power series expansion of the swimmer probability density in
 $Pe$, of the form
 $F(z)=F^{(0)}+Pe^{2}F^{(2)}(z)+\cdots \,$, yields a parabolic depletion profile at
 $O(Pe^{2})$, the quadratic scaling being consistent with invariance to flow reversal (see appendix B). As shown in the inset of figure 2(b), for
 $\unicode[STIX]{x1D705}=15$ and
 $Pe\leqslant 0.5$, the numerical profile for
 $F^{(2)}(z)=(F-F^{(0)})/Pe^{2}$ agrees well with the small-
 $Pe$ analytical solution. With increasing
 $Pe$, there is a qualitative change in the shape of the concentration profiles (the profile curvature changing sign as one moves from the centreline towards the walls), and for
 $\unicode[STIX]{x1D705}=\infty$, the profiles appear to asymptote to a singular cusped profile in the limit
 $Pe\rightarrow \infty$ (see figure 2a). The mechanism underlying near-centre depletion is readily explained. For small
 $\unicode[STIX]{x1D716}$, the swimmer orientation distribution rapidly attains a
 $Pe$-dependent equilibrium at each
 $z$, with the peak of this distribution aligning with the flow direction with increasing
 $Pe$. Since the local Péclet number,
 $Pe_{z}$, increases away from the centreline (where
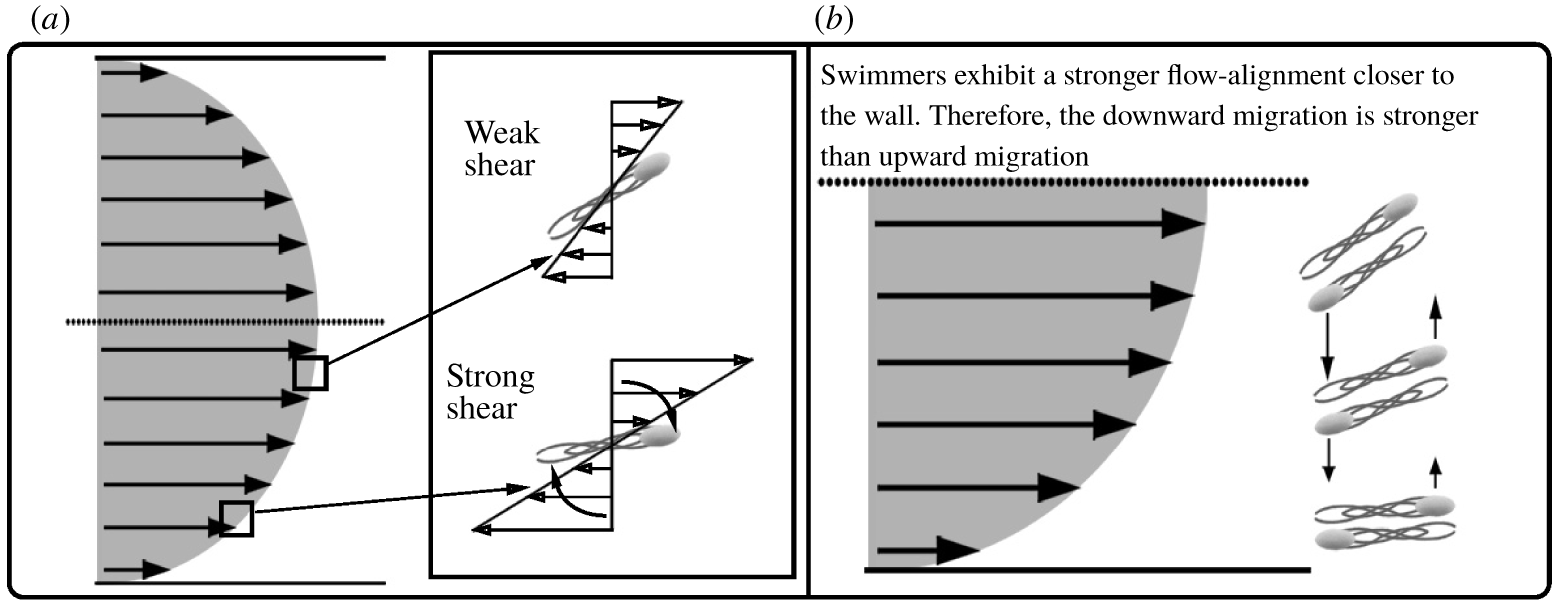
 $Pe_{z}=0$) as shown in figure 3(a,b), swimmers are, on average, more flow-aligned near the walls. The resulting reduction in the gradient component of the swimming velocity leads to a net wallward migration, eventually leading to an inhomogeneous steady state where this migration is balanced by an opposing diffusive flux.
A schematic highlighting the physical mechanism underlying the wallward migration in the high-shear trapping regime.

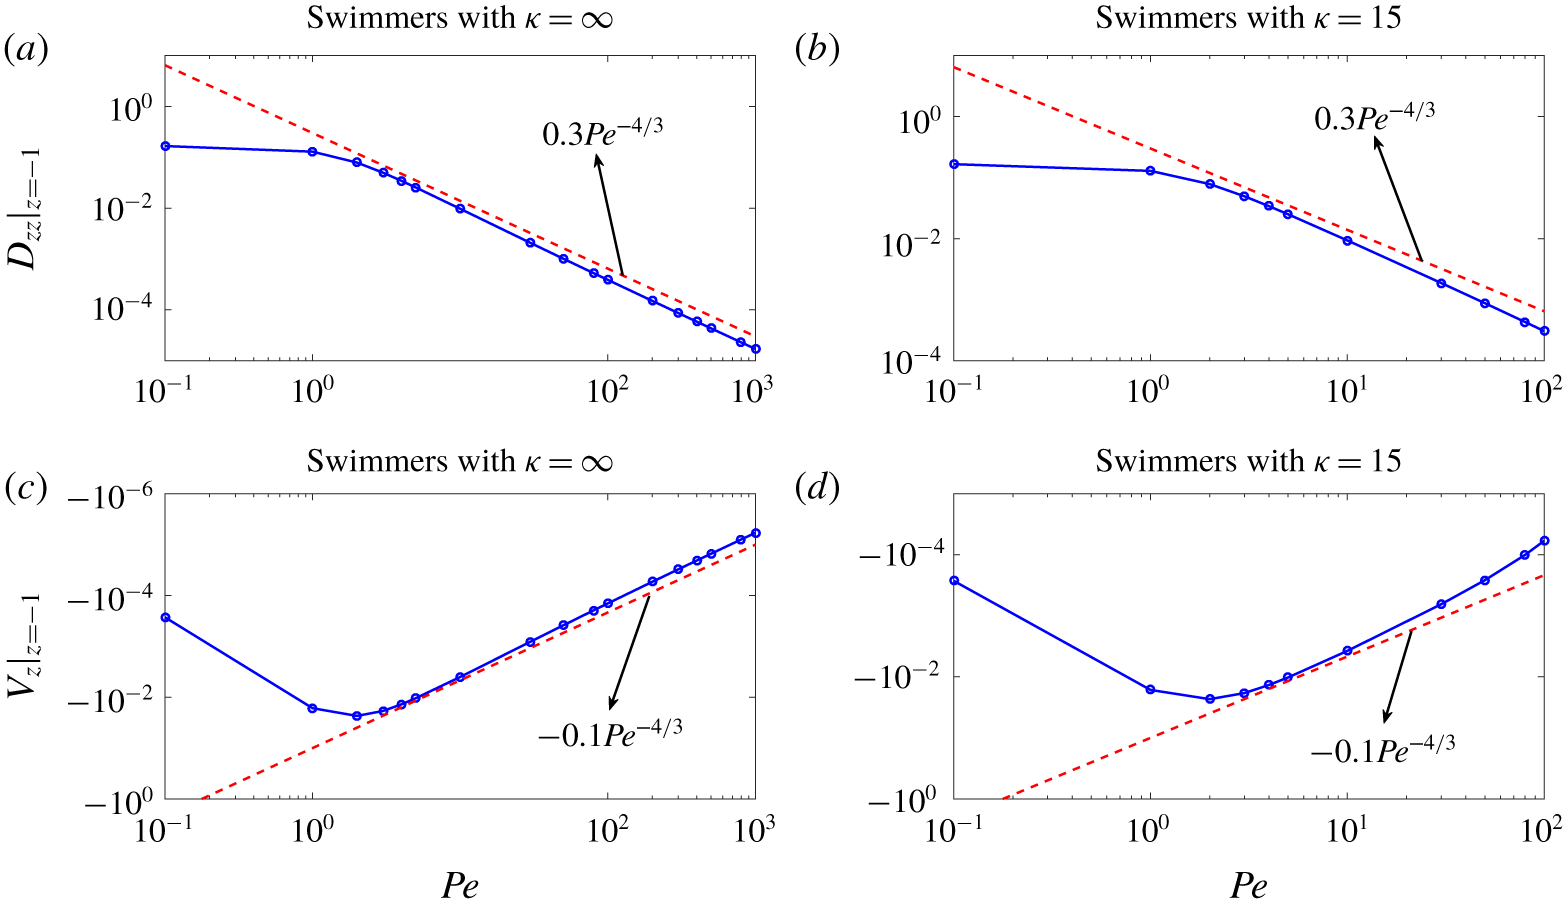
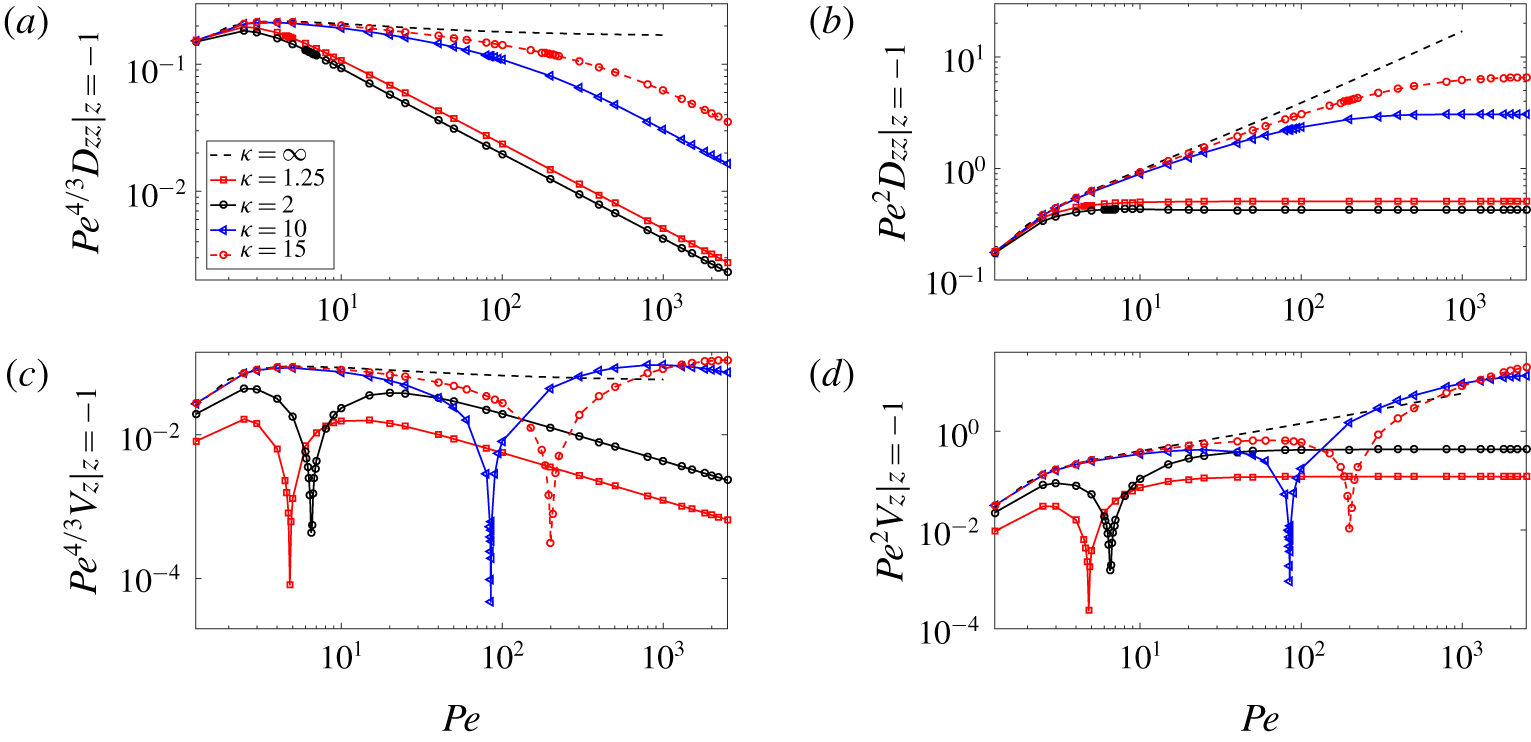
The swimmer diffusivity at the wall  $D_{zz}|_{z=-1}$, as a function of
 $Pe$, for swimmers with
 $\unicode[STIX]{x1D705}=\infty$ (a),
 $\unicode[STIX]{x1D705}=15$ (b). The variation of swimmer drift at the wall
 $V_{z}|_{z=-1}$, against
 $Pe$, for swimmers with
 $\unicode[STIX]{x1D705}=\infty$ (c),
 $\unicode[STIX]{x1D705}=15$ (d).

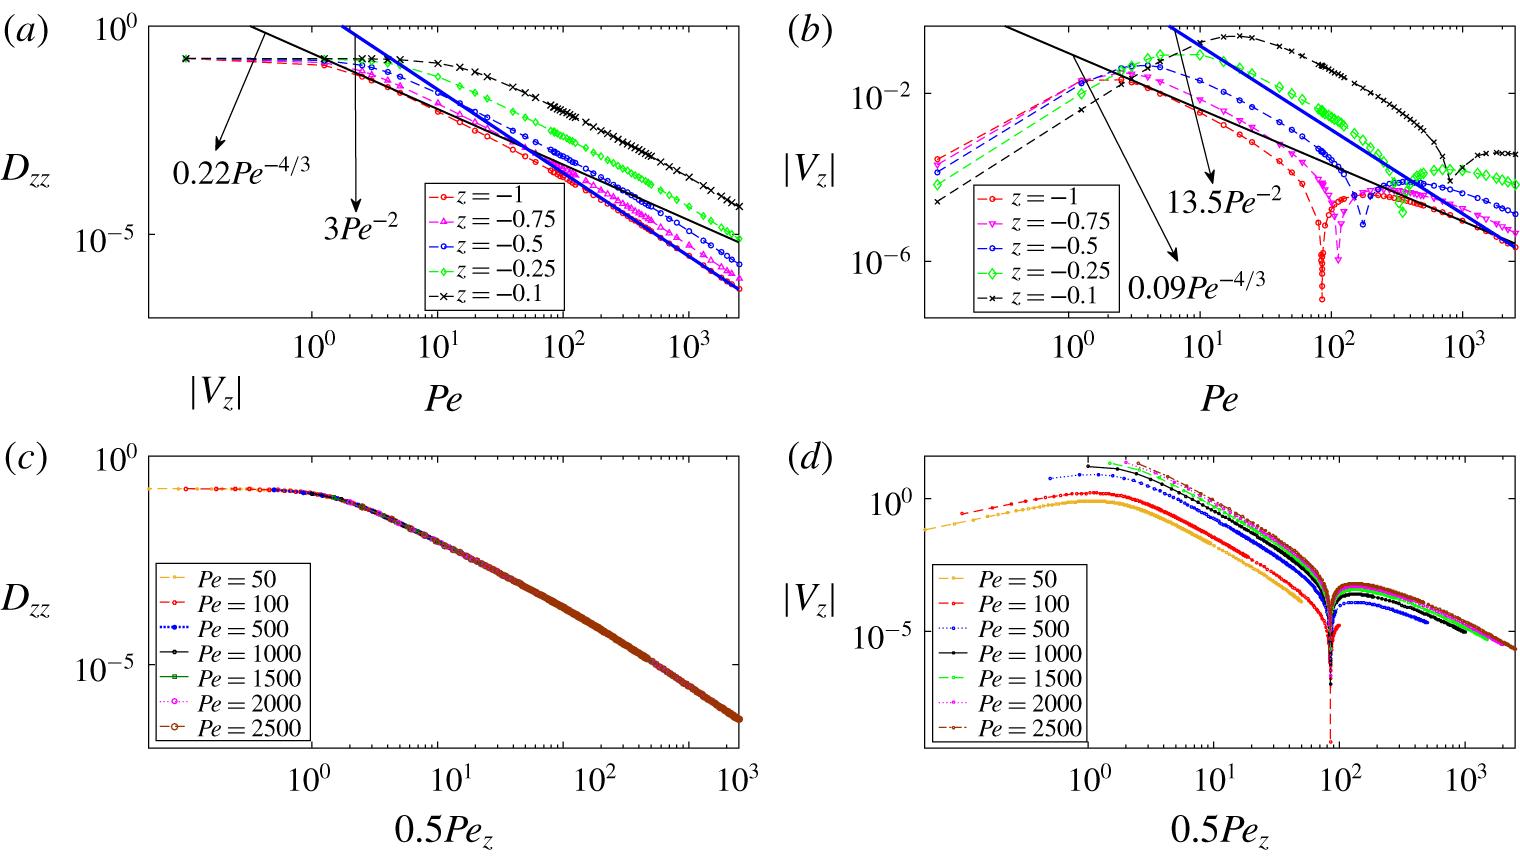
To further investigate the nature of the wallward migration, we plot, in figure 4,  $D_{zz}$ and
 $V_{z}$ at the channel wall as a function of Pe for
 $\unicode[STIX]{x1D705}=\infty$ and 15. For
 $\unicode[STIX]{x1D705}=\infty$, both
 $D_{zz}$ and
 $V_{z}$, for any non-zero
 $z$, scale as
 $Pe^{-4/3}$ for
 $Pe\gg 1$; being determined by
 $Pe_{z}$, the onset of this asymptotic scaling regime is postponed to a progressively larger
 $Pe$ with decreasing
 $z$ (not shown). For
 $\unicode[STIX]{x1D705}=15$ too, there is an intermediate range of
 $Pe$ values (
 ${\sim}$ 3 to a little greater than 10) where the aforementioned scaling holds, but there is a deviation at larger
 $Pe$ values. As will be seen in § 3.2, this deviation is a signature of the impending low-shear trapping regime. The observed scalings may be rationalized by noting that
 $D_{zz}\sim U_{sz}^{2}t_{c}$, where
 $U_{sz}\sim O(U_{s}Pe^{-1/3})$ is the swimming speed, projected along the gradient direction, of a swimmer in the large-
 $Pe$ orientation boundary layer, with an angular extent of
 $O(Pe^{-1/3})$, that forms around the flow direction (Hinch & Leal Reference Hinch and Leal1972a; Brenner Reference Brenner1974);
 $t_{c}\sim \langle \unicode[STIX]{x1D703}^{2}\rangle /D_{r}\sim Pe^{-2/3}/D_{r}$ is the time over which rotary diffusion causes the swimmer orientation to fluctuate across the flow axis, leading to a de-correlation in its gradient-directed motion. The scaling for
 $V_{z}$ may be obtained by from arguments based on a gradient-directed biased random walk. One may write
 $V_{z}=\unicode[STIX]{x0394}z_{+}f_{+}-\unicode[STIX]{x0394}z_{-}f_{-}$, where
 $\unicode[STIX]{x0394}z_{+}$,
 $\unicode[STIX]{x0394}z_{-}$ represent the random walk jumps with frequencies
 $f_{+}$,
 $f_{-}$ along the positive and negative gradient directions, respectively. Expressing the random walk jumps as the ratio of swimming velocity in that direction to the associated frequency, one has
 $V_{z}=U_{sz}(z)-U_{sz}(z+\unicode[STIX]{x0394}z^{\prime })=U_{s}(Pe_{z}^{-1/3}-Pe_{z+\unicode[STIX]{x0394}z^{\prime }}^{-1/3})$, where
 $\unicode[STIX]{x0394}z^{\prime }$ is the (dimensionless) gradient projection of the swimmer mean free path. With a swimming velocity of
 $O(U_{s}Pe_{z}^{-1/3})$ and a decorrelation time of
 $O(Pe_{z}^{-2/3}D_{r}^{-1})$, one obtains
 $\unicode[STIX]{x0394}z^{\prime }=U_{s}H^{-1}Pe_{z}^{-1}D_{r}^{-1}$. Using this leads to
 $V_{z}\sim O(U_{s}^{2}Pe_{z}^{-4/3}H^{-1}D_{r}^{-1}/z)$.
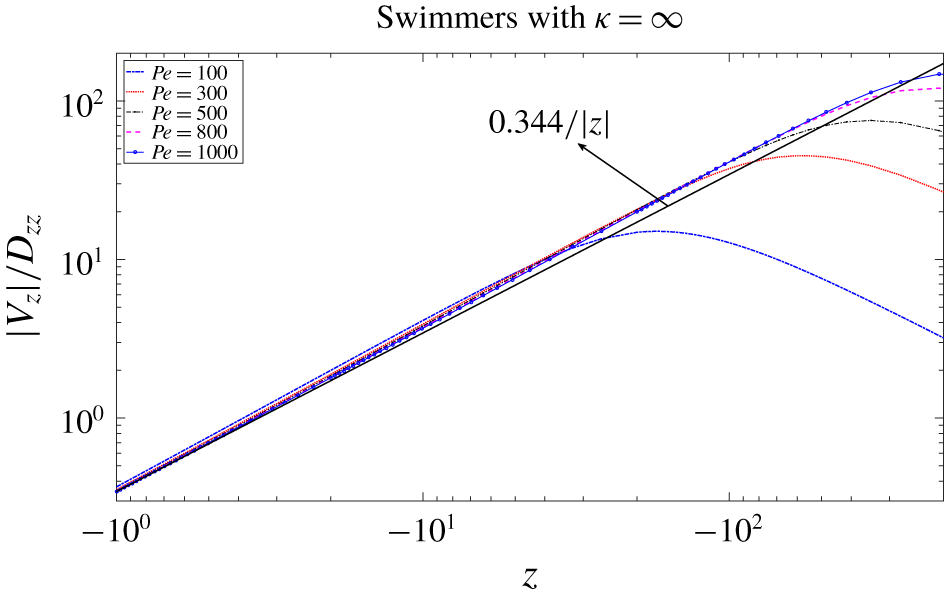
Comparison of  $|V_{z}|/D_{zz}$ against
 $z$, at different
 $Pe$ values for swimmers with
 $\unicode[STIX]{x1D705}=\infty$. The black-solid line represents the large
 $Pe$ asymptotic profile of
 $|V_{z}|/D_{zz}$.

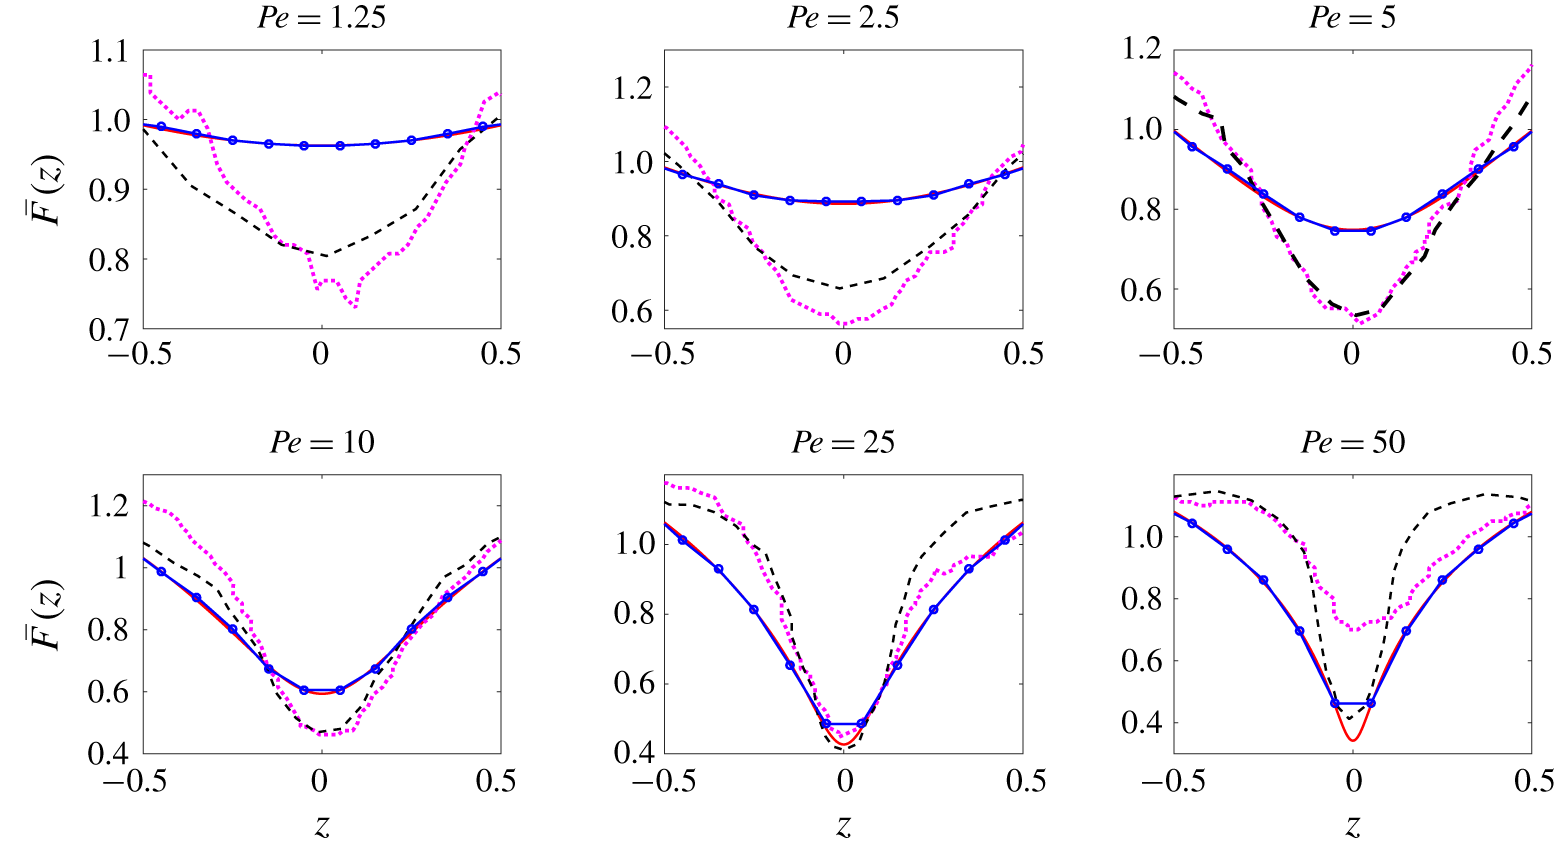
Comparison of normalized concentration profiles: our theory (red line), Langevin simulation (blue line with circles) with the experiments (dotted line in magenta colour) and simulations (black-dashed line) of Rusconi et al. (Reference Rusconi, Guasto and Stocker2014b); $\unicode[STIX]{x1D705}=10$.

The identical  $Pe$-scalings of the drift and diffusivity above imply that the ratio
 $V_{z}/D_{zz}$ is independent of
 $Pe$ for large
 $Pe$, and hence, so is the concentration profile. We find
 $V_{z}/D_{zz}\propto 1/z$, consistent with the scaling arguments above, with a constant of proportionality (
 $C$) of order unity. This leads to a large-
 $Pe$ functional form of the concentration profile given by
 $\bar{F}=(1+C)|z|^{C}$. In figure 5, for
 $\unicode[STIX]{x1D705}=\infty$, we compare the variation of
 $|V_{z}|/D_{zz}$ against
 $z$, for different
 $Pe$. A fit to the large-
 $Pe$ variation away from the centreline leads to
 $C=0.344$. From figure 2(a), the swimmer concentration profiles are seen to approach the above
 $Pe$-independent limiting form for
 $Pe\geqslant 40$. Although, the steady state profile is
 $Pe$-independent, the time taken to attain steady state is of
 $O((H^{2}D_{r}/U_{s}^{2})Pe^{4/3})$ and diverges for
 $Pe\rightarrow \infty$. The limiting concentration profile is singular with a cusp at the centreline (
 $z=0$). The cusp is, of course, an artefact of the
 $Pe=\infty$ limit. For any finite
 $Pe$, the multiple scale analysis breaks down in an asymptotically small interval of
 $O(U_{s}/D_{r})$ in the vicinity of the centreline (keeping in mind our interpretation of
 $\unicode[STIX]{x1D716}$ as a swimmer Knudsen number, this layer in the vicinity of the centreline, where ballistic swimmer trajectories play an important role, may be termed a Knudsen layer in traditional kinetic theory parlance). Note that both the swimmer orientation distribution and concentration in this Knudsen layer may be influenced by the bound trajectories observed for deterministic swimmers observed in Zöttl & Stark (Reference Zöttl and Stark2013).
In figure 6, we compare our theoretical and simulation results (which are in mutual agreement regardless of  $Pe$) with those reported in Rusconi et al. (Reference Rusconi, Guasto and Stocker2014b) for
 $\unicode[STIX]{x1D705}=10$. For the three smallest
 $Pe$ values (1.25, 2.5 and 5), our theory underpredicts the inhomogeneity compared to the experiments. There is improved agreement at
 $Pe=10$, and again, at the highest
 $Pe$ values (25 and 50), the disagreement with the experiments widens. The disagreement at the two highest
 $Pe$ values, we believe, is because the experiments (Rusconi et al. Reference Rusconi, Guasto and Stocker2014b) sampled under-developed concentration profiles. The channel length available for development of the concentration profile corresponds to a single arm of the serpentine tube used in the experiments, and is approximately 5 cm (note that, in light of the later experiments by Aronson and co-workers (Sokolov & Aranson Reference Sokolov and Aranson2016; Sokolov et al. Reference Sokolov, Rubio, Brady and Aranson2018), in a curvilinear geometry, it is likely that the bends of the serpentine tube significantly disrupt the concentration profile developed in the straight sections). At large
 $Pe$, the entrance length may be estimated based on the time scale for attainment of steady state mentioned above, and is
 $O(0.06\bar{u}H^{2}D_{r}Pe^{4/3}/U_{s}^{2})$. Here,
 $\bar{u}=(2\bar{\dot{\unicode[STIX]{x1D6FE}}}H/3)$ is the average suspension velocity and
 $\bar{\dot{\unicode[STIX]{x1D6FE}}}=PeD_{r}$ is the mean shear rate; the numerical pre-factor (0.06) in the above estimate is determined from the Langevin simulations. Based on this estimate, and using
 $H=212.5~\unicode[STIX]{x03BC}\text{m}$,
 $U_{s}=50~\unicode[STIX]{x03BC}\text{m}~\text{s}^{-1}$,
 $D_{r}=1~\text{s}^{-1}$ (Rusconi et al. Reference Rusconi, Guasto and Stocker2014b), the entrance length at
 $Pe=50$ is 1.4 m! For
 $Pe=10$, the entrance length is approximately 3 cm, which is smaller than the aforementioned length of a straight section. This would suggest that the measured profile at
 $Pe=10$ is indeed fully developed. The fact that our simulation results at intermediate times closely match shapes of the experimental profiles at two largest
 $Pe$ values (not shown here), reinforces the above assertion of the latter profiles not being fully developed ones. A second reason for deviation from theory could be the role of wall interactions, which are not included in the present analysis, the focus here being on bulk mechanisms for migration. Theory and simulations based on image-induced hydrodynamic interactions of pusher-type swimmers, and experiments on smooth swimming bacterial strains have shown swimmer accumulation at the boundaries in the absence of an imposed flow (Berke et al. Reference Berke, Turner, Berg and Lauga2008; Lauga & Powers Reference Lauga and Powers2009; Chilukuri et al. Reference Chilukuri, Collins and Underhill2014). Wall accumulation in boundary layers with polar orientational order arises even in the absence of hydrodynamic interactions (Elgeti & Gompper Reference Elgeti and Gompper2009, Reference Elgeti and Gompper2016). This mechanism is expected to prevail in relatively confined geometries, and for modest
 $Pe$, owing to its reliance on polar order (the multiple scale analysis here predicts the polar order to be
 $O(\unicode[STIX]{x1D716})$ smaller than the nematic order associated with the leading-order orientation distribution
 $G(\,\boldsymbol{p})$). In the present context, we expect the hydrodynamic wall accumulation to only have a minor influence for the following reasons. First, the time scale
 $t_{w}\sim$
 $O(L/U_{s})$, over which the wall interaction is significant, is comparable to the time scale for orientation decorrelation of
 $O(D_{r}^{-1})$ for wild-type swimmers under consideration, and the latter acts to disrupt any hydrodynamically induced accumulation for small
 $Pe$; in contrast, for the smooth swimmers used in Berke et al. (Reference Berke, Turner, Berg and Lauga2008), the decorrelation time scale given by
 $O(D_{r-Brownian}^{-1})$, was greater by at least two orders of magnitude. At large
 $Pe$, rotary diffusion induced decorrelation is weak, and one then has a sustained image-induced interaction between nearly flow-aligned swimmers. Wall interactions, even in this case, are expected to only induce a concentration enhancement within a region of
 $O(L)$ from the walls. Using Brownian dynamics simulations for a confined channel geometry, with hydrodynamic interactions between the swimmers and wall included, Chilukuri et al. (Reference Chilukuri, Collins and Underhill2014) showed that wall accumulation is indeed localized to the immediate vicinity of boundaries, consistent with the above arguments, and that this accumulation is further suppressed when the swimmers are subject to a pressure driven channel flow. Given that the observations of Rusconi et al. (Reference Rusconi, Guasto and Stocker2014b) and Barry et al. (Reference Barry, Rusconi, Guasto and Stocker2015) were in the central portion of the channel, one expects the swimmer concentration to remain largely unaffected by wall interactions.
The disparity at the smallest  $Pe$ values, pointed out above, could be due to multiple reasons. First is the possibility of the assumption
 $\unicode[STIX]{x1D716}\ll 1$, underlying the multiple scale analysis, breaking down. Based on the microchannel geometry and the known mean free path for B. subtilis (estimated from the decorrelation time that is in turn inferred from the measured translational diffusivities),
 $\unicode[STIX]{x1D716}\approx 0.23$ in the experiments of Rusconi et al. (Reference Rusconi, Guasto and Stocker2014b). Our simulations, which are not limited by the small
 $\unicode[STIX]{x1D716}$ assumption, agree well with theory even for
 $\unicode[STIX]{x1D716}=0.2$, ruling out the lack of smallness of the swimmer Knudsen number as a cause of theory–experiment incongruity. Note that the issue of
 $\unicode[STIX]{x1D716}$ not being small enough is not relevant to the largest
 $Pe$ values since the stronger flow alignment of the swimmers with the unaltered decorrelation time implies that the projection of the mean free path in the cross-stream direction shrinks with increasing
 $Pe$, increasing the range of validity of the multiple scale analysis. For the high-shear trapping regime considered in this section, the effective Knudsen number is
 $\unicode[STIX]{x1D716}_{eff}=\unicode[STIX]{x1D716}Pe^{-1/3}$, the exponent reflecting the degree of swimmer alignment in the orientation boundary layer; for low-shear trapping examined next,
 $\unicode[STIX]{x1D716}_{eff}=\unicode[STIX]{x1D716}Pe^{-1}$ for large
 $Pe$, being even smaller. Next, it is also possible that the particular choice of the swimming mechanism determines the detailed concentration profile; for instance, there might be a significant difference between the degree of inhomogeneity in the swimmer concentration between RTPs and ABPs. As explained in the introduction, the former involves the swimmer undergoing a sudden large change in its orientation during tumbles (Berg Reference Berg1993, Reference Berg2008), while the latter involves continuous small amplitude fluctuations in their orientation. Our Langevin simulations do suggest a greater inhomogeneity for RTPs than ABPs at the smallest
 $Pe$ values, with this difference diminishing in magnitude with increasing
 $Pe$. Thus, the difference between the swimming mechanism of B. subtilis, relative to the pure ABP dynamics assumed in the theoretical framework here, may cause the discrepancy between experiment and theory at the smallest
 $Pe$ values (the Rusconi et al. (Reference Rusconi, Guasto and Stocker2014b) experiments only measured the translation diffusivities, and do not therefore have detailed information with regard to the relative importance of tumbling vis-a-vis rotary diffusion). The sensitivity of the shear induced migration pattern to the swimming mechanism does deserve a more detailed study, and this will be reported in a future effort.
3.2 Swimmer migration towards the channel centreline – low-shear trapping
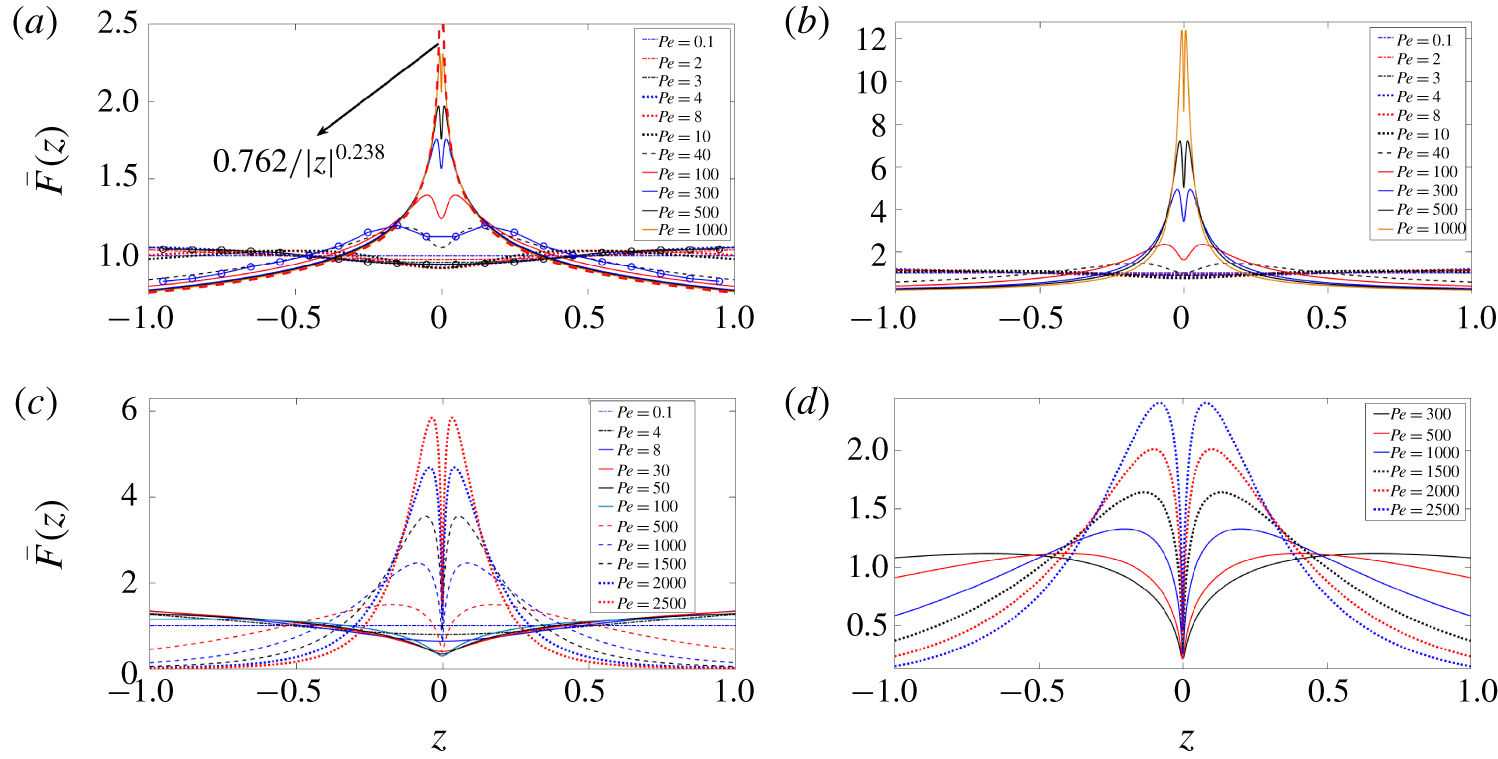
Figure 7 shows the  $Pe$-dependent swimmer concentration profiles for a range of swimmer aspect ratios, including the case
 $\unicode[STIX]{x1D705}=15$ examined earlier (now over a larger range in
 $Pe$ extending up to 2500). For small to intermediate
 $Pe$, one observes high-shear trapping regardless of
 $\unicode[STIX]{x1D705}$, consistent with the results of the small-
 $Pe$ analysis, and, as seen before, the corresponding concentration profiles exhibit a single minimum at the centreline. At large
 $Pe$, however, there is a qualitative change with the concentration profiles now exhibiting a pair of maxima symmetrically disposed about the centreline; the maxima increase in amplitude, while converging towards the centreline with increasing
 $Pe$ (consistent with the earlier finite element computations of Bearon & Hazel (Reference Bearon and Hazel2015)). The aforementioned transition occurs across a
 $\unicode[STIX]{x1D705}$-dependent threshold
 $Pe$. The Langevin simulations reinforce the existence of the transition in the concentration profiles; as shown in figure 7(a), the profile at
 $Pe=4$ exhibits a depletion of swimmers near the centreline, and the one at
 $Pe=40$ exhibits a near-centre excess.
Swimmer concentration profiles as a function of  $Pe$ for different aspect ratios: (a)
 $\unicode[STIX]{x1D705}=1.25$, (b) 2, (c) 10, (d) 15. In (a), the red-dashed line is the large
 $Pe$ limiting profile, the solid-black and blue lines with circles represent the concentration profiles obtained from the Langevin simulations for
 $Pe=4$ and 40, respectively.

The variation of (a,b) the diffusivity ( $D_{zz}$) and (c,d) the absolute drift velocity (
 $|V_{z}|$) at the channel wall, as a function of
 $Pe$, for swimmers with different aspect ratios. Here, the
 $Pe^{4/3}$ and
 $Pe^{2}$ pre-factors, used to rescale
 $D_{zz}$ and
 $V_{z}$, are motivated by the scalings in the high-shear (
 $Pe^{-4/3}$) and low-shear (
 $Pe^{-2}$) trapping regimes.

The variation of (a)  $D_{zz}$ and (b)
 $|V_{z}|$ against
 $Pe$ for swimmers with
 $\unicode[STIX]{x1D705}=10$, at different locations across the channel. The black (thin) and blue (thick) lines in (a) and (b), represent the scalings of
 $D_{zz}$ and
 $|V_{z}|$ in the high-shear (
 $Pe^{-4/3}$) and low-shear (
 $Pe^{-2}$) trapping regimes, respectively. The variation of (c)
 $D_{zz}$ and (d)
 $|V_{z}|$ for
 $\unicode[STIX]{x1D705}=10$ against
 $0.5Pe_{z}$, for different
 $Pe$; here, the factor 0.5 in front of
 $Pe_{z}$ is to ensure that
 $0.5Pe_{z}$ at the boundary is equal to
 $Pe$.

To understand the transition from high-shear to low-shear trapping with increasing  $Pe$, in figure 8, we plot
 $D_{zz}|_{z=-1}$ and
 $|V_{z}|_{z=-1}$, each of them scaled with
 $Pe^{-4/3}$ and
 $Pe^{-2}$, against
 $Pe$ for
 $\unicode[STIX]{x1D705}=\infty$ and for the
 $\unicode[STIX]{x1D705}$ values in figure 7. From figure 8(c,d),
 $V_{z}$ is seen to undergo a change in sign with increasing
 $Pe$ (the associated zero-crossing appears as a sharp dip in the log–log plots), which is responsible for the reversal in migration. For
 $Pe$ values smaller than that corresponding to the zero-crossing (of
 $V_{z}$), swimmers migrate towards the walls; for larger
 $Pe$ values, swimmers migrate towards the centreline, leading to a low-shear trapping behaviour. It is important to note that the reversal in migration is actually a function of
 $Pe_{z}$, occurring for
 $Pe_{z}$ exceeding a
 $\unicode[STIX]{x1D705}$-dependent threshold. This is confirmed in figure 9, where the plots of the diffusivity and drift against
 $Pe$ for
 $\unicode[STIX]{x1D705}=10$, at different transverse locations (
 $z$), confirm the onset of the asymptotic
 $O(Pe^{-2})$ scaling regime at progressively larger
 $Pe$ for
 $z$ approaching the centreline (figure 9a,b). The reversal in drift is also delayed at locations closer to the channel centreline, with the earliest reversal occurring at the walls (the one shown in figure 9b). To further confirm the role of
 $Pe_{z}$ (rather than
 $Pe$), in figure 9(c,d),
 $D_{zz}$ and
 $V_{z}$ are plotted as a function of
 $Pe_{z}$. This collapses the different
 $D_{zz}$ curves into a single one, and also collapses the zero-crossings of the different
 $V_{z}$ curves onto a single location corresponding to a critical
 $Pe_{z}$. Since
 $Pe_{z}$ always becomes arbitrarily small close enough to the centreline, there is always a region close to the centreline, regardless of
 $Pe$, where swimmers continue to exhibit a wallward migration. This leads to the non-monotonicity, with a pair of maxima bracketing a central dip in the concentration profiles shown in figure 7; thus, the central portions of all the profiles in figure 7, corresponding to low-shear trapping, still resemble the depletion profiles seen earlier is § 3.1. It is only the limiting excess profile, for
 $Pe=\infty$, where swimmers migrate towards the centreline regardless of
 $z$ (this singular profile is subject to the limitations of the multiple scale analysis mentioned earlier in § 3.1). As evident from figure 8, for any finite
 $\unicode[STIX]{x1D705}$, both
 $D_{zz}$ and
 $V_{z}$ exhibit an
 $O(Pe^{-2})$ scaling in the low-shear trapping regime that emerges for sufficiently large
 $Pe$, although for the larger values of
 $\unicode[STIX]{x1D705}$ (10 and 15), there is the emergence of an intermediate scaling regime (evident from figure 8a,c) where
 $D_{zz},V_{z}\sim Pe^{-4/3}$, already seen in § 3.1. Thus,
 $\unicode[STIX]{x1D705}=\infty$ is the only case where the
 $O(Pe^{-4/3})$ scaling regime persists in the limit
 $Pe\rightarrow \infty$, as indicated by the black-dashed lines in figure 8. Infinitely slender swimmers therefore represent a singular limit with regard to shear-induced migration behaviour. Of course, for large enough
 $\unicode[STIX]{x1D705}$ values, the
 $Pe$ corresponding to the transition to low-shear trapping may be large enough as to be numerically inaccessible. This is seen to be the case in figure 8(b) for
 $\unicode[STIX]{x1D705}=15$, and in figure 8(d) for both
 $\unicode[STIX]{x1D705}=10$ and
 $\unicode[STIX]{x1D705}=15$; owing to the zero-crossing, it takes a larger
 $Pe$ for the drift to conform to the eventual
 $O(Pe^{-2})$ scaling behaviour.
From the results presented thus far, it is seen that the transition from high to low-shear trapping occurs at a threshold  $Pe$ of order unity for
 $\unicode[STIX]{x1D705}$ values of order unity. For large
 $\unicode[STIX]{x1D705}$, the cross-over
 $Pe$ is asymptotically large, and marks a transition from an
 $O(Pe^{-4/3})$ to an
 $O(Pe^{-2})$ scaling regime for the drift and diffusivity coefficients (see figure 9). From classical work on the orientation dynamics of passive anisotropic Brownian particles in a simple shear flow (Leal & Hinch Reference Leal and Hinch1971; Hinch & Leal Reference Hinch and Leal1972a; Brenner Reference Brenner1974), the former scaling regime implies the localization of the swimmer orientation distribution in an
 $O(Pe^{-1/3})$ boundary layer around the flow direction where there is a balance between the rotary diffusion and flow-induced rotation. In contrast, when flow-induced rotation along Jeffery orbits occurs on a time scale much shorter than rotary diffusion, the latter acts as a regular perturbation; there is no orientational boundary layer, and one expects a scaling regime involving an integral powers of
 $Pe^{-1}$. Thus, the aforementioned cross-over
 $Pe$ must correspond to the point where the flow-induced (Jeffery) rotation, on a time scale of
 $O(\dot{\unicode[STIX]{x1D6FE}}^{-1}\unicode[STIX]{x1D705})$ is comparable to that characterizing rotary diffusion of
 $O(D_{r}^{-1}Pe^{-2/3})$; this leads to
 $Pe_{c}\sim O(\unicode[STIX]{x1D705}^{3})$ for
 $Pe\gg 1$ (this scaling is confirmed in § 3.3.2, where we demarcate high- and low-shear trapping on the
 $Pe{-}\unicode[STIX]{x1D705}$ plane). Now, at leading order, one has purely flow-induced Jeffery rotations of the swimmer, with an orbital time period
 $t_{jeff}\sim 1/(D_{r}Pe)$. The Jeffery rotations coupled with swimming lead to a swimmer trajectory, that along the cross-stream direction, has a bounded but oscillatory character with an amplitude
 $\unicode[STIX]{x0394}z$ of
 $O(U_{s}/(D_{r}Pe))$. Rotary diffusion disrupts the exact periodicity of the leading-order trajectory, causing an occasional slip of
 $O(U_{s}/(D_{r}Pe))$. These random displacements in the
 $z$-direction, occurring over a time scale of
 $O(D_{r}^{-1})$, lead to a
 $D_{zz}\sim \langle \unicode[STIX]{x0394}z^{2}\rangle /t_{c}$ which may be written as
 $O((U_{s}^{2}/D_{r})Pe^{-2})$, confirming the scaling behaviour observed in the low-shear trapping regime; here,
 $\langle \unicode[STIX]{x0394}z^{2}\rangle$ is the mean square displacement of the swimmer in the gradient direction. Note that, for large
 $\unicode[STIX]{x1D705}$, swimmers spend an
 $O(\unicode[STIX]{x1D705}/(D_{r}Pe))$ time remaining nearly aligned with the flow axis at an angle of
 $O(\unicode[STIX]{x1D705}^{-1})$. This leads to the same estimate for
 $\unicode[STIX]{x0394}z$ as above, but a faster decorrelation rate of
 $O(\unicode[STIX]{x1D705}^{2}D_{r})$ (since rotary diffusion only has to induce an angular displacement of
 $O(\unicode[STIX]{x1D705}^{-1})$), leading to a scaling for
 $D_{zz}$ of
 $O((U_{s}^{2}\unicode[STIX]{x1D705}^{2}/D_{r})Pe^{-2})$. Based on the biased random walk argument as mentioned in § 3.1, we can express
 $V_{z}=U_{sz}(z)-U_{sz}(z+\unicode[STIX]{x0394}z^{\prime })$. Now, for swimmers with
 $\unicode[STIX]{x1D705}$ of
 $O(1)$, using
 $U_{sz}(z)=U_{s}Pe_{z}^{-1}$, we obtain
 $V_{z}\sim$
 $O((U_{s}^{2}H^{-1}D_{r}^{-1}/z)Pe_{z}^{-2})$. The drift and diffusivity scalings above are broadly consistent with those obtained in figure 8(b).
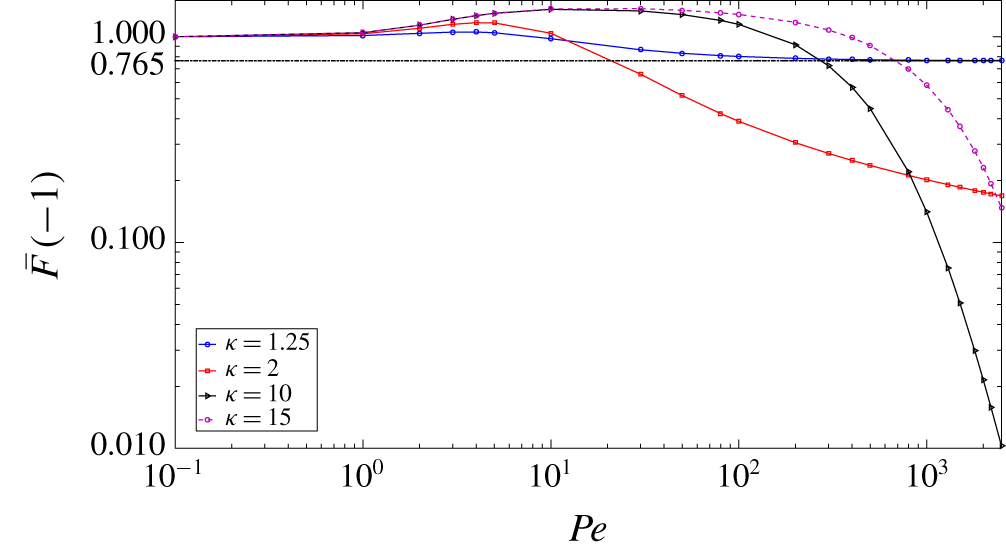
Variation of swimmer concentration at the wall ( $\bar{F}(-1)$) against
 $Pe$ for swimmers with different aspect ratios.

For large  $Pe$, similar to the high-shear trapping case,
 $V_{z}$ and
 $D_{zz}$ exhibit the same
 $O(Pe^{-2})$ scaling, their ratio being independent of
 $Pe$ and of the form
 $C(\unicode[STIX]{x1D705})/z$, where
 $C$ is now a function of
 $\unicode[STIX]{x1D705}$. One therefore expects a limiting
 $Pe$-independent profile of the form
 $(C+1)|z|^{C}$; note that, for any finite
 $Pe$, the actual profiles break away from this limiting profile in the vicinity of the centreline. The actual profiles exhibit a dip in this region, corresponding to the onset of depletion (wallward migration) at small
 $Pe_{z}$. Since
 $C(\unicode[STIX]{x1D705})<0$ for low-shear trapping (owing to the sign reversal of the drift), this limiting profile has a diverging concentration at the centreline. For
 $\unicode[STIX]{x1D705}=1.25$,
 $C(\unicode[STIX]{x1D705})\sim -0.238$, and the associated limiting profile compares well to the numerically computed ones in figure 7(a). An interesting consequence of the change in sign of
 $C(\unicode[STIX]{x1D705})$, leading to low-shear trapping, is that the aforementioned limiting profile fails to be integrable for
 $C(\unicode[STIX]{x1D705})\leqslant -1$ (this was not an issue in the high-shear trapping case, since the swimmer concentration in all profiles, including the one corresponding to
 $Pe=\infty$, is bounded below by zero). We find
 $C(\unicode[STIX]{x1D705})$ to equal this threshold value (
 $-1$) for
 $\unicode[STIX]{x1D705}\approx 2$, and decrease further for larger
 $\unicode[STIX]{x1D705}$. The implication of the non-integrability above is that, for
 $\unicode[STIX]{x1D705}\geqslant 2$, the swimmer concentration profiles must exhibit a ‘centreline collapse’ in the limit
 $Pe\rightarrow \infty$; in other words,
 $\lim _{Pe\rightarrow \infty ,\unicode[STIX]{x1D705}\geqslant 2}\bar{F}(z)=\unicode[STIX]{x1D6FF}(z)$. Figure 10 shows the variation of swimmer concentration at the wall
 $(\bar{F}(-1))$ against
 $Pe$ for the aspect ratios considered in figure 7. For
 $\unicode[STIX]{x1D705}=1.25$, the near-wall swimmer concentration approaches a finite limiting value
 $(\lim _{Pe\rightarrow \infty ,\unicode[STIX]{x1D705}=1.25}\bar{F}(-1)=0.765)$. For
 $\unicode[STIX]{x1D705}\geqslant 2$, however, the near-wall swimmer concentration decreases monotonically to zero for
 $Pe\rightarrow \infty$, in accordance with the centreline collapse hypothesized above. The slope characterizing this decrease appears to increase with increasing
 $\unicode[STIX]{x1D705}$, implying that the collapse increases in intensity for larger
 $\unicode[STIX]{x1D705}$ (for
 $\unicode[STIX]{x1D705}=15$, the numerics have not accessed the asymptotic regime yet). The
 $\unicode[STIX]{x1D705}$-dependence of the collapse does suggest that the drift and diffusivity coefficients must scale differently with
 $\unicode[STIX]{x1D705}$ for
 $\unicode[STIX]{x1D705}\gg 1$. Scaling arguments presented above suggested that
 $D_{zz}\sim O(\unicode[STIX]{x1D705}^{2}Pe^{-2})$ in the low-shear trapping regime, and the large
 $-\unicode[STIX]{x1D705}$ scaling of the drift must therefore differ from
 $O(\unicode[STIX]{x1D705}^{2}Pe_{z}^{-2}/z)$ that would emerge from the biased random walk scaling above modified for
 $\unicode[STIX]{x1D705}\gg 1$. The large-
 $\unicode[STIX]{x1D705}$ scaling of the drift in this regime will be analysed in detail in a future effort.
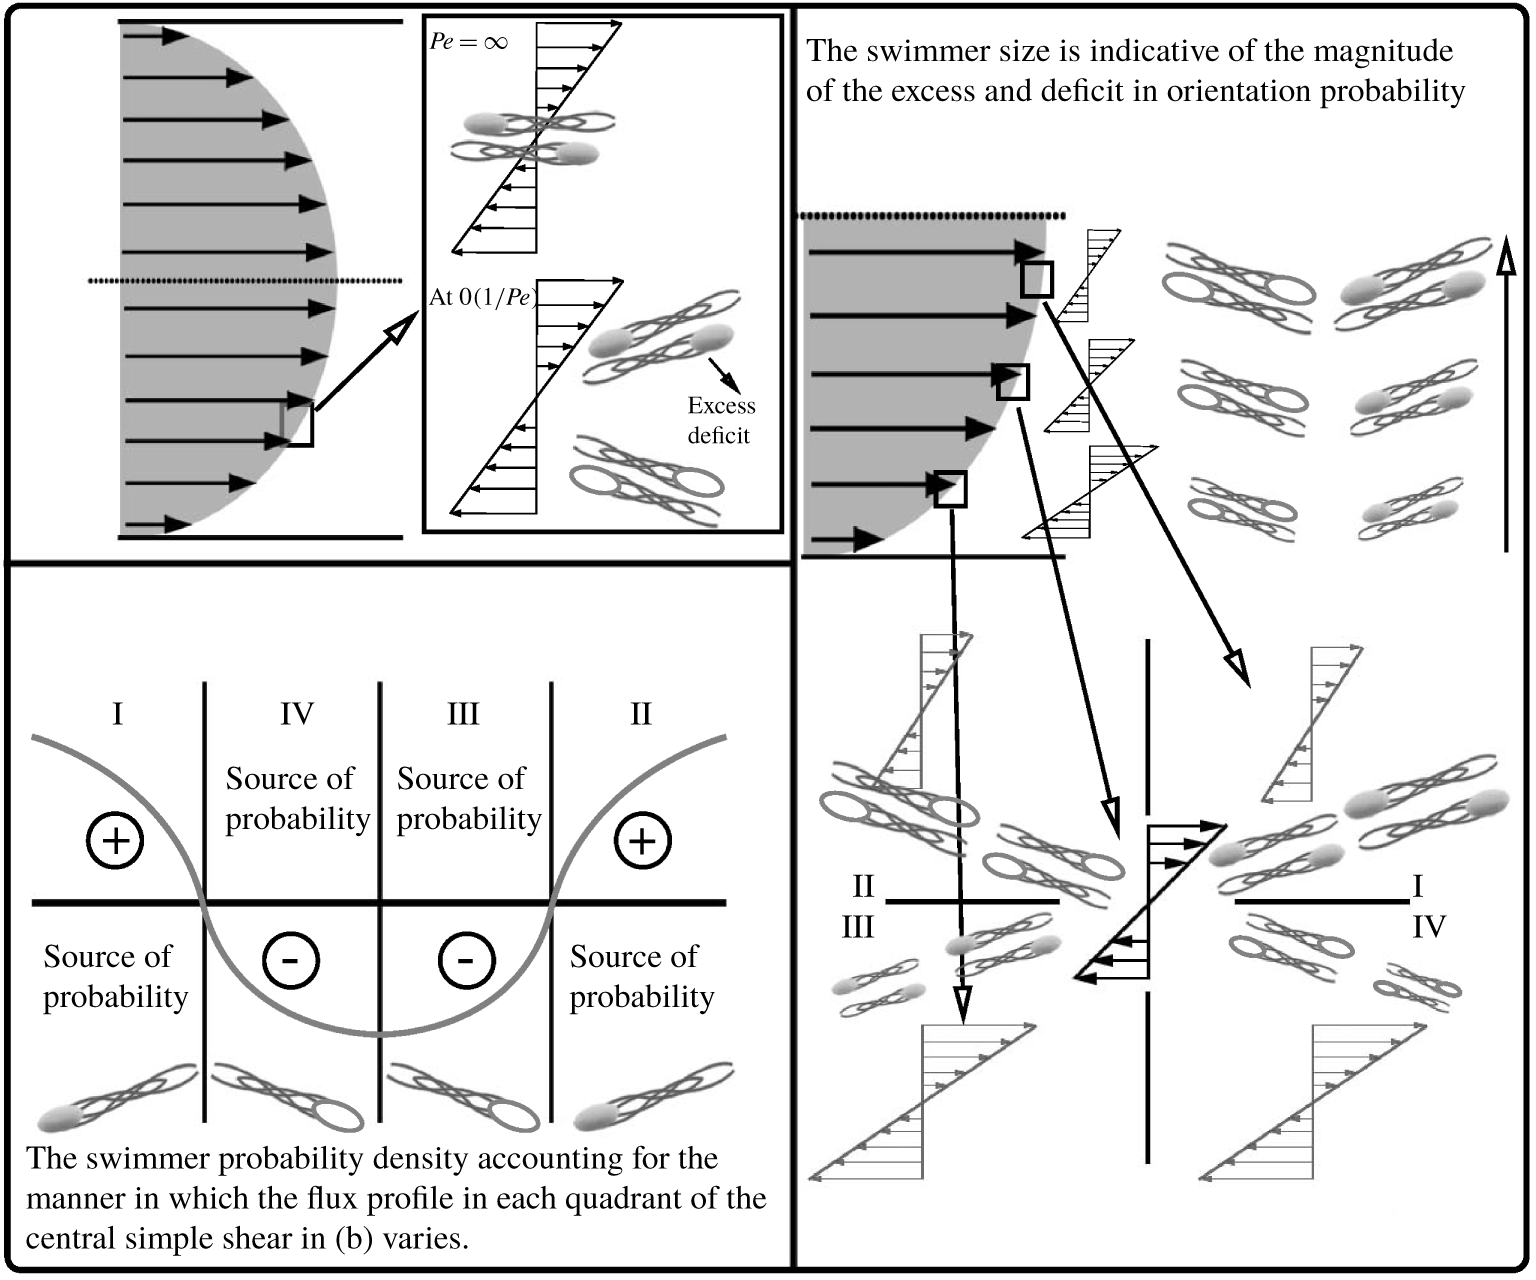
A schematic highlighting the physical mechanism underlying the low-shear trapping regime. The solid-headed and hollow-headed swimmers represent the excess and deficit of swimmer (orientation) probability, respectively.

Unlike the rather intuitive picture underlying high-shear trapping (see figure 3 in § 3.1), the physical mechanism underlying low-shear trapping is more subtle. Here, we present arguments that support migration of swimmers towards the centreline at large  $Pe$, beginning from the orientation dynamics of swimmers in a local linear flow description, as shown in figure 11(a). For the parabolic flow under consideration, the local linear approximation yields a simple shear flow with a shear rate that decreases from a maximum at the wall to zero at the centreline. For any finite
 $\unicode[STIX]{x1D705}$, and sufficiently large
 $Pe$ (
 $Pe\gg 1$ for
 $\unicode[STIX]{x1D705}$ of
 $O(1)$;
 $Pe\gg \unicode[STIX]{x1D705}^{3}$ for
 $\unicode[STIX]{x1D705}\gg 1$), swimmers at any non-zero
 $z$ execute Jeffery rotations at leading order, with a time period commensurate with the
 $z$-dependent shear rate of the simple shear flow above. The resulting distribution of azimuthal angles within any Jeffery orbit is symmetrical about the flow direction (as first shown by Leal & Hinch (Reference Leal and Hinch1971), the distribution across the orbits is still controlled by asymptotically weak rotary diffusion, although this does not affect the argument for the direction of drift given below). At the next order,
 $O(1/Pe)$, rotary diffusion breaks the aforementioned symmetry, leading to an excess of orientations in the extensional quadrants, and an equal and opposite deficit in the compressional ones (this antisymmetry is a consequence of Brownian motion being a weak but regular perturbation; in the singular case, relevant to the high-shear trapping regime, almost the entire swimmer probability is confined to the extensional quadrants). The aforementioned distributions at
 $O(1)$ and
 $O(1/Pe)$ are sketched in figure 11(a). Owing to the decrease of
 $Pe_{z}$, the amplitudes of the excess and deficit above increase as one moves away from the wall. The lower figure in 11(b) contains sketches of the local simple shear flows at three different
 $z$-locations, with the local excess and deficit in orientations in accordance with the arguments above (the swimmer sizes denote the amplitude of the excess or deficit). This picture may now be used to argue, in a quadrant-wise manner, for the swimming-induced changes the orientation distribution. At any
 $z$, in quadrant I, lesser excess swims in from the stronger shear flow below, and a greater excess exits into the weaker shear flow above; in quadrant III, the exact opposite occurs. Similarly, in quadrant II (IV), a greater (lesser) deficit exits into the weaker (stronger) shear flow above (below), with a lesser (greater) deficit swimming in from the stronger (weaker) shear flow below (above), leading to a net excess (deficit) of swimmers. As a result, there is a swimming-induced source of probability in quadrants II and III, and a sink in quadrants I and IV. These sources and sinks balance the divergence of the flux of the probability density; this flux is along Jeffery orbits for large
 $Pe$, and is the Jeffery angular velocity times the probability density. The swimming-induced source causes the flux to increase through quadrants II and III, attaining a maximum along the positive gradient axis; the sink in quadrants I and IV causes a decrease thereafter, with the flux attaining a minimum along the negative gradient axis. The flux being proportional to the probability density, leads to an excess of orientations in quadrants I and II relative to quadrants III and IV. This excess probability implies a net drift into the low-shear regions. The migration towards the low-shear regions continues till the swimmers reach sufficiently close to the channel centre where
 $Pe_{z}$ eventually falls below
 $\unicode[STIX]{x1D705}^{3}$. From this location onward, and up until the centreline, the swimmers revert to a wallward migration. Therefore, the steady state concentration profile is such that it exhibits a maximum at a location intermediate between the centreline and the wall, with this location shifting towards the centreline with increasing
 $Pe$.
3.3 Depletion index and the  $Pe{-}\unicode[STIX]{x1D705}$ migration portrait

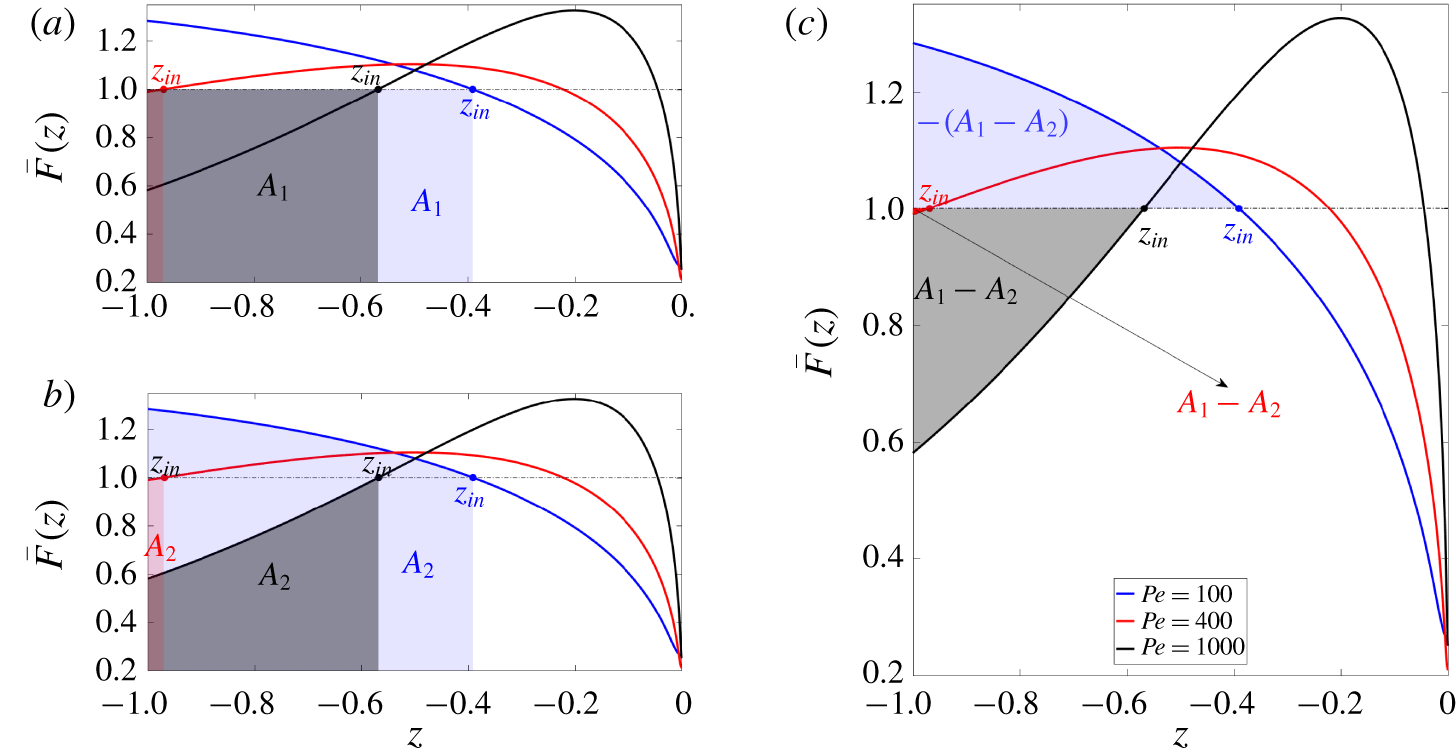
Schematic illustrating the depletion index ( $DI$) calculation using steady state swimmer concentration profiles for
 $\unicode[STIX]{x1D705}=15$, for three different values of
 $Pe$ (100, 400 and 1000). (a) Area (
 $A_{1}$) under the initial uniform distribution (black colour dash-dotted line) from the wall (
 $z=-1$) up to its intersection with the steady state swimmer concentration profile (
 $z_{in}$). (b) Area (
 $A_{2}$) under the steady state profile from
 $z=-1$ to
 $z_{in}$. (c) The differential area
 $A_{1}-A_{2}$. The symbols
 $A_{1}$,
 $A_{2}$ (the respective shaded areas) and
 $z_{in}$ corresponding to
 $Pe=100,400$ and 1000, are represented in blue, red and black colour, respectively. The depletion index is expressed as:
 $DI=[2(A_{1}-A_{2})/A]\times 100$, where
 $A$ is the total area under any (initial uniform distribution or steady state concentration) profile and the factor of 2 accounts for the symmetry about the centreline.

Having discussed the two kinds of migration patterns mentioned above, in § 3.3.1, we quantify the same in terms of the depletion index  $DI$, a non-dimensional measure of the inhomogeneity of the swimmer concentration field. Figure 12 defines the
 $DI$ using swimmer concentration profiles for
 $\unicode[STIX]{x1D705}=15$ (in a half-channel width) for three different
 $Pe$.
 $DI<0$ (
 ${>}$ 0) corresponds to high-shear (low-shear) trapping. Next, in § 3.3.2, we organize the migration behaviour on a
 $Pe{-}\unicode[STIX]{x1D705}$ plane (for small
 $\unicode[STIX]{x1D716}$), thereby delineating the regimes of high-shear and low-shear trapping across a numerically determined phase boundary.
3.3.1 The depletion index
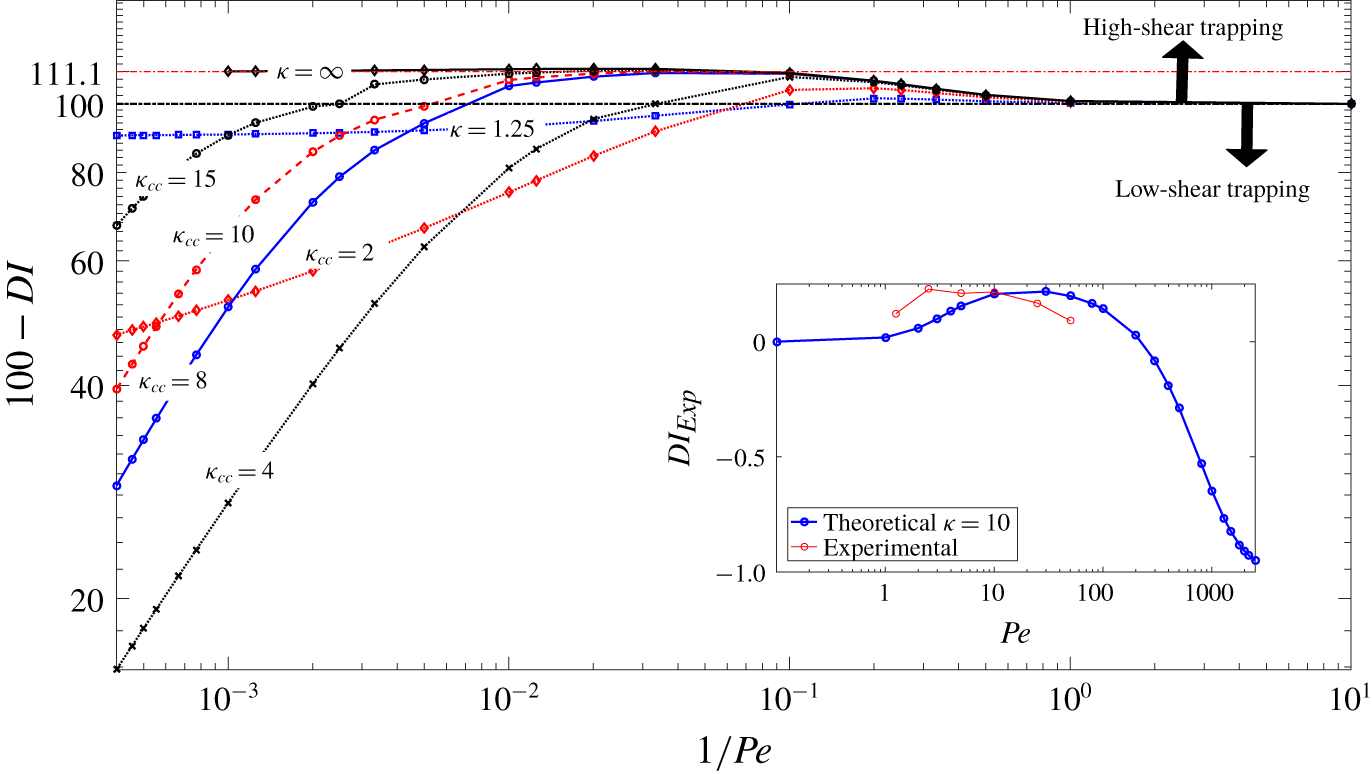
Plot of  $\unicode[STIX]{x0394}DI$ (
 $100-DI$) against
 $1/Pe$ for swimmers of different aspect ratios. The subscript ‘
 $cc$’ in the aspect ratio (
 $\unicode[STIX]{x1D705}_{cc}$) denotes ‘centreline collapse’. The inset represents the comparison of
 $DI_{Exp}$ (defined separately; see text), as predicted by the analysis here, and the experimental results of Rusconi et al. (Reference Rusconi, Guasto and Stocker2014b).

To analyse swimmer migration at large  $Pe$,
 $\unicode[STIX]{x0394}DI=100-DI$ is plotted against
 $1/Pe$ for swimmers of different aspect ratios in figure 13. The plot discriminates between high (
 $\unicode[STIX]{x0394}DI>100$) and low-shear trapping behaviour (
 $\unicode[STIX]{x0394}DI<100$), and, in addition, helps differentiate between centreline collapse (
 $\unicode[STIX]{x0394}DI\rightarrow 0$ for
 $1/Pe\rightarrow 0$ for
 $\unicode[STIX]{x1D705}\geqslant 2$) and non-collapse (
 $\unicode[STIX]{x0394}DI$ approaches a finite value as for
 $1/Pe\rightarrow 0$ for
 $\unicode[STIX]{x1D705}<2$) behaviour within the low-shear trapping regime. Figure 13 clearly illustrates the singular nature of infinitely slender swimmers. For
 $\unicode[STIX]{x1D705}=\infty$,
 $\unicode[STIX]{x0394}DI$ plateaus at a finite value (
 ${>}100$) for
 $1/Pe\rightarrow 0$. In contrast, for any finite
 $\unicode[STIX]{x1D705}\geqslant 2,\unicode[STIX]{x0394}DI$ approaches zero in the same limit, and the rate of approach, rather counter-intuitively, increases with increasing
 $\unicode[STIX]{x1D705}$. For large
 $\unicode[STIX]{x1D705}$ values, this accelerated approach towards the origin begins after an intermediate extended plateau with
 $\unicode[STIX]{x0394}DI>100$ (the same plateau value as for
 $\unicode[STIX]{x1D705}=\infty$). A kink in the
 $\unicode[STIX]{x0394}DI$-curves results as they cross the homogeneous state given by
 $DI=0$ (for instance, see the
 $\unicode[STIX]{x0394}DI$-curve for
 $\unicode[STIX]{x1D705}=15$ in figure 13). This kink is an artefact of our definition of
 $DI$ – although suited for characterizing centreline collapse, the point
 $z_{in}$ used in the definition, to calculate
 $A_{1}$ and
 $A_{2}$ above changes discontinuously as the wall concentration crosses the homogeneous value (see the locations of
 $z_{in}$ for
 $Pe=100$ and 400 in figure 12c). The latter happens during the transition from a near-centre depletion to a near-centre excess profile with increasing
 $Pe$, and, as a result, the profiles on the homogeneous line (
 $DI=0$) in figure 13 are near-centre excess profiles with wall concentration equal to the homogeneous value. This kink does not alter the general character of the
 $DI$-curves, however. Also note that Rusconi et al. (Reference Rusconi, Guasto and Stocker2014b), likely motivated by experimental considerations, had defined a depletion index (
 $DI_{Exp}$) based on the area between the actual and uniform profile in the central half-width of the channel. The general character of figure 13 is again unchanged by this altered definition.
It is worth reiterating the behaviour of the depletion index,  $\unicode[STIX]{x0394}DI$, as a function of the swimmer aspect ratio, starting from infinitely slender swimmers. Regardless of
 $\unicode[STIX]{x1D705}$,
 $\unicode[STIX]{x0394}DI$ starts from 100 for
 $Pe\ll 1$. For
 $\unicode[STIX]{x1D705}=\infty$,
 $\unicode[STIX]{x0394}DI$ increases with increasing
 $Pe$, approaching a constant (
 $\unicode[STIX]{x0394}DI=111.1$) for
 $Pe\rightarrow \infty$. For large but finite
 $\unicode[STIX]{x1D705}$,
 $\unicode[STIX]{x0394}DI$ again increases with increasing
 $Pe$, asymptoting to the aforementioned plateau value in the range
 $1\ll Pe\ll \unicode[STIX]{x1D705}^{3}$, and thereafter, decreases rapidly with further increase in
 $Pe$. This behaviour continues with decreasing
 $\unicode[STIX]{x1D705}$, with the
 $Pe$-interval corresponding to the intermediate plateau above progressively shrinking in extent, and the eventual rate of approach to zero at large
 $Pe$ also decreasing with decreasing
 $\unicode[STIX]{x1D705}$. For the ABPs examined here, this trend continues until a critical aspect ratio of approximately 2, when
 $\unicode[STIX]{x0394}DI$ approaches zero only at a logarithmic rate for large
 $Pe$; that is, for
 $\unicode[STIX]{x1D705}\approx 2$,
 $\unicode[STIX]{x0394}DI$ is
 $O(1/\ln Pe)$ for
 $Pe\gg 1$. For
 $\unicode[STIX]{x1D705}<2$,
 $\unicode[STIX]{x0394}DI$ approaches a finite positive plateau (less than 100) for
 $Pe\rightarrow \infty$, with this plateau value approaching 100 as
 $\unicode[STIX]{x1D705}$ approaches unity (spherical swimmers). It is worth noting that the infinite-aspect-ratio assumption is used routinely in the rheological context, when analysing swimmer suspensions, and generally yields good agreement between experiments and theory (Saintillan Reference Saintillan2010a,Reference Saintillanb; López et al. Reference López, Gachelin, Douarche, Auradou and Clément2015; Nambiar et al. Reference Nambiar, Nott and Subramanian2017, Reference Nambiar, Phanikanth, Nott and Subramanian2019b). In the present context, however, even for moderately large aspect ratios,
 $\unicode[STIX]{x1D705}\sim 4-6$ (relevant in the biological context), at large enough
 $Pe$, the swimmers can, in fact, end up being trapped in the low-shear regions. Thus, the effective aspect-ratio parameter appears to be of considerable importance in the context of shear-induced migration.
Although our theoretical predictions and simulations are in mutual agreement, there is nevertheless a disagreement with the experiments of Rusconi et al. (Reference Rusconi, Guasto and Stocker2014b); aspects of this disagreement were already elaborated on in § 3.1. In order to illustrate the discrepancy, we have plotted  $DI_{Exp}$ against
 $Pe$, as an inset in figure 13 for
 $\unicode[STIX]{x1D705}=10$. While the disagreement appears to be a matter of detail, in the sense that the
 $DI_{Exp}$ in the experiments peaks at a smaller
 $Pe$ (
 ${\approx}10$), and starts decreasing earlier, it is not! The interpretation in the original experiments was that the
 $DI_{Exp}$ would asymptote to zero for larger
 $Pe$. As discussed earlier, this decay of the
 $DI_{Exp}$ to zero, implying the approach of the swimmer concentration profile towards homogeneity, is a consequence of the experimental profiles not being fully developed on account of the limited residence time (ironically enough, the apparent peaking of the
 $DI_{Exp}$ at a finite shear rate in these experiments was motivation for subsequent experiments by Aronson and co-workers (Sokolov & Aranson Reference Sokolov and Aranson2016; Sokolov et al. Reference Sokolov, Rubio, Brady and Aranson2018) in a curvilinear geometry, where the inhomogeneity in swimmer concentration was argued to persist at infinite
 $Pe$, albeit for entirely different reasons). As argued above, the
 $DI_{Exp}$ does not approach zero, for any aspect ratio, in the limit of large
 $Pe$. Thus, the apparent decay of the theoretical
 $DI_{Exp}$ is a signature of the transition to a low-shear trapping regime, and the theoretical
 $DI_{Exp}$ will eventually asymptote to
 $-1$, for the aspect ratio of 10 considered (which allows for a centreline collapse as
 $Pe\rightarrow \infty$).
3.3.2 The $Pe{-}\unicode[STIX]{x1D705}$ migration portrait

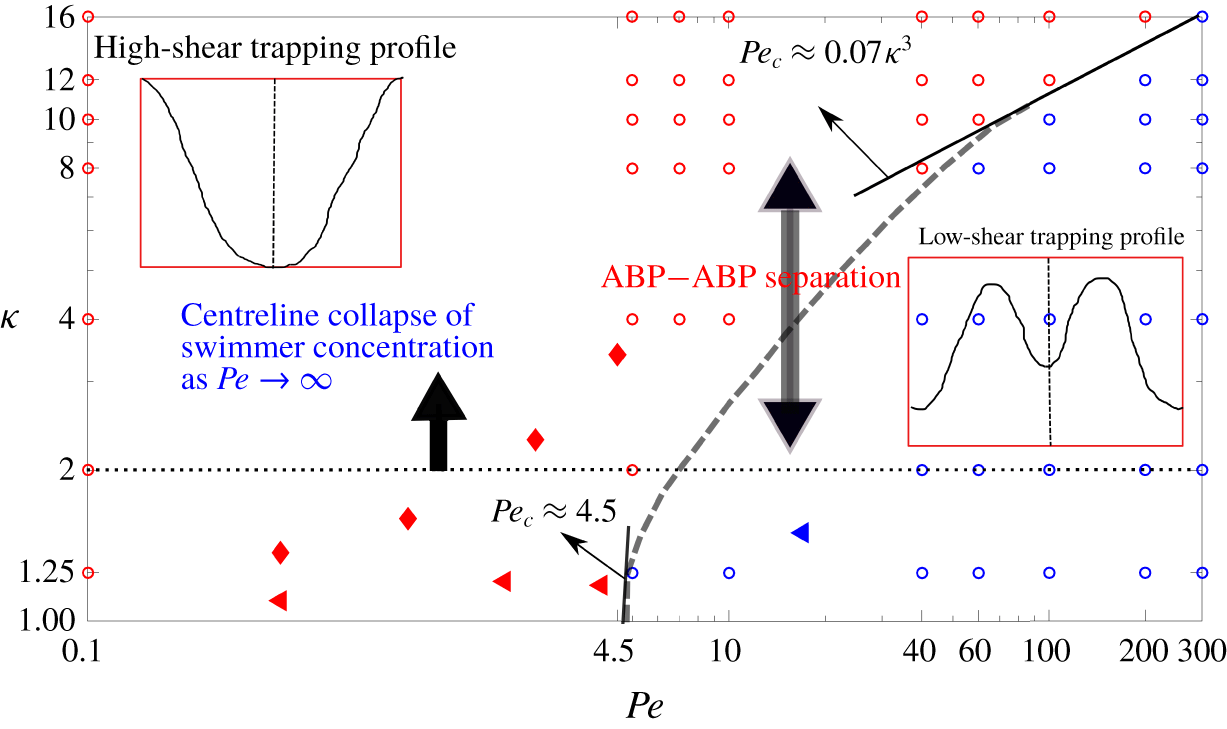
Figure 14 organizes the high-shear and low-shear trapping regimes on the  $Pe{-}\unicode[STIX]{x1D705}$ plane, with an approximate boundary separating the two. We differentiate the high-shear trapping from the low-shear trapping, based on the slope of the swimmer concentration profile at the channel wall. Across the phase boundary, there is a change in sign of this slope, arising from the reversal in the drift; see figure 8 in § 3.2 (note that this criterion suffices in the present context where the focus is on shear-induced migration in the bulk; inclusion of wall interactions would require a modification of this criterion. This is not an issue for comparison with the experiments, however, since the swimmer concentrations were monitored well away from the boundaries). The large-aspect-ratio asymptote for the aforementioned boundary between the two trapping regimes has already been determined based on the scaling arguments given in § 3.2, and is of the form
 $Pe_{c}\propto \unicode[STIX]{x1D705}^{3}$; the pre-factor 0.07 given in figure 14 is determined from a best fit for the curve separating the numerically determined depletion and excess profiles. Now, due to the absence of any preferential alignment under shear, spherical swimmer concentration profiles are homogeneous regardless of
 $Pe$, in the dilute non-interacting regime under consideration. Nevertheless, the small but finite inhomogeneity that arises in the limit
 $\unicode[STIX]{x1D705}\rightarrow 1$ can transform from a near-centre depletion to a near-centre excess at a finite
 $Pe$. This is indeed the case and, based on an expansion of the swimmer probability density in the small Bretherton constant
 $B$, as
 $\unicode[STIX]{x1D6FA}=F/4\unicode[STIX]{x03C0}+B\unicode[STIX]{x1D6FA}_{1}+\cdots \,$, one finds
 $Pe_{c}\sim 4.5$ (see appendix C). Therefore, as
 $\unicode[STIX]{x1D705}\rightarrow 1$, ABPs exhibit high- and low-shear trapping profiles across
 $Pe_{c}=4.5$, with the analytical forms for the latter profiles also exhibiting the characteristic pair of maxima on either side of the centreline, already seen in the numerical profiles. This transition for near-spherical swimmers has again been validated using numerical predictions based on the multiple scale analysis, and Langevin simulations.
Shear-induced migration behaviour on the  $Pe{-}\unicode[STIX]{x1D705}$ plane. The red and blue circles, respectively, represent the high-shear trapping and low-shear trapping regimes (based on the profiles obtained from the multiple scale analysis, with partial verification from Langevin simulations), and the grey dashed line is an approximate boundary separating the two. The solid black lines denote the near-sphere and large-aspect-ratio asymptotes for this boundary. The diamonds and triangles respectively, corresponding to the different trapping regimes of the algae Heterosigma and Dunaliella observed by Barry et al. (Reference Barry, Rusconi, Guasto and Stocker2015).

Also shown in figure 14 are the results from the experiments of Barry et al. (Reference Barry, Rusconi, Guasto and Stocker2015) corresponding to both high-shear and low-shear trapping of the phytoplankton algae Heterosigma and Dunaliella. The effective swimmer aspect ratios ( $\unicode[STIX]{x1D705}$) in the experiments were determined from a best fit of the theoretical orientation distribution, obtained by solving the Fokker–Planck equation with
 $\unicode[STIX]{x1D705}$ as a fitting parameter, with the experimentally determined one. Note that the
 $\unicode[STIX]{x1D705}$ values determined in the manner above were functions of
 $Pe$, implying that the swimmer shape changed on account of the shear-induced deformation. Based on the concentration profiles and depletion index plots (
 $DI_{Exp}$) reported in Barry et al. (Reference Barry, Rusconi, Guasto and Stocker2015), for
 $Pe\leqslant 5$, Heterosigma exhibits high-shear trapping. However, Dunaliella, exhibits high-shear trapping until
 $Pe\approx 5$, and transitions to low-shear trapping at
 $Pe\approx 17$. As seen in figure 14, our predictions are consistent with these observations; in particular, we too predict a transition from high-shear to low-shear trapping, with increasing
 $Pe$, for Dunaliella. An important point to note here is that the
 $\unicode[STIX]{x1D716}$ values for the algal microswimmers above are close to unity (for Heterosigma,
 $\unicode[STIX]{x1D716}\sim 1.12$, and for Dunaliella
 ${\sim}0.717$), calling into question the validity of the method of multiple scale analysis. However, as mentioned earlier, the domain of validity of the analysis is controlled by
 $\unicode[STIX]{x1D716}_{eff}$, and not
 $\unicode[STIX]{x1D716}$. For large
 $Pe$ values,
 $\unicode[STIX]{x1D716}_{eff}\sim \unicode[STIX]{x1D716}Pe^{-1}$, and remains small even when
 $\unicode[STIX]{x1D716}$ is of order unity. This then allows for the trapping regimes of the aforementioned algae to be identified using the multiple time scale analysis. The consistency between the experiments of Barry et al. (Reference Barry, Rusconi, Guasto and Stocker2015) and our theory serves as an important validation of the analysis and arguments presented here.
3.4 Migration pattern of swimmers with passive translational diffusivity
The analysis described thus far shows the remarkable sensitivity of the shear-induced migration to subtle changes in the orientation dynamics. These differences in orientation dynamics were originally identified in the context of passive anisotropic particles, in a series of studies by Hinch and Leal (Leal & Hinch Reference Leal and Hinch1971; Hinch & Leal Reference Hinch and Leal1972a,Reference Hinch and Lealb; Leal & Hinch Reference Leal and Hinch1972, Reference Leal and Hinch1973; Hinch & Leal Reference Hinch and Leal1973), who were motivated by the need to understand the subtle role of weak Brownian motion in strong shearing flows, and its implications for suspension rheology. In fact, the orientation dynamics turn out to be much more crucial for active particles, being responsible for the onset of a low-shear trapping regime! Indeed, Nitsche & Hinch (Reference Nitsche and Hinch1997) have previously used the method of multiple scales to examine shear-induced migration in a dilute suspension of passive anisotropic particles, and only found a high-shear trapping regime. The latter arises on account of the anisotropy of the mobility, and thence, the Brownian diffusivity; the lower diffusivity (mobility) in the transverse direction, of flow-aligned particles close to the walls, leads to accumulation. This is a relatively weak effect owing to the mobility anisotropy (defined as the ratio of the longitudinal to the transverse mobility coefficients) saturating at 2 even for infinitely slender particles; experiments on fibre suspensions have failed to observe the predicted high-shear trapping (Nitsche & Hinch Reference Nitsche and Hinch1997) at lower volume fractions (Strednak et al. Reference Strednak, Shaikh, Butler and Guazzelli2018). Importantly, since the mobility, and therefore the diffusivity at any non-zero  $z$, asymptotes to a finite value for
 $Pe\rightarrow \infty$, the concentration profile must become spatially homogeneous in this limit (for sufficiently large
 $Pe$,
 $\unicode[STIX]{x0394}DI$ decays as
 $O(Pe^{-1})$ for any finite
 $\unicode[STIX]{x1D705}$, and as
 $O(Pe^{-1/3})$ for
 $\unicode[STIX]{x1D705}=\infty$). This is, of course, in sharp contrast to the active case examined here.
In light of the contrasting nature of the active and passive migration behaviour, it is worth examining (briefly) the effect of an independent source of translational diffusion (thermal or otherwise) on shear-induced migration. This corresponds to an additional term of the form (Kim & Karrila Reference Kim and Karrila2005)
 $$\begin{eqnarray}\displaystyle & & \displaystyle \frac{\unicode[STIX]{x1D701}D_{r}}{U_{s}^{2}}k_{B}T\left[M_{\Vert }\boldsymbol{p}\boldsymbol{p}+M_{\bot }(\boldsymbol{I}-\boldsymbol{p}\boldsymbol{p})\right]\nonumber\\ \displaystyle & & \displaystyle \quad =\unicode[STIX]{x1D701}\bar{D}\left[\frac{\left(M_{\Vert }^{\prime }+2M_{\bot }^{\prime }\right)}{3}\boldsymbol{I}+\left(M_{\Vert }^{\prime }-M_{\bot }^{\prime }\right)\left(\,\boldsymbol{p}\boldsymbol{p}-\frac{\boldsymbol{I}}{3}\right)\right],\end{eqnarray}$$
in the dimensionless equation governing the phase-space probability density (equation (2.2) in § 2); here,  $M_{\Vert }$ and
 $M_{\bot }$ denote the
 $\unicode[STIX]{x1D705}$-dependent translational mobilities along and transverse to the swimmer axis, with
 $M_{\Vert }^{\prime }=6\unicode[STIX]{x03C0}\unicode[STIX]{x1D702}LM_{\Vert }$,
 $M_{\bot }^{\prime }=6\unicode[STIX]{x03C0}\unicode[STIX]{x1D702}LM_{\bot }$; the averaged mobility,
 $(M_{\Vert }+2M_{\bot })/3$ corresponds to the passive translational diffusivity for an isotropic orientation distribution (
 $Pe=0$). The parameter
 $\bar{D}=(k_{B}TD_{r}/6\unicode[STIX]{x03C0}\unicode[STIX]{x1D702}LU_{s}^{2})$ represents the ratio of the active to the passive diffusivities, with
 $k_{B}$ being the Boltzmann constant,
 $T$ the temperature and
 $\unicode[STIX]{x1D702}$ the suspension viscosity (Kim & Karrila Reference Kim and Karrila2005). The additional parameter
 $\unicode[STIX]{x1D701}$ accounts for the possible athermal origin of the translational diffusion. Thus,
 $\unicode[STIX]{x1D701}\geqslant 1$, with
 $\unicode[STIX]{x1D701}=1$ corresponding to the translational diffusion having a thermal origin. Application of the method of multiple scale analysis again leads to the drift-diffusion equation (2.7), but with additional passive contributions to both the diffusivity and drift given by
 $$\begin{eqnarray}\displaystyle & \displaystyle D_{zz}^{p}=\unicode[STIX]{x1D701}\bar{D}\int \text{d}\,\boldsymbol{p}\left[\frac{(M_{\Vert }^{\prime }+2M_{\bot }^{\prime })}{3}+\frac{(M_{\Vert }^{\prime }-M_{\bot }^{\prime })}{3}(3\cos ^{2}\unicode[STIX]{x1D703}-1)\right]G(\,\boldsymbol{p}), & \displaystyle\end{eqnarray}$$
 $$\begin{eqnarray}\displaystyle & \displaystyle V_{z}^{p}=\unicode[STIX]{x1D701}\bar{D}\int \text{d}\,\boldsymbol{p}\left[\frac{(M_{\Vert }^{\prime }+2M_{\bot }^{\prime })}{3}+\frac{(M_{\Vert }^{\prime }-M_{\bot }^{\prime })}{3}(3\cos ^{2}\unicode[STIX]{x1D703}-1)\right]\unicode[STIX]{x2202}G(\,\boldsymbol{p})/\unicode[STIX]{x2202}z. & \displaystyle\end{eqnarray}$$
Choosing  $D_{r}=1~\text{s}^{-1}$,
 $L\approx 9~\unicode[STIX]{x03BC}\text{m}$,
 $U_{s}\approx 50~\unicode[STIX]{x03BC}\text{m}$,
 $T\approx 300~\text{K}$ and
 $\unicode[STIX]{x1D702}\approx 10^{-3}~\text{Ns}~\text{m}^{-2}$, which are typical values for microorganisms in an aqueous medium, yields
 $\bar{D}\approx 9.765\times 10^{-6}$ (Rusconi et al. Reference Rusconi, Guasto and Stocker2014b; López et al. Reference López, Gachelin, Douarche, Auradou and Clément2015). In figure 15, we compare the variation of
 $\unicode[STIX]{x0394}DI$ against
 $1/Pe$, for the
 $\unicode[STIX]{x1D705}$ values shown in figure 13 (which appears again as figure 15(a) with
 $\unicode[STIX]{x1D701}=0$), with the cases
 $\unicode[STIX]{x1D701}=1$ and 10. While the swimmer migration remains similar to the active case (figure 15a) for low to moderate
 $Pe$, the passive translational diffusivity given by (3.2) becomes dominant at large
 $Pe$ (since the active diffusivity approaches zero for
 $Pe\rightarrow \infty$), causing
 $\unicode[STIX]{x0394}DI$ to approach 100 (the homogeneous state) in the limit
 $Pe\rightarrow \infty$. While this trend, on the whole, is similar to that reported by Ezhilan & Saintillan (Reference Ezhilan and Saintillan2015), the nature of the approach to the homogeneous state is a function of
 $\unicode[STIX]{x1D705}$. The approach to homogeneity may be from either the high-shear or low-shear trapping regime depending on
 $\unicode[STIX]{x1D705}$. With increasing
 $\unicode[STIX]{x1D701}$, the approach from the high-shear trapped regime extends to a progressively larger range of aspect ratios, with a concomitant collapse of the depletion index curves towards the homogeneous state.
Variation of  $\unicode[STIX]{x0394}DI~(100-DI)$ against
 $1/Pe$ for swimmers of different aspect ratios. The parameter
 $\unicode[STIX]{x1D701}$ accounts for the athermal origin of the translational diffusivity (a)
 $0$, (b)
 $1$ and (c)
 $10$; here,
 $\unicode[STIX]{x1D701}=0$ represents the absence of passive translational diffusivity (
 $\unicode[STIX]{x0394}DI$ of figure 13) and
 $\unicode[STIX]{x1D701}=1$ corresponds to the translational diffusivity having a thermal origin. The black dash-dotted line corresponds to the homogeneous state (
 $DI=0$). The inset in (c) represents the magnified view of
 $\unicode[STIX]{x0394}DI$ versus
 $1/Pe$, highlighting the approach towards the homogeneous state at large
 $Pe$.

Variation of  $\unicode[STIX]{x0394}DI~(100-DI)$ against
 $1/Pe$ for swimmers of different aspect ratios, based on the mean passive translational diffusivity as
 $Pe\rightarrow \infty$.

Figure 15(a–c) shows that the inclusion of passive translational diffusion can have a non-trivial effect on activity-induced shear migration. In particular, a large enough  $\unicode[STIX]{x1D701}$ value can impede the appearance of the low-shear trapping regime. To illustrate this, we consider the choice made in Ezhilan & Saintillan (Reference Ezhilan and Saintillan2015); the authors used a dimensionless parameter,
 $\unicode[STIX]{x1D6EC}=D_{t}D_{r}/U_{s}^{2}$, to incorporate the effects of a scalar translational diffusivity. Most of their results correspond to
 $\unicode[STIX]{x1D6EC}=1/6$, which makes the translational diffusivity equal to the swimming-induced diffusivity (
 $U_{s}^{2}/6D_{r}$) in the absence of a flow. The translational diffusion in the present analysis is a tensor owing to which there no direct analogue to the parameter
 $\unicode[STIX]{x1D6EC}$. Nevertheless, one may choose a suitably averaged translational diffusion to replace
 $D_{t}$ in
 $\unicode[STIX]{x1D6EC}$ above. Since the effects of translational diffusion are most important at large
 $Pe$, such an average (
 $\langle D_{t}\rangle$) may be based on the infinite
 $-Pe$ (but
 $\unicode[STIX]{x1D705}$-dependent) orientation distribution derived by Leal & Hinch (Reference Leal and Hinch1971). Thus, replacing
 $D_{t}$ by
 $\langle D_{t}\rangle$ in
 $\unicode[STIX]{x1D6EC}$ above, and choosing
 $\unicode[STIX]{x1D6EC}=1/6$, leads to the depletion index curves shown in figure 16; note that the fixed value of
 $\unicode[STIX]{x1D6EC}$ implies that
 $\unicode[STIX]{x1D701}$ is now a function of
 $\unicode[STIX]{x1D705}$, and thus, each of the depletion curves in figure 16 corresponds to a different
 $\unicode[STIX]{x1D701}$. Although not shown, in contrast to the near-centre depletion profiles seen in figure 2, the large-
 $Pe$ concentration profiles along these curves begin to approach uniformity in the bulk, with a narrow depletion layer around the centreline. The choice of the orientational average in
 $\langle D_{t}\rangle$ does not alter the above conclusion; we have verified that use of the isotropic diffusivity
 $(D_{\Vert }+2D_{\bot })/3$, appropriate for
 $Pe=0$, leads to depletion index curves similar to those shown in figure 16 (the isotropic average and the
 $Pe=\infty$ Leal–Hinch average serve to bound the arbitrary-
 $Pe$ translational diffusivity).
4 Conclusions
Motivated by recent microfluidic experiments (Rusconi et al. Reference Rusconi, Guasto and Stocker2014b; Barry et al. Reference Barry, Rusconi, Guasto and Stocker2015), in this work we have used both theory and simulations to systematically study shear-induced migration in a dilute suspension of microswimmers subject to a plane Poiseuille flow in a wide channel. On the theoretical front, we have used the method of multiple time scales to derive a drift-diffusion equation governing the steady state cross-stream swimmer concentration profile. Based on the swimmer geometry, as characterized by its equivalent aspect ratio  $\unicode[STIX]{x1D705}$, and a rotary Péclet number
 $Pe=U_{f}/(D_{r}H)$ that characterizes the relative efficiency of stochastic reorientation and flow-induced rotation, we delineate high-shear and low-shear trapping regimes. Our theoretical predictions are reinforced by the results of Langevin simulations and establish, for the first time, the existence of a low-shear trapping regime at sufficient large
 $Pe$ for any finite
 $\unicode[STIX]{x1D705}$. The transition from high-shear to low-shear trapping appears consistent with the experimental data available from Barry et al. (Reference Barry, Rusconi, Guasto and Stocker2015); the biflagellated algal species, Chlamydomonas and Dunaliella, used in the experiments, exhibit a low-shear trapping regime at high shear rates, with the latter species going through a high-shear trapping regime at lower shear rates.
Importantly, while a low-shear trapping regime has been identified and characterized here, for the first time, our interpretation of the mechanism underlying high-shear trapping is also in contrast to earlier efforts. For instance, in Rusconi et al. (Reference Rusconi, Guasto and Stocker2014b) and Ezhilan & Saintillan (Reference Ezhilan and Saintillan2015), the depletion layer is regarded as localized in the central part of the channel at high  $Pe$, being driven by the polar orientational order induced by swimming. The bulk of the channel is regarded as having a uniform concentration owing to the flow alignment of the swimmers by the strong shear (see figure 7(a) in Ezhilan & Saintillan (Reference Ezhilan and Saintillan2015)). However, the method of multiple scale analysis applied here clearly shows that strong flow alignment does not imply a uniform swimmer concentration. Although both the diffusivity and drift associated with individual swimmers decrease with increasing flow alignment, this only affects the time scale on which the steady state is attained, and not the magnitude of the steady state inhomogeneity. The long-time limit is thus a singular one – the concentration profile at a fixed time approaches uniformity with increasing
 $Pe$, but the inhomogeneity (as characterized by the depletion index) associated with the actual steady state profile is of order unity, despite the bulk polar order (induced by swimming) only being
 $O(\unicode[STIX]{x1D716})$. The nearly uniform profiles with a narrow depletion layer in the vicinity of the centreline, observed in the experiments of Rusconi et al. (Reference Rusconi, Guasto and Stocker2014b), are likely due to the profiles having a transient character, as explained in § 3.1. In contrast, the analogous profiles obtained by Ezhilan & Saintillan (Reference Ezhilan and Saintillan2015) are likely due to the dominant influence of the passive translational diffusivity, as explained in § 3.4.
We note that both the method of multiple scale analysis and the Langevin simulations with periodic boundary conditions reported here, do not consider the direct effect of the channel boundaries, in an effort to focus on bulk migration mechanisms. The boundaries only play a passive role in the analysis via no-flux boundary conditions imposed on the drift-diffusion equation. Similarly, for the simulations, periodic boundary conditions suppress the polar order that would otherwise emerge in wall boundary layers with thicknesses of order the mean free path. As mentioned earlier (see § 3.1), such boundary layers lead to wall accumulation even in the absence of hydrodynamic interactions (Elgeti & Gompper Reference Elgeti and Gompper2009, Reference Elgeti and Gompper2013; Costanzo et al. Reference Costanzo, Elgeti, Auth, Gompper and Ripoll2014; Ezhilan, Alonso-Matilla & Saintillan Reference Ezhilan, Alonso-Matilla and Saintillan2015; Ezhilan & Saintillan Reference Ezhilan and Saintillan2015; Elgeti & Gompper Reference Elgeti and Gompper2016; Das, Gompper & Winkler Reference Das, Gompper and Winkler2018). In the context of the wide channels analysed here, one expects accumulation in such boundary layers to be small (the swimmers in the boundary layers constituting only an  $O(\unicode[STIX]{x1D716})$ fraction of the total swimmer population), and the results reported should be largely unaltered for small
 $\unicode[STIX]{x1D716}$. We have verified that this is indeed the case via limited simulations that implement impenetrability conditions at the single-swimmer level, which do lead to the emergence of polar orientational order near boundaries. In the specific context of figure 14, one therefore expects wall-induced accumulation to only shift the phase boundary demarcating the two distinct shear trapping regimes by an amount of
 $O(\unicode[STIX]{x1D716})$. While hydrodynamically induced wall accumulation may be incorporated in the present analysis via the inclusion of additional image-induced convection in the original equation governing the phase-space probability density, a theoretical framework that accounts for non-hydrodynamic wall accumulation, associated with polar wall boundary layers, would seem to necessitate a matched asymptotic expansions approach that allows for a transition from a dominant nematic order in the bulk (as is implicit in the multiple scale analysis) to a significant polar order close to the boundaries, and is beyond the scope of the present study.
The organization of shear-induced migration of active swimmers as a  $Pe{-}\unicode[STIX]{x1D705}$ phase portrait has important implications. The fact that swimmers on either side of the phase boundary in figure 14 migrate in opposite directions allows, in principle, for a microfluidic shape sorter (
 $\unicode[STIX]{x1D705}$ being a surrogate for the swimmer shape). A shape-based sorting might be feasible in the low-shear trapping regime alone by exploiting the centreline collapse (for
 $Pe\rightarrow \infty$) that occurs for
 $\unicode[STIX]{x1D705}\geqslant 2$ (application of the multiple scale analysis shows that results for the plane Poiseuille flow derived herein, including the threshold aspect ratio for centreline collapse, directly carry over to the pipe Poiseuille case). A second interesting implication of the centreline collapse is for the dispersion of microswimmers in the flow direction (this has been examined, in the limit of confined channels, by Chilukuri et al. (Reference Chilukuri, Collins and Underhill2015)). It is known from classical Taylor dispersion theory that, in the limit where the microswimmers uniformly sample the channel cross-section, the mean square displacement in the flow direction scales as
 $O(Pe_{t}^{2}D_{zz}t)$, and therefore, increases with increasing
 $Pe_{t}$; here,
 $Pe_{t}=U_{f}H/D_{zz}=Pe^{3}/\unicode[STIX]{x1D716}^{2}$, is the Péclet number based on the swimmer translational diffusivity (and we have accounted for the
 $O(Pe^{-2})$ scaling of
 $D_{zz}$). However, for large-aspect-ratio microswimmers in the low-shear trapping regime identified here, the extent of the channel cross-section sampled decreases sharply with increasing
 $Pe_{t}$ (or increasing
 $Pe$ with
 $\unicode[STIX]{x1D716}$ fixed), pointing to a possible non-trivial scaling of the flow-induced dispersion in the limit of large
 $Pe_{t}$.
The approach of microswimmers to any surface is the first step towards colonization and biofilm formation, and the analysis presented in this paper points to the factors that can sensitively influence incipient colonization. The existence of both high- and low-shear trapping regimes points to the possibility of manipulating fluid shear to possibly reinforce or retard biofilm formation; the high- and low-shear trapping regimes in figure 14 may perhaps be equivalently interpreted as regimes where hydrodynamics favours or opposes biofilm formation. Moreover, one can also expect a richer range of concentration patterns and dynamical regimes, relative to those identified earlier in Rusconi et al. (Reference Rusconi, Guasto and Stocker2014b) and Bearon & Hazel (Reference Bearon and Hazel2015), in the presence of an ambient chemical gradient that causes chemotactic swimmers to drift towards a boundary. A study that addresses the role of chemotaxis on the migration pattern requires a more detailed analysis, and will be pursued in the near future.
Finally, it must be noted that figure 14 depicts migration behaviour specifically for ABPs. One expects a similar phase portrait for other swimmer types (RTPs, for instance), although the sensitivity of the trapping regime to the orientation dynamics obviously points to different  $Pe{-}\unicode[STIX]{x1D705}$ scalings for the phase boundary. For instance, the cross-over from high-shear to low-shear trapping across a
 $Pe$ of
 $O(\unicode[STIX]{x1D705}^{3})$ is valid only for ABPs; likewise, one expects a different threshold aspect ratio, governing a possible centreline collapse, for RTPs. An analysis along the above lines and its implications towards flow-based separation of microswimmers, with different swimming characteristics, will be reported separately.
Acknowledgements
V.L.N.R. would like to thank the Science and Engineering Research Board, India (grant no. PDF/2017/002050) for financial support. G.S. would like to acknowledge financial support from Life Science Research, Education and Training at JNCASR Bangalore (grant no. BT/INF/22/SP27679/2018).
Appendix A. Numerical scheme for the swimmer probability densities and concentration profiles
In the following, we describe the numerical scheme adopted to evaluate the swimmer orientation probability densities  $G(\,\boldsymbol{p})$ and
 $\unicode[STIX]{x1D6FA}_{1}(\,\boldsymbol{p})$, at
 $O(1)$ and
 $O(\unicode[STIX]{x1D716})$, respectively, and thence the steady state swimmer concentration profile of (2.7), mentioned in § 2.1. To solve (2.4), for
 $G(\,\boldsymbol{p})$, we use a spherical coordinate system with its polar axis aligned with the
 $z$-axis (see figure 1). As a result, the components of the swimmer orientation vector are given by
 $p_{1}=\sin \unicode[STIX]{x1D703}\cos \unicode[STIX]{x1D719}$,
 $p_{2}=\sin \unicode[STIX]{x1D703}\sin \unicode[STIX]{x1D719}$,
 $p_{3}=\cos \unicode[STIX]{x1D703}$. The flow-induced rotation term in (2.4),
 $\unicode[STIX]{x1D735}_{p}\boldsymbol{\cdot }(\,\tilde{\dot{\boldsymbol{p}}}G)$, may now be written as:
 $$\begin{eqnarray}\displaystyle \unicode[STIX]{x1D735}_{p}\boldsymbol{\cdot }(\,\tilde{\dot{\boldsymbol{p}}}G) & = & \displaystyle -3B\sin \unicode[STIX]{x1D703}\cos \unicode[STIX]{x1D703}\cos \unicode[STIX]{x1D719}G+\frac{1}{2}\left(1+B\cos (2\unicode[STIX]{x1D703})\right)\cos \unicode[STIX]{x1D719}\frac{\unicode[STIX]{x2202}G}{\unicode[STIX]{x2202}\unicode[STIX]{x1D703}}\nonumber\\ \displaystyle & & \displaystyle -\,\frac{1}{2}\left(1+B\right)\cot \unicode[STIX]{x1D703}\sin \unicode[STIX]{x1D719}\frac{\unicode[STIX]{x2202}G}{\unicode[STIX]{x2202}\unicode[STIX]{x1D719}}\nonumber\\ \displaystyle & = & \displaystyle -3B\sin \unicode[STIX]{x1D703}\cos \unicode[STIX]{x1D703}\cos \unicode[STIX]{x1D719}G+\frac{1}{2}\left[\text{i}{\mathcal{L}}_{y}(G)\{1+B\cos (2\unicode[STIX]{x1D703})\}\right.\nonumber\\ \displaystyle & & \displaystyle \left.-\,2\text{i}B\sin \unicode[STIX]{x1D703}\cos \unicode[STIX]{x1D703}\sin \unicode[STIX]{x1D719}{\mathcal{L}}_{z}(G)\right],\end{eqnarray}$$
where the operators (Messiah Reference Messiah1962; Doi & Edwards Reference Doi and Edwards1978)
 $$\begin{eqnarray}\displaystyle \left.\begin{array}{@{}c@{}}\displaystyle {\mathcal{L}}_{y}=-\text{i}\cos \unicode[STIX]{x1D719}\frac{\unicode[STIX]{x2202}}{\unicode[STIX]{x2202}\unicode[STIX]{x1D703}}+\text{i}\cot \unicode[STIX]{x1D703}\sin \unicode[STIX]{x1D719}\frac{\unicode[STIX]{x2202}}{\unicode[STIX]{x2202}\unicode[STIX]{x1D719}},\\ \displaystyle {\mathcal{L}}_{z}=-\text{i}\frac{\unicode[STIX]{x2202}}{\unicode[STIX]{x2202}\unicode[STIX]{x1D719}}.\end{array}\right\} & & \displaystyle\end{eqnarray}$$
Expressing (A 1) in terms of spherical harmonics, we have
 $$\begin{eqnarray}\displaystyle \unicode[STIX]{x1D735}_{p}\boldsymbol{\cdot }(\,\tilde{\dot{\boldsymbol{p}}}G) & = & \displaystyle -3B\sqrt{\frac{2\unicode[STIX]{x03C0}}{15}}(Y_{2}^{-1}-Y_{2}^{1})G+\frac{1}{2}\left[i{\mathcal{L}}_{y}(G)\left\{1+B\left(-\frac{2}{3}\sqrt{\unicode[STIX]{x03C0}}Y_{0}^{0}+\frac{8}{3}\sqrt{\frac{\unicode[STIX]{x03C0}}{5}}Y_{2}^{0}\right)\right\}\right.\nonumber\\ \displaystyle & & \displaystyle +\,\left.2B\sqrt{\frac{2\unicode[STIX]{x03C0}}{15}}\left(Y_{2}^{-1}+Y_{2}^{1}\right){\mathcal{L}}_{z}(G)\right].\end{eqnarray}$$
Now, expanding
 $$\begin{eqnarray}G(\,\boldsymbol{p})=\mathop{\sum }_{l=0}^{\infty }\mathop{\sum }_{m=-l}^{l}a_{l,m}Y_{l}^{m}(\,\boldsymbol{p}),\end{eqnarray}$$
and substituting in (A 3), one may write
 $$\begin{eqnarray}\displaystyle & & \displaystyle \hspace{-12.0pt}\unicode[STIX]{x1D735}_{p}\boldsymbol{\cdot }(\,\tilde{\dot{\boldsymbol{p}}}G)=\mathop{\sum }_{l=0}^{\infty }\mathop{\sum }_{m=-l}^{l}a_{l,m}\unicode[STIX]{x1D735}_{p}\boldsymbol{\cdot }(\,\tilde{\dot{\boldsymbol{p}}}Y_{l}^{m})=\mathop{\sum }_{l=0}^{\infty }\mathop{\sum }_{m=-l}^{l}a_{l,m}\left[-3B\sqrt{\frac{2\unicode[STIX]{x03C0}}{15}}(Y_{2}^{-1}-Y_{2}^{1})Y_{l}^{m}\right.\nonumber\\ \displaystyle & & \displaystyle \hspace{-12.0pt}\quad \left.+\,\frac{\text{i}}{2}{\mathcal{L}}_{y}|Y_{l}^{m}\rangle \left\{1+B\left(-\frac{2}{3}\sqrt{\unicode[STIX]{x03C0}}Y_{0}^{0}+\frac{8}{3}\sqrt{\frac{\unicode[STIX]{x03C0}}{5}}Y_{2}^{0}\right)\right\}+B\sqrt{\frac{2\unicode[STIX]{x03C0}}{15}}(Y_{2}^{-1}+Y_{2}^{1}){\mathcal{L}}_{z}|Y_{l}^{m}\rangle \right],\qquad\end{eqnarray}$$
where  $Y_{l}^{m}(\,\boldsymbol{p})=\sqrt{(2l+1)/(4\unicode[STIX]{x03C0})(l-m)!/(l+m)!}P_{n}^{m}(\cos \unicode[STIX]{x1D703})\exp (\text{i}m\unicode[STIX]{x1D719})$, represent the spherical harmonics and
 $P_{n}^{m}$ are the associated Legendre functions (Abramowitz & Stegun Reference Abramowitz and Stegun1965) and
 ${\mathcal{L}}_{i}|Y_{l}^{m}\rangle ={\mathcal{L}}_{i}(Y_{l}^{m})$.
Next, we substitute the expansion for  $G(\,\boldsymbol{p})$ above in the remaining terms of (2.4), with the tumbling kernel being given by
 $K(\,\boldsymbol{p}/\boldsymbol{p}^{\prime })=\unicode[STIX]{x1D6FD}\exp (\unicode[STIX]{x1D6FD}(\,\boldsymbol{p}\boldsymbol{\cdot }\boldsymbol{p}^{\prime }))/(4\unicode[STIX]{x03C0}\sinh \unicode[STIX]{x1D6FD})=\sum _{n=0}^{\infty }A_{n}P_{n}(\,\boldsymbol{p}\boldsymbol{\cdot }\boldsymbol{p}^{\prime })$ (Subramanian & Koch Reference Subramanian and Koch2009; Nambiar et al. Reference Nambiar, Nott and Subramanian2017); here,
 $\unicode[STIX]{x1D6FD}$ is the correlation parameter characterizing the tumbles, and
 $P_{n}$ represents the Legendre polynomial of the
 $n$th degree, with the argument being the cosine of the angles between the pre- and post-tumble operations. Further, employing the addition theorem of spherical harmonics and that
 $\unicode[STIX]{x1D6FB}_{p}^{2}Y_{l}^{m}=-l(l+1)Y_{l}^{m}$ (Abramowitz & Stegun Reference Abramowitz and Stegun1965), equation (2.4) may finally be written as the following summation over the spherical harmonics:
 $$\begin{eqnarray}\displaystyle & & \displaystyle \mathop{\sum }_{l=0}^{\infty }\mathop{\sum }_{m=-l}^{l}a_{l,m}\left[-3Pe_{z}B\sqrt{\frac{2\unicode[STIX]{x03C0}}{15}}(Y_{2}^{-1}-Y_{2}^{1})Y_{l}^{m}\right.\nonumber\\ \displaystyle & & \displaystyle \quad +\,Pe_{z}\frac{\text{i}}{2}{\mathcal{L}}_{y}|Y_{l}^{m}\rangle \left\{1+B\left(-\frac{2}{3}\sqrt{\unicode[STIX]{x03C0}}Y_{0}^{0}+\frac{8}{3}\sqrt{\frac{\unicode[STIX]{x03C0}}{5}}Y_{2}^{0}\right)\right\}\nonumber\\ \displaystyle & & \displaystyle \quad \left.+\,BPe_{z}\sqrt{\frac{2\unicode[STIX]{x03C0}}{15}}\left(Y_{2}^{-1}+Y_{2}^{1}\right){\mathcal{L}}_{z}|Y_{l}^{m}\rangle +l(l+1)Y_{l}^{m}\right.\nonumber\\ \displaystyle & & \displaystyle \quad \left.+\,\frac{1}{\unicode[STIX]{x1D70F}D_{r}}\left(Y_{l}^{m}-\mathop{\sum }_{s=0}^{\infty }\mathop{\sum }_{t=-s}^{s}\int \text{d}\,\boldsymbol{p}^{\prime }\,A_{s}\frac{4\unicode[STIX]{x03C0}(-1)^{t}Y_{s}^{t}(\,\boldsymbol{p})Y_{s}^{-t}(\,\boldsymbol{p}^{\prime })Y_{l}^{m}(\,\boldsymbol{p}^{\prime })}{(2s+1)}\right)\right]=0.\end{eqnarray}$$
In the above equation,  $A_{0}=1/4\unicode[STIX]{x03C0}$ (from the conservation of swimmers during tumble events:
 $\int \text{d}\,\boldsymbol{p}\,K(\,\boldsymbol{p}/\boldsymbol{p}^{\prime })=\int \text{d}\,\boldsymbol{p}^{\prime }\,K(\,\boldsymbol{p}/\boldsymbol{p}^{\prime })=1$) and
 $$\begin{eqnarray}A_{n}=\frac{\int \text{d}(\,\boldsymbol{p}\boldsymbol{\cdot }\boldsymbol{p}^{\prime })\unicode[STIX]{x1D6FD}\exp (\unicode[STIX]{x1D6FD}(\,\boldsymbol{p}\boldsymbol{\cdot }\boldsymbol{p}^{\prime }))/(4\unicode[STIX]{x03C0}\sinh \unicode[STIX]{x1D6FD})P_{n}(\,\boldsymbol{p}\boldsymbol{\cdot }\boldsymbol{p}^{\prime })}{\int \text{d}(\,\boldsymbol{p}\boldsymbol{\cdot }\boldsymbol{p}^{\prime })P_{n}(\,\boldsymbol{p}\boldsymbol{\cdot }\boldsymbol{p}^{\prime })P_{n}(\,\boldsymbol{p}\boldsymbol{\cdot }\boldsymbol{p}^{\prime })}\quad \text{for }n\geqslant 1.\end{eqnarray}$$
Using the following identities in (A 6) (Doi & Edwards Reference Doi and Edwards1978; Messiah Reference Messiah1962)
 $$\begin{eqnarray}\displaystyle & \displaystyle \text{i}{\mathcal{L}}_{y}|Y_{l}^{m}\rangle ={\textstyle \frac{1}{2}}\left[k_{lm}^{\prime }Y_{l}^{m+1}-k_{lm}^{\prime \prime }Y_{l}^{m-1}\right], & \displaystyle \nonumber\\ \displaystyle & \displaystyle {\mathcal{L}}_{z}|Y_{l}^{m}\rangle =mY_{l}^{m}, & \displaystyle \nonumber\end{eqnarray}$$
and after simplification, we get
 $$\begin{eqnarray}\displaystyle & & \displaystyle \mathop{\sum }_{l=0}^{\infty }\mathop{\sum }_{m=-l}^{l}a_{l,m}\left[-3BPe_{z}\sqrt{\frac{2\unicode[STIX]{x03C0}}{15}}(Y_{2}^{-1}-Y_{2}^{1})Y_{l}^{m}+\frac{Pe_{z}(k_{lm}^{\prime }Y_{l}^{m+1}-k_{lm}^{\prime \prime }Y_{l}^{m-1})}{4}\right.\nonumber\\ \displaystyle & & \displaystyle \quad \left.\left\{1+B\left(-\frac{2}{3}\sqrt{\unicode[STIX]{x03C0}}Y_{0}^{0}+\frac{8}{3}\sqrt{\frac{\unicode[STIX]{x03C0}}{5}}Y_{2}^{0}\right)\right\}+Pe_{z}B\sqrt{\frac{2\unicode[STIX]{x03C0}}{15}}\left(Y_{2}^{-1}+Y_{2}^{1}\right)mY_{l}^{m}\right.\nonumber\\ \displaystyle & & \displaystyle \quad \left.+\,\frac{Y_{l}^{m}}{\unicode[STIX]{x1D70F}D_{r}}\left(1-\frac{A_{l}}{4\unicode[STIX]{x03C0}}\right)+l(l+1)Y_{l}^{m}\right]=0,\end{eqnarray}$$
where  $k_{lm}^{\prime }=\sqrt{l(l+1)-m(m+1)}$ and
 $k_{lm}^{\prime \prime }=\sqrt{l(l+1)-m(m-1)}$.
Now, multiplying the above equation with the conjugate spherical harmonic  $Y_{r}^{s^{\ast }}(\,\boldsymbol{p})$, then integrating it over the unit sphere, and using the orthogonality of spherical harmonics, we obtain the following infinite sequence of linear equations for the
 $a_{l,m}$ values:
 $$\begin{eqnarray}\displaystyle & & \displaystyle \mathop{\sum }_{l=0}^{\infty }\mathop{\sum }_{m=-l}^{l}a_{l,m}\left\{Pe_{z}\frac{\sqrt{\unicode[STIX]{x03C0}}(3-B)}{6}\left[k_{lm}^{\prime }\langle r,s|Y_{0}^{0}|l,m+1\rangle -k_{lm}^{\prime \prime }\langle r,s|Y_{0}^{0}|l,m-1\rangle \right]\right.\nonumber\\ \displaystyle & & \displaystyle \quad +\,Pe_{z}\left(\frac{B}{3}\right)\sqrt{\frac{4\unicode[STIX]{x03C0}}{5}}\left[k_{lm}^{\prime }\langle r,s|Y_{2}^{0}|l,m+1\rangle -k_{lm}^{\prime \prime }\langle r,s|Y_{2}^{0}|l,m-1\rangle \right]\nonumber\\ \displaystyle & & \displaystyle \quad +\,Pe_{z}B\sqrt{\frac{2\unicode[STIX]{x03C0}}{15}}\left[(m-3)\langle r,s|Y_{2}^{-1}|l,m\rangle +(m+3)\langle r,s|Y_{2}^{1}|l,m\rangle \right]\nonumber\\ \displaystyle & & \displaystyle \left.\quad +\,\unicode[STIX]{x1D6FF}_{lr}\unicode[STIX]{x1D6FF}_{ms}\left[\frac{1}{\unicode[STIX]{x1D70F}D_{r}}\left(1-\frac{4\unicode[STIX]{x03C0}A_{l}}{(2l+1)}\right)+l(l+1)\right]\right\}=0.\end{eqnarray}$$
In the above equation, the Clebsch–Gordan coefficients
 $$\begin{eqnarray}\langle r,s|Y_{a}^{b}|l,m\rangle =\int \text{d}\,\boldsymbol{p}\,Y_{r}^{s^{\ast }}(\,\boldsymbol{p})Y_{a}^{b}(\,\boldsymbol{p})Y_{l}^{m}(\,\boldsymbol{p}),\end{eqnarray}$$
will be evaluated using the Racah formula (Messiah Reference Messiah1962; Doi & Edwards Reference Doi and Edwards1978; Arfken & Weber Reference Arfken and Weber1999).
Using  $\unicode[STIX]{x1D6FA}_{0}=G(\,\boldsymbol{p})F(z)$ and (A 4) in the following normalization condition (see § 2.1)
 $$\begin{eqnarray}\int \text{d}\,\boldsymbol{p}\,\unicode[STIX]{x1D6FA}=\int \text{d}\,\boldsymbol{p}\,(\unicode[STIX]{x1D6FA}_{0}+\unicode[STIX]{x1D716}\unicode[STIX]{x1D6FA}_{1}+\unicode[STIX]{x1D716}^{2}\unicode[STIX]{x1D6FA}_{2}+\cdots \,)=F,\end{eqnarray}$$
we get
 $$\begin{eqnarray}a_{0,0}=1/\sqrt{4\unicode[STIX]{x03C0}}.\end{eqnarray}$$
Substituting (A 11), in (A 9), we have
 $$\begin{eqnarray}\displaystyle & & \displaystyle \mathop{\sum }_{l=1}^{\infty }\mathop{\sum }_{m=-l}^{l}a_{l,m}\left\{Pe_{z}\frac{\sqrt{\unicode[STIX]{x03C0}}(3-B)}{6}\left[k_{lm}^{\prime }\langle r,s|Y_{0}^{0}|l,m+1\rangle -k_{lm}^{\prime \prime }\langle r,s|Y_{0}^{0}|l,m-1\rangle \right]\right.\nonumber\\ \displaystyle & & \displaystyle \qquad +\,Pe_{z}\left(\frac{B}{3}\right)\sqrt{\frac{4\unicode[STIX]{x03C0}}{5}}\left[k_{lm}^{\prime }\langle r,s|Y_{2}^{0}|l,m+1\rangle -k_{lm}^{\prime \prime }\langle r,s|Y_{2}^{0}|l,m-1\rangle \right]\nonumber\\ \displaystyle & & \displaystyle \qquad +\,Pe_{z}B\sqrt{\frac{2\unicode[STIX]{x03C0}}{15}}\left[(m-3)\langle r,s|Y_{2}^{-1}|l,m\rangle +(m+3)\langle r,s|Y_{2}^{1}|l,m\rangle \right]\nonumber\\ \displaystyle & & \displaystyle \left.\qquad +\,\unicode[STIX]{x1D6FF}_{lr}\unicode[STIX]{x1D6FF}_{ms}\left[\frac{1}{\unicode[STIX]{x1D70F}D_{r}}\left(1-\frac{A_{l}4\unicode[STIX]{x03C0}}{(2l+1)}\right)+l(l+1)\right]\right\}\nonumber\\ \displaystyle & & \displaystyle \quad =Pe_{z}B\sqrt{\frac{3}{10}}\left[\langle r,s|Y_{2}^{-1}|0,0\rangle -\langle r,s|Y_{2}^{1}|0,0\rangle \right].\end{eqnarray}$$
An appropriately truncated version of (A 12) is solved numerically to obtain the  $a_{l,m}$ values, subject to convergence of the orientation distribution.
Now substituting  $\unicode[STIX]{x1D6FA}_{0}=G(\,\boldsymbol{p};Pe_{z})F(z,t_{2})$ in the right-hand side of (2.5), after simplification, we obtain
 $$\begin{eqnarray}Pe_{z}\unicode[STIX]{x1D735}_{p}\boldsymbol{\cdot }(\,\tilde{\dot{\boldsymbol{p}}}\unicode[STIX]{x1D6FA}_{1})+\frac{1}{\unicode[STIX]{x1D70F}D_{r}}\left[\unicode[STIX]{x1D6FA}_{1}-\int \text{d}\,\boldsymbol{p}^{\prime }\,K(\,\boldsymbol{p}/\boldsymbol{p}^{\prime })\unicode[STIX]{x1D6FA}_{1}(\,\boldsymbol{p}^{\prime })\right]-\unicode[STIX]{x1D6FB}_{p}^{2}\unicode[STIX]{x1D6FA}_{1}=-\cos \unicode[STIX]{x1D703}G\frac{\unicode[STIX]{x2202}F}{\unicode[STIX]{x2202}z}-\cos \unicode[STIX]{x1D703}F\frac{\unicode[STIX]{x2202}G}{\unicode[STIX]{x2202}z}.\end{eqnarray}$$
To evaluate  $\unicode[STIX]{x2202}G/\unicode[STIX]{x2202}z$ in the equation above, we first differentiate (2.4) with respect to
 $z$
 $$\begin{eqnarray}Pe_{z}~\unicode[STIX]{x1D735}_{p}\boldsymbol{\cdot }\left(\,\tilde{\dot{\boldsymbol{p}}}\frac{\unicode[STIX]{x2202}G}{\unicode[STIX]{x2202}z}\right)+\frac{1}{\unicode[STIX]{x1D70F}D_{r}}\left[\frac{\unicode[STIX]{x2202}G}{\unicode[STIX]{x2202}z}-\int \text{d}\,\boldsymbol{p}^{\prime }\,K(\,\boldsymbol{p}/\boldsymbol{p}^{\prime })\frac{\unicode[STIX]{x2202}G(\,\boldsymbol{p}^{\prime })}{\unicode[STIX]{x2202}z}\right]-\unicode[STIX]{x1D6FB}_{p}^{2}\frac{\unicode[STIX]{x2202}G}{\unicode[STIX]{x2202}z}=-\frac{\unicode[STIX]{x2202}Pe_{z}}{\unicode[STIX]{x2202}z}\unicode[STIX]{x1D735}_{p}\boldsymbol{\cdot }(\,\tilde{\dot{\boldsymbol{p}}}G).\end{eqnarray}$$
Substituting for  $G$ on the right-hand side, using (A 4), and using the expansion
 $$\begin{eqnarray}\frac{\unicode[STIX]{x2202}G}{\unicode[STIX]{x2202}z}=\mathop{\sum }_{l=0}^{\infty }\mathop{\sum }_{m=-l}^{l}b_{l,m}Y_{l}^{m}(\,\boldsymbol{p})\end{eqnarray}$$
in (A 14), we get
 $$\begin{eqnarray}\displaystyle & & \displaystyle \mathop{\sum }_{l=0}^{\infty }\mathop{\sum }_{m=-l}^{l}b_{l,m}\left[Pe_{z}~\unicode[STIX]{x1D735}_{p}\boldsymbol{\cdot }\left(\,\tilde{\dot{\boldsymbol{p}}}Y_{l}^{m}\right)+\frac{1}{\unicode[STIX]{x1D70F}D_{r}}\left[Y_{l}^{m}-\int \text{d}\,\boldsymbol{p}^{\prime }\,K(\,\boldsymbol{p}/\boldsymbol{p}^{\prime })Y_{l}^{m}(\,\boldsymbol{p}^{\prime })\right]-\unicode[STIX]{x1D6FB}_{p}^{2}Y_{l}^{m}\right]\nonumber\\ \displaystyle & & \displaystyle \quad =-Pe\frac{\unicode[STIX]{x2202}\dot{\unicode[STIX]{x1D6FE}}}{\unicode[STIX]{x2202}z}\mathop{\sum }_{l^{\prime }=0}^{\infty }\mathop{\sum }_{m^{\prime }=-l^{\prime }}^{l^{\prime }}a_{l^{\prime },m^{\prime }}\unicode[STIX]{x1D735}_{p}\boldsymbol{\cdot }(\,\tilde{\dot{\boldsymbol{p}}}Y_{l^{\prime }}^{m^{\prime }}).\end{eqnarray}$$
Differentiating (A 10) with respect to  $z$, using (A 15) and using the orthogonality of spherical harmonics, we get
 $$\begin{eqnarray}b_{0,0}=0.\end{eqnarray}$$
Now, following a procedure analogous to that leading to (A 12), the sequence of linear equations governing the  $b_{l,m}$ values in (A 16) may be written as
 $$\begin{eqnarray}\displaystyle & & \displaystyle \mathop{\sum }_{l=1}^{\infty }\mathop{\sum }_{m=-l}^{l}b_{l,m}\left\{Pe_{z}\left(\frac{\sqrt{\unicode[STIX]{x03C0}}(3-B)}{6}\left[k_{lm}^{\prime }\langle r,s|Y_{0}^{0}|l,m+1\rangle -k_{lm}^{\prime \prime }\langle r,s|Y_{0}^{0}|l,m-1\rangle \right]\right.\right.\nonumber\\ \displaystyle & & \displaystyle \qquad \left.+\,\left(\frac{B}{3}\right)\sqrt{\frac{4\unicode[STIX]{x03C0}}{5}}\left[k_{lm}^{\prime }\langle r,s|Y_{2}^{0}|l,m+1\rangle -k_{lm}^{\prime \prime }\langle r,s|Y_{2}^{0}|l,m-1\rangle \right]\right.\nonumber\\ \displaystyle & & \displaystyle \qquad \left.+\,B\sqrt{\frac{2\unicode[STIX]{x03C0}}{15}}\left[(m-3)\langle r,s|Y_{2}^{-1}|l,m\rangle +(m+3)\langle r,s|Y_{2}^{1}|l,m\rangle \right]\right)\nonumber\\ \displaystyle & & \displaystyle \qquad \left.+\,\unicode[STIX]{x1D6FF}_{lr}\unicode[STIX]{x1D6FF}_{ms}\left[\frac{1}{\unicode[STIX]{x1D70F}D_{r}}\left(1-\frac{A_{l}4\unicode[STIX]{x03C0}}{(2l+1)}\right)+l(l+1)\right]\right\}\nonumber\\ \displaystyle & & \displaystyle \quad =-\mathop{\sum }_{l^{\prime }=0}^{\infty }\mathop{\sum }_{l^{\prime }=-l^{\prime }}^{l}a_{l^{\prime },m^{\prime }}\left\{Pe\frac{\unicode[STIX]{x2202}\dot{\unicode[STIX]{x1D6FE}}}{\unicode[STIX]{x2202}z}\left(\frac{\sqrt{\unicode[STIX]{x03C0}}(3-B)}{6}\left[k_{l^{\prime }m^{\prime }}^{\prime }\langle r,s|Y_{0}^{0}|l^{\prime },m^{\prime }+1\rangle \right.\right.\right.\nonumber\\ \displaystyle & & \displaystyle \qquad \left.\left.-\,k_{l^{\prime }m^{\prime }}^{\prime \prime }\langle r,s|Y_{0}^{0}|l^{\prime },m^{\prime }-1\rangle \right]+\left(\frac{B}{3}\right)\sqrt{\frac{4\unicode[STIX]{x03C0}}{5}}\left[k_{l^{\prime }m^{\prime }}^{\prime }\langle r,s|Y_{2}^{0}|l^{\prime },m^{\prime }+1\rangle \right.\right.\nonumber\\ \displaystyle & & \displaystyle \qquad \left.\left.-\,k_{l^{\prime }m^{\prime }}^{\prime \prime }\langle r,s|Y_{2}^{0}|l^{\prime },m^{\prime }-1\rangle \right]+B\sqrt{\frac{2\unicode[STIX]{x03C0}}{15}}\left[(m^{\prime }-3)\langle r,s|Y_{2}^{-1}|l^{\prime },m^{\prime }\rangle \right.\right.\nonumber\\ \displaystyle & & \displaystyle \qquad \left.\left.\left.+\,(m^{\prime }+3)\langle r,s|Y_{2}^{1}|l^{\prime },m^{\prime }\rangle \right]\right)+\unicode[STIX]{x1D6FF}_{l^{\prime }r}\unicode[STIX]{x1D6FF}_{m^{\prime }s}\left[\frac{1}{\unicode[STIX]{x1D70F}D_{r}}\left(1-\frac{A_{l^{\prime }}4\unicode[STIX]{x03C0}}{(2l^{\prime }+1)}\right)l^{\prime }(l^{\prime }+1)\right]\right\},\qquad \quad\end{eqnarray}$$
where,  $k_{l^{\prime }m^{\prime }}^{\prime }=\sqrt{l^{\prime }(l^{\prime }+1)-m^{\prime }(m^{\prime }+1)}$ and
 $k_{l^{\prime }m^{\prime }}^{\prime \prime }=\sqrt{l^{\prime }(l^{\prime }+1)-m^{\prime }(m^{\prime }-1)}$. One can solve the system of linear equations (A 18) to determine
 $dG/\,\text{d}z$ as a truncated version of (A 15).
To solve for  $\unicode[STIX]{x1D6FA}_{1}$ in (2.5), on account of linearity, we first write
 $$\begin{eqnarray}\unicode[STIX]{x1D6FA}_{1}=\unicode[STIX]{x1D6FA}_{11}\frac{\unicode[STIX]{x2202}F}{\unicode[STIX]{x2202}z}+\unicode[STIX]{x1D6FA}_{12}F,\end{eqnarray}$$
and equating the coefficients of  $\unicode[STIX]{x2202}F/\unicode[STIX]{x2202}z$ and
 $F$ on both sides, we get the following equations governing
 $\unicode[STIX]{x1D6FA}_{11}$ and
 $\unicode[STIX]{x1D6FA}_{12}$:
 $$\begin{eqnarray}\displaystyle & \displaystyle Pe_{z}\unicode[STIX]{x1D735}_{p}\boldsymbol{\cdot }(\,\tilde{\dot{\boldsymbol{p}}}\unicode[STIX]{x1D6FA}_{11})+\frac{1}{\unicode[STIX]{x1D70F}D_{r}}\left[\unicode[STIX]{x1D6FA}_{11}-\int \text{d}\,\boldsymbol{p}^{\prime }\,K(\,\boldsymbol{p}/\boldsymbol{p}^{\prime })\unicode[STIX]{x1D6FA}_{11}(\,\boldsymbol{p}^{\prime })\right]-\unicode[STIX]{x1D6FB}_{p}^{2}\unicode[STIX]{x1D6FA}_{11}=-\cos \unicode[STIX]{x1D703}G,\qquad & \displaystyle\end{eqnarray}$$
 $$\begin{eqnarray}\displaystyle & \displaystyle Pe_{z}\unicode[STIX]{x1D735}_{p}\boldsymbol{\cdot }(\,\tilde{\dot{\boldsymbol{p}}}\unicode[STIX]{x1D6FA}_{12})+\frac{1}{\unicode[STIX]{x1D70F}D_{r}}\left[\unicode[STIX]{x1D6FA}_{12}-\int \text{d}\,\boldsymbol{p}^{\prime }K(\,\boldsymbol{p}/\boldsymbol{p}^{\prime })\unicode[STIX]{x1D6FA}_{12}(\,\boldsymbol{p}^{\prime })\right]-\unicode[STIX]{x1D6FB}_{p}^{2}\unicode[STIX]{x1D6FA}_{12}=-\cos \unicode[STIX]{x1D703}\frac{\unicode[STIX]{x2202}G}{\unicode[STIX]{x2202}z}.\qquad & \displaystyle\end{eqnarray}$$
Expanding
 $$\begin{eqnarray}\displaystyle & \displaystyle \unicode[STIX]{x1D6FA}_{11}=\mathop{\sum }_{l=0}^{\infty }\mathop{\sum }_{m=-l}^{l}c_{l,m}Y_{l}^{m}, & \displaystyle\end{eqnarray}$$
 $$\begin{eqnarray}\displaystyle & \displaystyle \unicode[STIX]{x1D6FA}_{12}=\mathop{\sum }_{l=0}^{\infty }\mathop{\sum }_{m=-l}^{l}d_{l,m}Y_{l}^{m}, & \displaystyle\end{eqnarray}$$
using (A 19) in (A 10) and using the orthogonality of spherical harmonics, we get
 $$\begin{eqnarray}c_{0,0}=d_{0,0}=0.\end{eqnarray}$$
From (A 4), (A 15), (A 10), (A 18), (A 22), (A 23) and following the numerical scheme adopted for solving (A 14), we obtain the unknown coefficients  $c_{l,m}$ and
 $d_{l,m}$.
Using (A 19), (A 22), (A 23) in (2.6), integrating over the orientation degrees of freedom and using  $\int \text{d}\,\boldsymbol{p}\,\unicode[STIX]{x1D6FA}_{0}(\,\boldsymbol{p})=F$ (from (A 10)), we get the drift-diffusion equation describing the evolution of swimmer concentration profile
 $$\begin{eqnarray}\frac{\unicode[STIX]{x2202}F}{\unicode[STIX]{x2202}t_{2}}=\frac{\unicode[STIX]{x2202}}{\unicode[STIX]{x2202}z}\left(D_{zz}\frac{\unicode[STIX]{x2202}F}{\unicode[STIX]{x2202}z}-V_{z}F\right)\end{eqnarray}$$
in terms of the slow time variable  $t_{2}$, and with the drift and diffusivity coefficients being defined by
 $$\begin{eqnarray}D_{zz}=-\int \text{d}\,\boldsymbol{p}\cos \unicode[STIX]{x1D703}\unicode[STIX]{x1D6FA}_{11}=-2\sqrt{\frac{\unicode[STIX]{x03C0}}{3}}c_{1,0}\end{eqnarray}$$
and
 $$\begin{eqnarray}V_{z}=\int \text{d}\,\boldsymbol{p}\cos \unicode[STIX]{x1D703}\unicode[STIX]{x1D6FA}_{12}=2\sqrt{\frac{\unicode[STIX]{x03C0}}{3}}d_{1,0}.\end{eqnarray}$$
The drift-diffusion equation (A 25) appears as (2.7) in § 2.1. The truncation in the above sequences of equations is such as to ensure converged values for the  $D_{zz}$ and
 $V_{z}$. The truncated system has
 $l=L_{max}$. For
 $\unicode[STIX]{x1D705}=1.25,~2$ and 4, reported in the manuscript, we chose
 $L_{max}=40$; for the other aspect ratios, we chose
 $L_{max}=40$ and 80 for
 $Pe<200$ and
 $Pe\geqslant 200$, respectively.
We calculate the steady state swimmer concentration profile satisfying (A 25), while imposing the zero-flux condition at the boundaries, which leads to
 $$\begin{eqnarray}D_{zz}\frac{\text{d}F}{\text{d}z}-V_{z}F=0,\end{eqnarray}$$
at  $z=\pm 1$.
The solution of the above first-order ordinary differential equation can be expressed as:
 $$\begin{eqnarray}F(z)=\aleph \exp \left(\int _{-1}^{z}\,\text{d}z^{\prime }\frac{V_{z}(z^{\prime })}{D_{zz}(z^{\prime })}\right),\end{eqnarray}$$
which appears as (2.8) in § 2.1. In (A 29), the normalization constant  $\aleph$ can be calculated while imposing the condition
 $\int _{-1}^{1}\,\text{d}z\,F(z)=1$, which leads to
 $$\begin{eqnarray}\aleph =\frac{1}{\int _{-1}^{1}\,\text{d}z\exp \left(\int _{-1}^{z}\,\text{d}z^{\prime }\frac{V_{z}(z^{\prime })}{D_{zz}(z^{\prime })}\right)}.\end{eqnarray}$$
We evaluate the integrals in (A 29) and (A 30) using Simpson’s rule.
Appendix B. Small-$Pe$ expansion for the swimmer concentration profile

Herein, we obtain a closed-form analytical expression for the swimmer concentration, to  $O(Pe^{2})$. The orientation probability density at each order (in
 $\unicode[STIX]{x1D716}$) in the multiple scale analysis (see § 2.1) is further expanded in powers of
 $Pe$ to
 $O(Pe^{2})$. Thus, the probability densities of
 $O(1)$ (
 $G$ in (2.4)), and at
 $O(\unicode[STIX]{x1D716})$ (
 $\unicode[STIX]{x1D6FA}_{1}$ in (2.5)) are expanded to
 $O(Pe^{2})$, with the imposition of the normalization condition:
 $\int \text{d}\,\boldsymbol{p}\,\unicode[STIX]{x1D6FA}=F(z)$. Here, and in appendix C, we choose a coordinate system different from the one used in § 2.1 (figure 1), such that the polar (
 $\unicode[STIX]{x1D703}$) and azimuthal (
 $\unicode[STIX]{x1D719}$) angles are measured from the negative vorticity and flow axes, respectively. We first consider the probability density at leading order in the multiple scale analysis, and expand it about the isotropic orientation distribution, for
 $Pe\ll 1$, as:
 $$\begin{eqnarray}G=G_{0}+PeG_{1}+Pe^{2}G_{2}+\cdots \,,\end{eqnarray}$$
with  $G_{0}=1/4\unicode[STIX]{x03C0}$.
At successive orders in  $Pe$, we obtain
 $$\begin{eqnarray}\displaystyle & \displaystyle \mathit{O}(Pe):\frac{1}{\unicode[STIX]{x1D70F}D_{r}}\left[G_{1}-\int \text{d}\,\boldsymbol{p}^{\prime }\,K(\,\boldsymbol{p}/\boldsymbol{p}^{\prime })G_{1}(\,\boldsymbol{p}^{\prime })\right]-\unicode[STIX]{x1D6FB}_{p}^{2}G_{1}=-\frac{\dot{\unicode[STIX]{x1D6FE}}}{4\unicode[STIX]{x03C0}}\unicode[STIX]{x1D735}_{p}\boldsymbol{\cdot }(\tilde{\dot{\boldsymbol{p}}}), & \displaystyle\end{eqnarray}$$
 $$\begin{eqnarray}\displaystyle & \displaystyle \mathit{O}(Pe^{2}):\frac{1}{\unicode[STIX]{x1D70F}D_{r}}\left[G_{2}-\int \text{d}\,\boldsymbol{p}^{\prime }\,K(\,\boldsymbol{p}/\boldsymbol{p}^{\prime })G_{2}(\,\boldsymbol{p}^{\prime })\right]-\unicode[STIX]{x1D6FB}_{p}^{2}G_{2}=-\dot{\unicode[STIX]{x1D6FE}}\unicode[STIX]{x1D735}_{p}\boldsymbol{\cdot }(G_{1}\tilde{\dot{\boldsymbol{p}}}). & \displaystyle\end{eqnarray}$$
We solve (B 2) for  $G_{1}$, by using the modified Green’s function
 ${\mathcal{G}}_{M}^{I}(\,\boldsymbol{p}/\boldsymbol{p}^{\prime })$ (Subramanian & Koch Reference Subramanian and Koch2009) which satisfies
 $$\begin{eqnarray}\frac{1}{\unicode[STIX]{x1D70F}D_{r}}\left[{\mathcal{G}}_{M}^{I}(\,\boldsymbol{p}/\boldsymbol{p}^{\prime })-\int \text{d}\,\boldsymbol{p}^{\prime \prime }\,K(\,\boldsymbol{p}/\boldsymbol{p}^{\prime \prime }){\mathcal{G}}_{M}^{I}(\,\boldsymbol{p}^{\prime \prime }/\boldsymbol{p})\right]-\unicode[STIX]{x1D6FB}_{p}^{2}{\mathcal{G}}_{M}^{I}(\,\boldsymbol{p}/\boldsymbol{p}^{\prime })=\unicode[STIX]{x1D6FF}(\,\boldsymbol{p}-\boldsymbol{p}^{\prime })-\frac{1}{4\unicode[STIX]{x03C0}},\end{eqnarray}$$
where  $\unicode[STIX]{x1D6FF}(\,\boldsymbol{p})$ denotes the Dirac delta function in orientation space, with the forcing in (B 4) being a localized source at an orientation
 $\boldsymbol{p}^{\prime }$, together with a compensating uniformly distributed sink over the remainder of the unit sphere. The modified Green’s function result given in Subramanian & Koch (Reference Subramanian and Koch2009), derived for the rotary diffusion of swimmers can be easily generalized to the case of run-and-tumble plus rotary diffusion, so as to arrive at the following expression for
 ${\mathcal{G}}_{M}^{I}(\,\boldsymbol{p}/\boldsymbol{p}^{\prime })$ as:
 $$\begin{eqnarray}{\mathcal{G}}_{M}^{I}(\,\boldsymbol{p}/\boldsymbol{p}^{\prime })=\mathop{\sum }_{n=1}^{\infty }\mathop{\sum }_{m=-n}^{n}\frac{Y_{n}^{m^{\ast }}(\,\boldsymbol{p}^{\prime })}{D_{n}}Y_{n}^{m}(\,\boldsymbol{p}),\end{eqnarray}$$
where  $D_{n}=[1/\unicode[STIX]{x1D70F}D_{r}(1-(4\unicode[STIX]{x03C0}A_{n}/2n+1))+n(n+1)]$.
Using the expression for  ${\mathcal{G}}_{M}^{I}(\,\boldsymbol{p}/\boldsymbol{p}^{\prime })$ in (B 5), the orientation probability density
 $G_{1}$, at
 $O(Pe)$, may be written as:
 $$\begin{eqnarray}\displaystyle G_{1}(\boldsymbol{p}) & = & \displaystyle -\frac{\dot{\unicode[STIX]{x1D6FE}}}{4\unicode[STIX]{x03C0}}\int \text{d}\,\boldsymbol{p}^{\prime }\,{\mathcal{G}}_{M}^{I}(\,\boldsymbol{p}/\boldsymbol{p}^{\prime })\unicode[STIX]{x1D735}_{p}\boldsymbol{\cdot }(\tilde{\dot{\boldsymbol{p}}}(\,\boldsymbol{p}^{\prime }))\nonumber\\ \displaystyle & = & \displaystyle \frac{3B\dot{\unicode[STIX]{x1D6FE}}}{4\unicode[STIX]{x03C0}}\mathop{\sum }_{l=1}^{\infty }\mathop{\sum }_{m=-l}^{l}\frac{Y_{l}^{m}(\,\boldsymbol{p})}{D_{l}}\int \text{d}\,\boldsymbol{p}^{\prime }\,Y_{l}^{m^{\ast }}(\,\boldsymbol{p}^{\prime })p_{1}^{\prime }p_{3}^{\prime }\nonumber\\ \displaystyle & = & \displaystyle \frac{3i\dot{\unicode[STIX]{x1D6FE}}B}{4\unicode[STIX]{x03C0}D_{2}}\sqrt{\frac{2\unicode[STIX]{x03C0}}{15}}(Y_{2}^{-2}-Y_{2}^{2}).\end{eqnarray}$$
Similarly, using the modified Green’s function, the solution of (B 3) may also be expressed as:
 $$\begin{eqnarray}G_{2}(\boldsymbol{p})=-\dot{\unicode[STIX]{x1D6FE}}\int \text{d}\,\boldsymbol{p}^{\prime }\,{\mathcal{G}}_{M}^{I}(\,\boldsymbol{p}/\boldsymbol{p}^{\prime })\unicode[STIX]{x1D735}_{p}\boldsymbol{\cdot }(G_{1}(\,\boldsymbol{p}^{\prime })\tilde{\dot{\boldsymbol{p}}}(\,\boldsymbol{p}^{\prime })).\end{eqnarray}$$
Again, using (B 5), (B 6) in the above equation, expressing  $\unicode[STIX]{x1D735}_{p}\boldsymbol{\cdot }(G_{1}\tilde{\dot{\boldsymbol{p}}})$ in terms of spherical harmonics and using the orthogonality of the latter, we get
 $$\begin{eqnarray}G_{2}=\frac{\dot{\unicode[STIX]{x1D6FE}}^{2}B}{2D_{2}^{2}}\sqrt{\frac{3}{10\unicode[STIX]{x03C0}}}(Y_{2}^{-2}+Y_{2}^{2})-\frac{3\dot{\unicode[STIX]{x1D6FE}}^{2}B^{2}}{14D_{2}^{2}\sqrt{5\unicode[STIX]{x03C0}}}Y_{2}^{0}-\frac{\dot{\unicode[STIX]{x1D6FE}}^{2}B^{2}}{2D_{2}D_{4}}\sqrt{\!\frac{5}{14\unicode[STIX]{x03C0}}}(Y_{4}^{-4}+Y_{4}^{4})+\frac{\dot{\unicode[STIX]{x1D6FE}}^{2}B^{2}}{14\sqrt{\unicode[STIX]{x03C0}}D_{2}D_{4}}Y_{4}^{0}.\end{eqnarray}$$
From (B 1), (B 6) and (B 8), we obtain the small  $Pe$ of the leading-order orientation probability density,
 $G(\,\boldsymbol{p})$, to
 $O(Pe^{2})$ as:
 $$\begin{eqnarray}\displaystyle G & = & \displaystyle \frac{1}{4\unicode[STIX]{x03C0}}+Pe\frac{3i\dot{\unicode[STIX]{x1D6FE}}B}{4\unicode[STIX]{x03C0}D_{2}}\sqrt{\frac{2\unicode[STIX]{x03C0}}{15}}(Y_{2}^{-2}-Y_{2}^{2})\nonumber\\ \displaystyle & & \displaystyle +\,Pe^{2}\left[\frac{\dot{\unicode[STIX]{x1D6FE}}^{2}B}{2D_{2}^{2}}\sqrt{\frac{3}{10\unicode[STIX]{x03C0}}}(Y_{2}^{-2}+Y_{2}^{2})-\frac{3\dot{\unicode[STIX]{x1D6FE}}^{2}B^{2}}{14D_{2}^{2}\sqrt{5\unicode[STIX]{x03C0}}}Y_{2}^{0}\right.\nonumber\\ \displaystyle & & \displaystyle \left.-\,\frac{\dot{\unicode[STIX]{x1D6FE}}^{2}B^{2}}{2D_{2}D_{4}}\sqrt{\frac{5}{14\unicode[STIX]{x03C0}}}(Y_{4}^{-4}+Y_{4}^{4})+\frac{\dot{\unicode[STIX]{x1D6FE}}^{2}B^{2}}{14\sqrt{\unicode[STIX]{x03C0}}D_{2}D_{4}}Y_{4}^{0}\right].\end{eqnarray}$$
Now, considering the equation at  $O(\unicode[STIX]{x1D716})$, given by (2.5), and expanding the unknown probability density as:
 $$\begin{eqnarray}\unicode[STIX]{x1D6FA}_{1}=\unicode[STIX]{x1D6FA}_{10}+Pe\unicode[STIX]{x1D6FA}_{11}+Pe^{2}\unicode[STIX]{x1D6FA}_{12}+\cdots \,,\end{eqnarray}$$
leads to the following three equations at successive orders in  $Pe$
 $$\begin{eqnarray}\displaystyle & \!\!\displaystyle \mathit{O}(\unicode[STIX]{x1D716}):\frac{1}{\unicode[STIX]{x1D70F}D_{r}}\left[\unicode[STIX]{x1D6FA}_{10}-\int \text{d}\,\boldsymbol{p}^{\prime }\,K(\,\boldsymbol{p}/\boldsymbol{p}^{\prime })\unicode[STIX]{x1D6FA}_{10}(\,\boldsymbol{p}^{\prime })\right]-\unicode[STIX]{x1D6FB}_{p}^{2}\unicode[STIX]{x1D6FA}_{10}=-\boldsymbol{p}\boldsymbol{\cdot }\unicode[STIX]{x1D735}_{\boldsymbol{x}}(FG_{0}), & \displaystyle\end{eqnarray}$$
 $$\begin{eqnarray}\displaystyle & \!\!\displaystyle \mathit{O}(\unicode[STIX]{x1D716}Pe):\frac{1}{\unicode[STIX]{x1D70F}D_{r}}\!\left[\unicode[STIX]{x1D6FA}_{11}-\int \text{d}\,\boldsymbol{p}^{\prime }\,K(\,\boldsymbol{p}/\boldsymbol{p}^{\prime })\unicode[STIX]{x1D6FA}_{11}(\,\boldsymbol{p}^{\prime })\right]\!-\unicode[STIX]{x1D6FB}_{p}^{2}\unicode[STIX]{x1D6FA}_{11}=-\boldsymbol{p}\boldsymbol{\cdot }\unicode[STIX]{x1D735}_{\boldsymbol{x}}(FG_{1})-\unicode[STIX]{x1D735}_{p}\boldsymbol{\cdot }(\dot{\boldsymbol{p}}\unicode[STIX]{x1D6FA}_{10}), & \displaystyle \nonumber\\ \displaystyle & & \displaystyle\end{eqnarray}$$
 $$\begin{eqnarray}\displaystyle & \!\!\!\displaystyle \mathit{O}(\unicode[STIX]{x1D716}Pe^{2}):\frac{1}{\unicode[STIX]{x1D70F}D_{r}}\!\left[\unicode[STIX]{x1D6FA}_{12}-\!\int \text{d}\,\boldsymbol{p}^{\prime }\,K(\,\boldsymbol{p}/\boldsymbol{p}^{\prime })\unicode[STIX]{x1D6FA}_{12}(\,\boldsymbol{p}^{\prime })\right]\!-\unicode[STIX]{x1D6FB}_{p}^{2}\unicode[STIX]{x1D6FA}_{12}=-\boldsymbol{p}\boldsymbol{\cdot }\unicode[STIX]{x1D735}_{\boldsymbol{x}}(FG_{2})-\unicode[STIX]{x1D735}_{p}\boldsymbol{\cdot }(\dot{\boldsymbol{p}}\unicode[STIX]{x1D6FA}_{11}). & \displaystyle \nonumber\\ \displaystyle & & \displaystyle\end{eqnarray}$$
The solutions of (B 11) and (B 12) may again be expressed as a convolution involving the modified Green’s function. Using the modified Green’s function (B 5) and  $G_{0}=1/4\unicode[STIX]{x03C0}$ in (B 11), we have
 $$\begin{eqnarray}\unicode[STIX]{x1D6FA}_{10}=-\frac{\text{i}}{4\unicode[STIX]{x03C0}D_{1}}\sqrt{\frac{2\unicode[STIX]{x03C0}}{3}}(Y_{1}^{-1}+Y_{1}^{1})\frac{\unicode[STIX]{x2202}F}{\unicode[STIX]{x2202}z}.\end{eqnarray}$$
Using (B 6) for  $G_{0}$, (B 14) for
 $\unicode[STIX]{x1D6FA}_{10}$, and the modified Green’s function (B 5), the unknown probability density in (B 12) can be expressed as:
 $$\begin{eqnarray}\displaystyle \unicode[STIX]{x1D6FA}_{11} & = & \displaystyle \frac{\left[6D_{1}(-2F+\frac{\unicode[STIX]{x2202}F}{\unicode[STIX]{x2202}z}\dot{\unicode[STIX]{x1D6FE}})B+\dot{\unicode[STIX]{x1D6FE}}D_{2}\frac{\unicode[STIX]{x2202}F}{\unicode[STIX]{x2202}z}(5+3B)\right]}{20D_{1}^{2}D_{2}\sqrt{6\unicode[STIX]{x03C0}}}(Y_{1}^{-1}-Y_{1}^{1})\nonumber\\ \displaystyle & & \displaystyle +\,\frac{\left[-6D_{1}F+(3D_{1}+4D_{2})\dot{\unicode[STIX]{x1D6FE}}\frac{\unicode[STIX]{x2202}F}{\unicode[STIX]{x2202}z}\right]B}{20D_{1}D_{2}D_{3}\sqrt{21\unicode[STIX]{x03C0}}}(Y_{3}^{-1}-Y_{3}^{1})\nonumber\\ \displaystyle & & \displaystyle +\,\frac{\left[-6D_{1}F+(3D_{1}+4D_{2})\frac{\unicode[STIX]{x2202}F}{\unicode[STIX]{x2202}z}\dot{\unicode[STIX]{x1D6FE}}\right]B}{4\sqrt{35\unicode[STIX]{x03C0}}D_{1}D_{2}D_{3}}(Y_{3}^{-3}-Y_{3}^{3}).\end{eqnarray}$$
Similarly, using (B 8) for  $G_{2}$, (B 15) for
 $\unicode[STIX]{x1D6FA}_{11}$ and the modified Green’s function (B 5), the unknown probability density in (B 13) can be expressed as:
 $$\begin{eqnarray}\displaystyle \unicode[STIX]{x1D6FA}_{12} & = & \displaystyle \frac{i\dot{\unicode[STIX]{x1D6FE}}}{1400D_{1}^{3}D_{2}^{2}D_{3}\sqrt{6\unicode[STIX]{x03C0}}}\left[60BD_{1}^{2}D_{3}(4F-\frac{\unicode[STIX]{x2202}F}{\unicode[STIX]{x2202}z}\dot{\unicode[STIX]{x1D6FE}})(-7+B)\right.\nonumber\\ \displaystyle & & \displaystyle \left.+\,B_{2}^{2}\frac{\unicode[STIX]{x2202}F}{\unicode[STIX]{x2202}z}\dot{\unicode[STIX]{x1D6FE}}\left(128B^{2}B_{1}-7B_{3}(-25+9B^{2})\right)\right.\nonumber\\ \displaystyle & & \displaystyle \left.-\,6BD_{1}D_{2}(2F-\frac{\unicode[STIX]{x2202}F}{\unicode[STIX]{x2202}z})(16BD_{1}-7D_{3}(-5+3B))\right](Y_{1}^{-1}+Y_{1}^{1})+(\cdot \cdot )((Y_{3}^{-1}+Y_{3}^{1}))\nonumber\\ \displaystyle & & \displaystyle +\,(\cdots \,)(Y_{3}^{-3}+Y_{3}^{3})+(\cdot \cdot )((Y_{5}^{-1}+Y_{5}^{1}))+(\cdots \,)(Y_{5}^{-3}+Y_{5}^{3})+(\cdots \,)(Y_{5}^{-5}+Y_{5}^{5}).\nonumber\\ \displaystyle & & \displaystyle\end{eqnarray}$$
In the above equation, we only mention the coefficients of  $(Y_{1}^{-1}+Y_{1}^{1})$, since only these contribute to the drift, diffusivity, and hence the swimmer concentration profile (see (B 18) below).
Considering (2.6), integrating over the orientation degrees of freedom and using the normalization condition  $\int \text{d}\,\boldsymbol{p}\unicode[STIX]{x1D6FA}_{0}=F$ (see (A 10)), we get
 $$\begin{eqnarray}\frac{\unicode[STIX]{x2202}F}{\unicode[STIX]{x2202}t_{2}}=-\int \text{d}\,\boldsymbol{p}\frac{\unicode[STIX]{x2202}\unicode[STIX]{x1D6FA}_{1}}{\unicode[STIX]{x2202}z}p_{3}.\end{eqnarray}$$
Expressing  $p_{3}$ in terms of spherical harmonics, we have
 $$\begin{eqnarray}\frac{\unicode[STIX]{x2202}F}{\unicode[STIX]{x2202}t_{2}}=-\text{i}\sqrt{\frac{2\unicode[STIX]{x03C0}}{3}}\int \text{d}\,\boldsymbol{p}\,(Y_{1}^{-1}+Y_{1}^{1})\frac{\unicode[STIX]{x2202}}{\unicode[STIX]{x2202}z}\left(\unicode[STIX]{x1D6FA}_{10}+Pe\unicode[STIX]{x1D6FA}_{11}+Pe^{2}\unicode[STIX]{x1D6FA}_{12}+\cdots \,\right).\end{eqnarray}$$
From orthogonality, only the coefficients of  $(Y_{1}^{-1}+Y_{1}^{1})$, in
 $\unicode[STIX]{x1D6FA}_{10},\unicode[STIX]{x1D6FA}_{11}$ and
 $\unicode[STIX]{x1D6FA}_{12}$, survive. Substituting for
 $\unicode[STIX]{x1D6FA}_{10},\unicode[STIX]{x1D6FA}_{11}$,
 $\unicode[STIX]{x1D6FA}_{12}$ from (B 14), (B 15), (B 16), the shear rate profile for the parabolic flow,
 $\dot{\unicode[STIX]{x1D6FE}}=-2z$, and evaluating the orientation-space integrals, we get
 $$\begin{eqnarray}\frac{\unicode[STIX]{x2202}F}{\unicode[STIX]{x2202}t_{2}}=\frac{\unicode[STIX]{x2202}}{\unicode[STIX]{x2202}z}\left[\left(D_{zz}^{(0)}+Pe^{2}D_{zz}^{(2)}+\cdots \,\right)\frac{\unicode[STIX]{x2202}F}{\unicode[STIX]{x2202}z}-\left(V_{z}^{(0)}+Pe^{2}V_{z}^{(2)}+\cdots \,\right)F\right],\end{eqnarray}$$
where
 $$\begin{eqnarray}\displaystyle D_{zz}^{(0)} & = & \displaystyle \frac{1}{3D_{1}},\nonumber\\ \displaystyle D_{zz}^{(2)} & = & \displaystyle \frac{\left[60D_{1}^{2}D_{3}(-7+B)B-6D_{1}D_{2}B\left(16D_{1}B-7D_{3}(-5+3B)\right)\right]z^{2}}{525D_{1}^{3}D_{2}^{2}D_{3}}\nonumber\\ \displaystyle & & \displaystyle +\,\frac{\left[D_{2}^{2}\left(-128B^{2}D_{1}+7D_{3}(-25+9B^{2})\right)\right]z^{2}}{525D_{1}^{3}D_{2}^{2}D_{3}},\nonumber\\ \displaystyle V_{z}^{(0)} & = & \displaystyle 0,\nonumber\\ \displaystyle V_{z}^{(2)} & = & \displaystyle -\frac{2B\left[7D_{2}D_{3}(-5+3B)+4D_{1}\left(5D_{3}(-7+B)-4D_{2}B\right)\right]z}{175D_{1}^{2}D_{2}^{2}D_{3}}.\nonumber\end{eqnarray}$$
In (B 19), the odd orders in  $Pe$ do not contribute, as must be the case, so the concentration profile is invariant to flow reversal. We therefore expand the swimmer concentration as
 $F=F^{(0)}+Pe^{2}F^{(2)}+\cdots \,$. Substituting this expansion in (B 19), imposing the zero-flux condition at the boundaries (
 $z=\pm 1$), we get
 $$\begin{eqnarray}D_{zz}^{(0)}\frac{\unicode[STIX]{x2202}F^{(0)}}{\unicode[STIX]{x2202}z}+Pe^{2}\left(D_{zz}^{(0)}\frac{\unicode[STIX]{x2202}F^{(2)}}{\unicode[STIX]{x2202}z}+D_{zz}^{(2)}\frac{\unicode[STIX]{x2202}F^{(0)}}{\unicode[STIX]{x2202}z}-V_{z}^{(2)}F^{(0)}\right)+\cdots =0.\end{eqnarray}$$
At successive orders in  $Pe$, we obtain
 $$\begin{eqnarray}\displaystyle & \displaystyle O(1):D_{zz}^{(0)}\frac{\unicode[STIX]{x2202}F^{(0)}}{\unicode[STIX]{x2202}z}=0, & \displaystyle\end{eqnarray}$$
 $$\begin{eqnarray}\displaystyle & \displaystyle O(Pe^{2}):D_{zz}^{(0)}\frac{\unicode[STIX]{x2202}F^{(2)}}{\unicode[STIX]{x2202}z}=-D_{zz}^{(2)}\frac{\unicode[STIX]{x2202}F^{(0)}}{\unicode[STIX]{x2202}z}+V_{z}^{(2)}F^{(0)}. & \displaystyle\end{eqnarray}$$
Using (B 21) in (B 22), the leading-order inhomogeneity ( $F^{(2)}$) is independent of the correction to the diffusivity and the
 $O(Pe^{2})$ drift alone dictates the inhomogeneity. It is nevertheless worth noting that
 $D_{zz}^{(2)}$ exhibits a profile consistent with physical arguments – the fact that it is negative, and larger closer to the walls, where the transverse diffusivity is suppressed due to increasing flow alignment of the swimmer. Although not relevant to the steady state,
 $D_{zz}^{(2)}$ will influence the transient evolution from a generic initial condition.
Solving (B 21) and (B 22) for  $F^{(0)}$ and
 $F^{(2)}$, while imposing the normalization condition of swimmer concentration
 $\int _{-1}^{1}\,\text{d}zF\,(z)=\int _{-1}^{1}\,\text{d}z\,(F^{(0)}+Pe^{2}F^{(2)}+\cdots \,)=1$, we get
 $$\begin{eqnarray}F(z)=F^{(0)}+Pe^{2}F^{(2)}(z)+\cdots ={\textstyle \frac{1}{2}}-Pe^{2}K_{2}(3z^{2}-1)-\cdots \,,\end{eqnarray}$$
where
 $$\begin{eqnarray}K_{2}=\frac{B\left[7D_{2}D_{3}(-5+3B)+4D_{1}(5D_{3}(-7+B)-4BD_{2})\right]}{350D_{1}D_{2}^{2}D_{3}},\end{eqnarray}$$
with  $B$ as the Bretherton constant and
 $D_{i}$ being given by (B 5). The comparison of the numerical and the analytical profiles of
 $F^{(2)}(z)$ for swimmers with
 $\unicode[STIX]{x1D705}=15$ (
 $B=0.991$) and for different
 $Pe$ is given in figure 2(a) (inset) of § 3.1.
Appendix C. Concentration profile for the near-spherical swimmers
In the following, we obtain an analytical expression for the swimmer concentration profile, for an arbitrary  $Pe$, but for near-spherical swimmers which correspond to an asymptotically small Bretherton constant (
 $B\ll 1$). As we did in appendix B, we start from the small-
 $\unicode[STIX]{x1D716}$ expansion of probability density (
 $\unicode[STIX]{x1D6FA}$) in the multiple scale analysis, and expand the probability densities at each order in
 $\unicode[STIX]{x1D716}$,
 $G$ in (2.4) at
 $O(1)$, and
 $\unicode[STIX]{x1D6FA}_{1}$ in (2.5) at
 $O(\unicode[STIX]{x1D716})$, to
 $O(B)$, while also imposing the normalization condition:
 $\int \text{d}\,\boldsymbol{p}\,\unicode[STIX]{x1D6FA}=F(z)$. To begin with, consider the governing equation (2.4) for
 $G$
 $$\begin{eqnarray}\frac{1}{\unicode[STIX]{x1D70F}D_{r}}\left[G-\int \text{d}\,\boldsymbol{p}^{\prime }\,K(\,\boldsymbol{p}/\boldsymbol{p}^{\prime })G(\,\boldsymbol{p}^{\prime })\right]-\unicode[STIX]{x1D6FB}_{p}^{2}G+Pe_{z}~\unicode[STIX]{x1D735}_{p}\boldsymbol{\cdot }(\dot{\tilde{\boldsymbol{p}}}^{I}G)=-Pe_{z}~\unicode[STIX]{x1D735}_{p}\boldsymbol{\cdot }(\dot{\tilde{\boldsymbol{p}}}^{II}G),\end{eqnarray}$$
where  $\dot{\tilde{\boldsymbol{p}}}^{I}=\boldsymbol{W}\boldsymbol{\cdot }\boldsymbol{p}/\dot{\unicode[STIX]{x1D6FE}}$,
 $\dot{\tilde{\boldsymbol{p}}}^{II}=B[\boldsymbol{E}\boldsymbol{\cdot }\boldsymbol{p}-\boldsymbol{p}(\boldsymbol{E}\boldsymbol{ : }\boldsymbol{p}\boldsymbol{p})]/\dot{\unicode[STIX]{x1D6FE}}$, represent the rotation rates of the swimmer at
 $O(1)$ and
 $O(B)$, respectively, due to the local ambient vorticity and rate of strain. In (C 1), for near-spherical swimmers, we expand
 $G$ in the parameter
 $B$, about the spatially homogeneous isotropically oriented base state
 $$\begin{eqnarray}G=G_{0}+BG_{1}+\cdots \,.\end{eqnarray}$$
At leading order, one obtains the isotropically oriented state of spherical swimmers that spin at a uniform rate with the ambient vorticity. Thus,  $G_{0}=1/4\unicode[STIX]{x03C0}$. At
 $O(B)$, we have the following governing equation for
 $G_{1}$:
 $$\begin{eqnarray}\frac{1}{\unicode[STIX]{x1D70F}D_{r}}\left[G_{1}-\int \text{d}\,\boldsymbol{p}^{\prime }\,K(\,\boldsymbol{p}/\boldsymbol{p}^{\prime })G_{1}(\,\boldsymbol{p}^{\prime })\right]-\unicode[STIX]{x1D6FB}_{p}^{2}G_{1}+Pe_{z}\unicode[STIX]{x1D735}_{p}\boldsymbol{\cdot }(\dot{\tilde{\boldsymbol{p}}}^{I}G_{1})=-Pe_{z}\unicode[STIX]{x1D735}_{p}\boldsymbol{\cdot }(\dot{\tilde{\boldsymbol{p}}}^{II}G_{0}).\end{eqnarray}$$
To solve the above equation for  $G_{1}$, we again seek a modified Green’s function
 ${\mathcal{G}}_{M}^{II}(\,\boldsymbol{p}/\boldsymbol{p}^{\prime })$, that satisfies
 $$\begin{eqnarray}\displaystyle & & \displaystyle \!\!\frac{1}{\unicode[STIX]{x1D70F}D_{r}}\!\left[{\mathcal{G}}_{M}^{II}(\,\boldsymbol{p}/\boldsymbol{p}^{\prime })-\int \text{d}\,\boldsymbol{p}^{\prime \prime }\,K(\,\boldsymbol{p}/\boldsymbol{p}^{\prime \prime }){\mathcal{G}}_{M}^{II}(\,\boldsymbol{p}^{\prime \prime }/\boldsymbol{p}^{\prime })\right]-\unicode[STIX]{x1D6FB}_{p}^{2}{\mathcal{G}}_{M}^{II}(\,\boldsymbol{p}/\boldsymbol{p}^{\prime })+Pe_{z}\unicode[STIX]{x1D735}_{p}\boldsymbol{\cdot }\left(\dot{\tilde{\boldsymbol{p}}}^{I}{\mathcal{G}}_{M}^{II}(\,\boldsymbol{p}/\boldsymbol{p}^{\prime })\right)\nonumber\\ \displaystyle & & \displaystyle \!\!\quad =\unicode[STIX]{x1D6FF}(\,\boldsymbol{p}-\boldsymbol{p}^{\prime })-\frac{1}{4\unicode[STIX]{x03C0}}.\end{eqnarray}$$
Here,  ${\mathcal{G}}_{M}^{II}(\,\boldsymbol{p}/\boldsymbol{p}^{\prime })$ differs from
 ${\mathcal{G}}_{M}^{I}(\,\boldsymbol{p}/\boldsymbol{p}^{\prime })$, given by (B 4), in that it includes the effect of vorticity-induced rotation in addition to the orientation decorrelation due to rotary diffusion and run-and-tumble dynamics. Writing down the modified Green’s function as a series in spherical harmonics
 $$\begin{eqnarray}{\mathcal{G}}_{M}^{II}(\,\boldsymbol{p}/\boldsymbol{p}^{\prime })=\mathop{\sum }_{n=0}^{\infty }\mathop{\sum }_{m=-n}^{n}c_{n}^{m}(\,\boldsymbol{p}^{\prime })Y_{n}^{m}(\,\boldsymbol{p}),\end{eqnarray}$$
substituting in (C 4) and following the procedure mentioned in appendix B, we obtain
 $$\begin{eqnarray}c_{n}^{m}(\,\boldsymbol{p}^{\prime })=\frac{Y_{n}^{m^{\ast }}(\,\boldsymbol{p}^{\prime })}{R_{n,m}}\quad \text{for }n\geqslant 1,\end{eqnarray}$$
where  $R_{n,m}=[(1-4\unicode[STIX]{x03C0}A_{n}/(2n+1))/\unicode[STIX]{x1D70F}D_{r}+n(n+1)-\text{i}mPe_{z}/2]$. Note that the azimuthal degeneracy is broken by the presence of the
 $m$-dependent flow contribution. The effect of this flow contribution is to decrease the translational swimmer diffusivity at large
 $Pe$. For, large
 $Pe$, the spherical swimmer rotates with a period of
 $O(D_{r}^{-1}Pe^{-1})$. The rotation and swimming lead to a mean free path of
 $O(U_{s}Pe^{-1}D_{r}^{-1})$. Taken together with the decorrelation time of
 $O(D_{r}^{-1})$, this implies a scaling of
 $(U_{s}^{2}/D_{r})Pe^{-2}$ for the gradient component of the diffusivity. Thus, the rapid rotation induced by the ambient vorticity leads to an asymptotically small translational diffusivity at large
 $Pe$.
Using the convolution integral involving the modified Green’s function given by (C 5), one may write the  $O(B)$ swimmer probability density
 $G_{1}$, governed by (C 3), in the following final form:
 $$\begin{eqnarray}G_{1}=-Pe_{z}\int \text{d}\,\boldsymbol{p}^{\prime }\,{\mathcal{G}}_{M}^{II}(\,\boldsymbol{p}/\boldsymbol{p}^{\prime })\unicode[STIX]{x1D735}_{p}\boldsymbol{\cdot }(\dot{\tilde{\boldsymbol{p}}}^{II}(\,\boldsymbol{p}^{\prime })G_{0})=\frac{3iPe_{z}}{4\unicode[STIX]{x03C0}}\sqrt{\frac{2\unicode[STIX]{x03C0}}{15}}\left(\frac{Y_{2}^{-2}}{R_{2,-2}}-\frac{Y_{2}^{2}}{R_{2,2}}\right).\end{eqnarray}$$
Next, considering the swimmer probability density at  $O(\unicode[STIX]{x1D716})$ in the multiple scale analysis, and expanding in
 $B$
 $$\begin{eqnarray}\unicode[STIX]{x1D6FA}_{1}=\unicode[STIX]{x1D6FA}_{10}+B\unicode[STIX]{x1D6FA}_{11}+\cdots \,,\end{eqnarray}$$
we obtain the following equations at successive orders in  $B$:
 $$\begin{eqnarray}\displaystyle & & \displaystyle O(1):\frac{1}{\unicode[STIX]{x1D70F}D_{r}}\left[\unicode[STIX]{x1D6FA}_{10}-\int \text{d}\,\boldsymbol{p}^{\prime }\,K(\,\boldsymbol{p}/\boldsymbol{p}^{\prime })\unicode[STIX]{x1D6FA}_{10}(\,\boldsymbol{p}^{\prime })\right]-\unicode[STIX]{x1D6FB}_{p}^{2}\unicode[STIX]{x1D6FA}_{10}+Pe_{z}\unicode[STIX]{x1D735}_{p}\boldsymbol{\cdot }(\dot{\tilde{\boldsymbol{p}}}^{I}\unicode[STIX]{x1D6FA}_{10})\nonumber\\ \displaystyle & & \displaystyle \quad =-(\,\boldsymbol{p}\boldsymbol{\cdot }\unicode[STIX]{x1D735}_{\boldsymbol{x}}F)G_{0}\end{eqnarray}$$
 $$\begin{eqnarray}\displaystyle & & \displaystyle O(B):\frac{1}{\unicode[STIX]{x1D70F}D_{r}}\left[\unicode[STIX]{x1D6FA}_{11}-\int \text{d}\,\boldsymbol{p}^{\prime }\,K(\,\boldsymbol{p}/\boldsymbol{p}^{\prime })\unicode[STIX]{x1D6FA}_{11}(\,\boldsymbol{p}^{\prime })\right]-\unicode[STIX]{x1D6FB}_{p}^{2}\unicode[STIX]{x1D6FA}_{11}+Pe_{z}\unicode[STIX]{x1D735}_{p}\boldsymbol{\cdot }(\dot{\tilde{\boldsymbol{p}}}^{I}\unicode[STIX]{x1D6FA}_{11})\nonumber\\ \displaystyle & & \displaystyle \quad =-Pe_{z}\unicode[STIX]{x1D735}_{p}\boldsymbol{\cdot }(\dot{\tilde{\boldsymbol{p}}}^{II}\unicode[STIX]{x1D6FA}_{10})-(\,\boldsymbol{p}\boldsymbol{\cdot }\unicode[STIX]{x1D735}_{\boldsymbol{x}}F)G_{1}.\end{eqnarray}$$
Substituting  $G_{0}=1/4\unicode[STIX]{x03C0}$ and using (C 4), the solution of (C 9) can be expressed as:
 $$\begin{eqnarray}\unicode[STIX]{x1D6FA}_{10}=-\frac{\text{i}}{4\unicode[STIX]{x03C0}}\sqrt{\frac{2\unicode[STIX]{x03C0}}{3}}\left(\frac{Y_{1}^{-1}}{R_{1,-1}}+\frac{Y_{1}^{1}}{R_{1,1}}\right)\frac{\unicode[STIX]{x2202}F}{\unicode[STIX]{x2202}y}.\end{eqnarray}$$
Similarly, from (C 11), (C 7) and (C 4), we obtain the solution of (C 10) as:
 $$\begin{eqnarray}\displaystyle \unicode[STIX]{x1D6FA}_{11} & = & \displaystyle -\frac{Pe\sqrt{\frac{3}{2\unicode[STIX]{x03C0}}}\left[6F(4i+Pe_{z})+5\frac{\unicode[STIX]{x2202}F}{\unicode[STIX]{x2202}z}\dot{\unicode[STIX]{x1D6FE}}\left(-6i+Pe_{z}\right)\right]}{5\left(4i+Pe_{z}\right)\left(-6i+Pe_{z}\right)^{2}}\frac{Y_{1}^{-1}}{R_{1,-1}}\nonumber\\ \displaystyle & & \displaystyle +\,\frac{Pe\sqrt{\frac{3}{2\unicode[STIX]{x03C0}}}\left[6F(-4i+Pe_{z})+5\frac{\unicode[STIX]{x2202}F}{\unicode[STIX]{x2202}z}\dot{\unicode[STIX]{x1D6FE}}\left(6i+Pe_{z}\right)\right]}{5\left(-4i+Pe_{z}\right)\left(6i+Pe_{z}\right)^{2}}\frac{Y_{1}^{1}}{R_{1,1}}\nonumber\\ \displaystyle & & \displaystyle +\,(\cdots \,)Y_{3}^{-3}+(\cdots \,)Y_{3}^{3}+(\cdots \,)Y_{3}^{1}+(\cdots \,)Y_{3}^{-1}.\end{eqnarray}$$
As in appendix B, only the terms involving  $(Y_{1}^{-1}+Y_{1}^{1})$ contribute to the diffusivity (
 $D_{zz}$) and drift (
 $V_{z}$). So for simplicity, we do not mention the coefficients of
 $Y_{3}^{\pm 1},Y_{3}^{\pm 3}$ in (C 12). Integrating (2.6) over the orientation degrees of freedom and using
 $\int \text{d}\,\boldsymbol{p}\,G=1$ (from (A 10)), we get
 $$\begin{eqnarray}\frac{\unicode[STIX]{x2202}F}{\unicode[STIX]{x2202}t_{2}}=-\int \text{d}\,\boldsymbol{p}\,p_{3}\frac{\unicode[STIX]{x2202}\unicode[STIX]{x1D6FA}_{1}}{\unicode[STIX]{x2202}z}.\end{eqnarray}$$
Using (C 8), (C 11), (C 12), in the above equation and integrating, gives
 $$\begin{eqnarray}\frac{\unicode[STIX]{x2202}F}{\unicode[STIX]{x2202}t_{2}}=\frac{\unicode[STIX]{x2202}}{\unicode[STIX]{x2202}z}\left[\left(D_{zz}^{(0)}+BD_{zz}^{(1)}+\cdots \,\right)\frac{\unicode[STIX]{x2202}F}{\unicode[STIX]{x2202}z}-\left(V_{z}^{(0)}+BV_{z}^{(1)}+\cdots \,\right)F\right],\end{eqnarray}$$
where
 $$\begin{eqnarray}\displaystyle & \displaystyle D_{zz}^{(0)}=\frac{4(72+2Pe_{z}^{2})}{3(16+Pe_{z}^{2})(36+Pe_{z}^{2})}, & \displaystyle\end{eqnarray}$$
 $$\begin{eqnarray}\displaystyle & \displaystyle D_{zz}^{(1)}=-\frac{4Pe_{z}^{2}}{(16+Pe_{z}^{2})(36+Pe_{z}^{2})}, & \displaystyle\end{eqnarray}$$
 $$\begin{eqnarray}\displaystyle & \displaystyle V_{z}^{(0)}=0, & \displaystyle\end{eqnarray}$$
 $$\begin{eqnarray}\displaystyle & \displaystyle V_{z}^{(1)}=\frac{24PePe_{z}(-84+Pe_{z}^{2})}{5(16+Pe_{z}^{2})(36+Pe_{z}^{2})^{2}}. & \displaystyle\end{eqnarray}$$
In the above equation,  $D_{zz}^{(0)}$ scales as
 $O(1/Pe^{2})$ for large
 $Pe$, consistent with the scaling arguments above. From (C 18), we see that the
 $O(B)$ drift at the wall, for near-spherical swimmers, changes sign when
 $Pe_{z}^{2}=84$. This may be rewritten as
 $\dot{\unicode[STIX]{x1D6FE}}|_{z=-1}^{2}Pe^{2}=84$, whence, one obtains the threshold
 $Pe$ for drift reversal as
 $Pe_{c}=\sqrt{21}\sim 4.5$. This critical
 $Pe$ is mentioned in § 3.3.2, and appears in the
 $Pe{-}\unicode[STIX]{x1D705}$ phase portrait in figure 14.
Now, to obtain the steady state swimmer concentration profile we expand
 $$\begin{eqnarray}F(z)=F^{(0)}+BF^{(1)}(z)+\cdots \,,\end{eqnarray}$$
substituting in the normalization condition  $\int _{-1}^{1}\,\text{d}z\,F(z)=1,$ yields
 $F^{(0)}=1/2$ and
 $$\begin{eqnarray}\int _{-1}^{1}\,\text{d}z\,F^{(1)}(z)=0.\end{eqnarray}$$
Using  $F^{(0)}=1/2$, substituting (C 19) in (C 14), and equating the coefficients of
 $B$ on both sides, we get
 $$\begin{eqnarray}\frac{\text{d}F^{(1)}}{\,\text{d}z}=-\frac{V_{z}^{(1)}}{2D_{zz}^{(0)}}.\end{eqnarray}$$
From (C 15), (C 18) and (C 20), the solution of (C 21), is
 $$\begin{eqnarray}F^{(1)}(z)=\frac{9}{40}\left[-2-\frac{30}{\left(9+Pe^{2}z^{2}\right)}+\frac{(16\tan ^{-1}(Pe/3))}{Pe}+\log (9+Pe^{2})-\log \left(9+Pe^{2}z^{2}\right)\right].\end{eqnarray}$$
Thus, from (C 19), (C 22) and using  $F^{(0)}=1/2$, we obtain the following steady state concentration profile for near-spherical swimmers:
 $$\begin{eqnarray}\displaystyle F(z) & = & \displaystyle \frac{1}{2}+B\frac{9}{40}\left[-2-\frac{30}{(9+Pe^{2}z^{2})}\right.\nonumber\\ \displaystyle & & \displaystyle \left.+\,\frac{(16\tan ^{-1}(Pe/3))}{Pe}+\log (9+Pe^{2})-\log (9+Pe^{2}z^{2})\right].\end{eqnarray}$$
In figure 17, we compare the numerical and analytical results of  $F^{(1)}(z)$ for near-spherical swimmers at
 $Pe=40$. As expected, the numerical profiles approach the analytical one for
 $\unicode[STIX]{x1D705}\rightarrow 1$. More importantly, the spatial structure of the swimmer concentration profile is similar to that obtained for finite
 $B$ – a pair of concentration maxima on either side of the channel centreline.
Comparison of  $F^{(1)}(z)=(F-F^{(0)})/B$, obtained from the numerics and the analytical solution (C 22) for near-spherical swimmers at
 $Pe=40$.