

Introduction
There have been occasional attempts to make quantitative estimates of the efficiency of electron microscope (EM) imaging and the number of images needed to obtain atomic resolution structures of organic or biological structures, since the beginning of the field. An early publication (Frank, Reference Frank1975) discussed the theoretical possibility of detecting the position of non-crystalline biological molecules that all had the same orientation, and a subsequent paper (Saxton and Frank, Reference Saxton and Frank1977) estimated the sensitivity needed in terms of particle size. The contrast in early images, recorded on photographic film, fell well below that predicted from the intensities in electron diffraction patterns of two-dimensional crystalline specimens whether radiation-sensitive or radiation-insensitive (Henderson and Glaeser, Reference Henderson and Glaeser1985). That was partly due to the poor detective quantum efficiency (DQE) of the photographic film, but also due to other problems with the imaging process including motion of the specimen (Brilot et al., Reference Brilot2012). Modern direct electron detectors (McMullan et al., Reference McMullan2014) have DQEs much nearer to 100%, can record movies instead of static images, and new specimen supports eliminate the movement of the specimen upon irradiation (Naydenova et al., Reference Naydenova2020).
An early review (Henderson, Reference Henderson1995) gave an estimate of particle size and number of required images to reach near-atomic resolution, based on a calculation from elastic and inelastic cross-sections, alongside known radiation damage dose limitations. This suggested 10,000 single-particle images would be required to reach 3 Å resolution for particles large enough to be detectable and with enough signal to allow orientation determination (37 kDa). Later calculations, using more realistic, less stringent criteria indicated lower numbers for the required number of asymmetric units (Nasym) of 1,400 (Glaeser, Reference Glaeser1999) or 600 (Rosenthal and Henderson, Reference Rosenthal and Henderson2003; Vinothkumar and Henderson, Reference Vinothkumar and Henderson2016). A recent review (Patwardhan et al., Reference Patwardhan2025) outlined how one might make a more sophisticated calculation that included resolution-dependent parameters that affect the number of particles required. The purpose of the present article is to describe more completely this calculation of the number of particles required to determine a structure to a particular resolution in cryoEM, and to compare this to the number used in typical and best-case recent structure determinations.
Two earlier publications introduced scaling laws in the form of semi-logarithmic plots relating the number of particles included in a single-particle cryoEM structure to the resolution achieved. First Rosenthal and Henderson (Reference Rosenthal and Henderson2003) plotted the natural logarithm of asymmetric units ln(Nasym) versus spatial frequency squared (1/d 2). For a structure blurred by a pure Gaussian function in real space, this translates into a straight line in reciprocal space, as shown in Figure 1a, which is copied (with permission) from that publication. Second, Stagg et al. (Reference Stagg2014) introduced a second empirical scaling law plotting log(Nptcls) versus spatial frequency (1/d). This is also reproduced here in Figure 1b. Note that Nasym and Nptcls in those two publications are related by the particle point group symmetry, and they differ in using resolution or resolution squared as the abscissa or ordinate. The Rosenthal plot for experimental data becomes linear above 10 Å when the decrease in signal-to-noise ratio with increased spatial frequency can be described by a single Gaussian blurring function in real space (Rosenthal and Henderson, Reference Rosenthal and Henderson2003). The ResLog plot also looks linear over the restricted resolution range of 5–15 Å. In this article, we consider a much wider range of resolution from 100 to 1 Å, and a much larger variation in particle number from 1 up to 108. Because there is now more experimental data on single-particle cryoEM, it is also timely to revisit and extend the comparison between theory and practice, to examine how well we are doing and what we can do to make further improvements.
Two examples of earlier plots of the number of particles or asymmetric units needed to attain specific resolutions. (a) Rosenthal plot showing log (Nasym) versus spatial frequency squared (1/d 2) for theoretical datasets with several imposed B-factors. The y axis scaling assumes a molecule with icosahedral (60-fold) point group symmetry for particle numbers but the general principle applies to any point group. (b) Experimental Stagg ResLog plot (Stagg et al., Reference Stagg2014) showing spatial frequency (1/d) versus log (Nptcls). Note that Nptcls and Nasym are related by the particle point group symmetry. The Rosenthal plot becomes linear above 10 Å when the decrease in signal-to-noise ratio with increased spatial frequency can be described by a single Gaussian blurring function in real space (Rosenthal and Henderson, Reference Rosenthal and Henderson2003). The Stagg ResLog plot also looks linear over the restricted resolution range of 5–15 Å. (c) Plot of the number of asymmetric units (Nasym) on a log scale required to reach a given resolution (1/d) according to the theory described in Section ‘Theory’ (Eq. (1)) assuming perfect images and computations (B = 0) and for several values of B-factor.

Figure 1. Long description
Panel a is a Rosenthal plot. The y-axis is Particle Number (asymmetric units all over 60) on a log scale from 10 to 10 super 7. The x-axis is d super minus 2 in Angstroms. Four lines originate from the top-left corner (infinity). The lines represent B equals 125, B equals 250, B equals 500, and B equals 1000. As the B-factor increases, the slope becomes steeper, requiring more particles for the same resolution. A solid black dot and an open circle are marked at the 8.7 Angstrom point on the B equals 1000 line.
Panel b is a Stagg ResLog plot. The y-axis is Spatial Frequency (1 all over d) in inverse Angstroms from 0 to 0.25. The x-axis is N Ptcls on a log scale from 100 to 100,000. Four experimental datasets are plotted as linear trends: A A V-D J forward slash S O S (blue diamonds), Gro E L 120 (red squares), A A V-D J (green triangles), and Gro E L 300 (black crosses). All four show a linear increase in spatial frequency as the number of particles increases.
Panel c is a theoretical plot of N asym. The y-axis is N asym required on a log scale from 0.01 to 100,000,000. The x-axis is resolution (1 all over d) in inverse Angstroms from 0 to 1. Five curves are shown. The bottom curve for B equals 0 (purple) shows a gradual logarithmic increase. As B-factors increase to 25 (light blue), 50 (yellow), 100 (light green), and 200 (bright green), the curves become increasingly vertical, indicating a massive increase in required particles to reach higher spatial frequencies.
Theory
Given a desired resolution, and knowing the allowed exposure limited by radiation damage, it is possible to estimate the number of particles required to reach that resolution assuming that the positions and orientations of the particles in the images can be accurately determined. Depending on the definition of resolution, this results in slightly different numbers. Two earlier calculations (Henderson, Reference Henderson1995; Rosenthal and Henderson, Reference Rosenthal and Henderson2003) determined that 600 particles are needed to reach 3 Å resolution if the critical dose Ne to reduce the diffracted intensity at 3 Å to 1/e is 5 el/Å2. This also assumes the 0.143 Fourier Shell Correlation (FSC) resolution threshold and corresponds to an average phase error of 60°, equivalent to a figure of merit (mean cosine of phase error) of 0.5 (Blow and Crick, Reference Blow and Crick1959; Rosenthal and Henderson, Reference Rosenthal and Henderson2003). We now use 680 because the experimental value of Ne at 3 Å obtained by Naydenova et al. (Reference Naydenova2022) for specimens at 80 K is 4.4 rather than 5 el/Å2. The value of 4.4 el/Å2 was extrapolated from the value of 7.0 el/Å2 at 4 Å for the purple membrane in Naydenova et al. (Reference Naydenova2022).
Calculation of the number of particles required for different resolution ranges
The factors that need to be considered are
-
(a) The theoretical atomic scattering amplitudes for electrons at different resolutions (International Tables Volume C, Prince, Reference Prince2006, p. 263); because of the finite size of the electron distribution inside atoms, these decrease at higher resolution. We used the atomic scattering amplitudes σneon for elastic scattering of electrons by neon neutral atoms, rather than carbon, because neon has closed shells, which should be similar to carbon atoms that form bonds in real protein structures rather than having their outer electrons unbonded as in the independent atom model used for the calculations in the International Tables.
-
(b) The experimental values of Ne at different resolutions for specimens at 80 K, the temperature of liquid nitrogen (Naydenova et al., Reference Naydenova2022), extrapolated to higher resolutions. Ne is the electron dose measured in el/Å2 at which the intensity falls to 1/e of its initial value because of radiation damage. (See Table 1).
-
(c) The minimum number of views needed at different resolutions, πD/d where D is the diameter of the particle and d the resolution (Crowther et al., Reference Crowther1970).
-
(d) The envelope function for scattering amplitudes at lower resolutions; this is the resolution range below 8–12 Å where the contrast between solvent and protein gives rise to structure factors that exceed those determined by Wilson statistics (Wilson, Reference Wilson1949), which assumes random atom positions.
Values of the critical radiation dose Ne (el/Å2) for fading of purple membrane electron diffraction spots to an intensity of 1/e (Naydenova et al., Reference Naydenova2022), the elastic scattering amplitude σneon at different resolutions (Prince, Reference Prince2006), and the Guinier plot amplitude GA at different resolutions, as used in this article

Table 1. Long description
The table consists of six columns and 19 rows of data.
Column headers from left to right are:
1. Resolution d in Angstroms.
2. Critical dose N e for 1 over e fading in electrons per Angstrom-squared.
3. Elastic scattering amplitude for neon sigma sub neon in Angstroms.
4. sin theta over lambda equals 1 over 2 d.
5. Guinier amplitude G sub A relative to Wilson statistics E 2 C D.
6. Guinier amplitude for smaller protein catalase.
Data trends:
* As resolution d decreases from 100.0 to 1.0 Angstroms, the critical dose N e decreases significantly from 1,000.0 to 0.44. Values from 3.0 Angstroms and below are noted as extrapolated.
* The elastic scattering amplitude sigma sub neon decreases from 1.652 to 0.619.
* The Guinier amplitude G sub A starts at 5 for 100.0 Angstroms and stabilizes at 1 for all resolutions from 10.0 Angstroms down to 1.0.
* The Guinier amplitude for catalase starts at 40 for 100.0 Angstroms and similarly stabilizes at 1 for resolutions from 10.0 Angstroms down to 1.0.
* The row for 3.0 Angstroms is highlighted in bold, showing a critical dose of 4.4 and an elastic scattering amplitude of 1.405.
Equation (1) shows how the theoretical number of particles at 3 Å resolution (680) can be extended to other resolution values.

The values of the critical dose Ne (el/Å2) and the elastic scattering factor for neon σneon (Å) for different resolutions d are shown in Table 1. The product of factors in Eq. (1) includes numerators for σneon (1.405 Å), Ne (4.4 el/Å2), and d at 3 Å resolution and denominators indicating these parameters at defined resolution as well as the Guinier plot amplitude GA relative to Wilson statistics, which does not affect the data beyond 8 Å resolution. The resulting theoretical numbers of particles Nasym are plotted as a function of resolution in Figures 1c and 2 (purple for B = 0).
Logarithm of the number of asymmetric units (Nasym) versus resolution (1/d) plot for all the experimentally determined 3D maps in the EMDB in April 2026. These are assigned to time periods before (2002–2014) and after (2015–2025) the resolution revolution. Three apoferritin maps, one NiFe-hydrogenase map, and three ribosome maps are circled in red. These maps are among those with the highest resolution for the number of asymmetric units in the dataset, so they come closest to the theoretical curve. The theoretical curves for perfect images and computations (B = 0) as well as those with B-factors of 25, 50, 100, and 200 Å2 are superimposed. The deposition numbers for the red-circled structures follow. The two highest-resolution structures at 0.9–1.0 Å−1 are both apoferritin: EMD-19436 and EMD-11668. The middle group entries are: EMD-27661 0.66 Å−1 [NiFe]-hydrogenase, EMD-11121 0.65 Å−1 apoferritin, and EMD-15793 0.65 Å−1 ribosome. The low-resolution group entries are: EMD-25405 0.26 Å−1 ribosome and EMD-25415 0.26 Å−1 ribosome. The manual curation described in the Appendix was also applied to the data used in this figure. Additionally, entries with fewer than 1,000 asymmetric units and with an implied B factor lower than 25 were also checked.

Figure 2. Long description
A scatter plot titled E M D B Maps April 2026. The y-axis is a logarithmic scale representing the Number of asymmetric units ranging from 1 to 10 super 8. The x-axis represents Resolution in 1 over Angstrom units ranging from 0 to 1.
Data points are divided into two color-coded groups:
* Light blue circles represent the period 2002-2014, concentrated mostly between 0.1 and 0.4 on the x-axis.
* Pink circles represent the period 2015-2025, showing a much higher density and extending further toward the right of the graph, indicating higher resolution.
Five theoretical curves originate from the bottom left and fan out toward the top and right:
* B equals 0 is a dark blue line at the bottom.
* B equals 25 is a light blue line.
* B equals 50 is an orange line.
* B equals 100 is a yellow line.
* B equals 200 is a green line at the steepest incline.
Three red circles highlight specific high-performing data points:
* One small circle at approximately x equals 0.26, y equals 10 super 3.
* One medium circle at approximately x equals 0.65, y equals 5 times 10 super 5.
* One large circle at the top right at approximately x equals 0.9 to 1.0, y equals 10 super 7.
A legend in the bottom right quadrant identifies the time periods and the B-factor curve values.
More particles are needed to get to higher resolution and fewer for a lower resolution target. In the best case, around 100,000 well-preserved identical particles (asymmetric units) are needed to reach 1 Å resolution, but 20 Å resolution can be reached with only a single particle (Rosenthal and Henderson, Reference Rosenthal and Henderson2003). The image of this single particle could be acquired as a dose-fractionated tilt series as is done in electron cryotomography (Oikonomou and Jensen, Reference Oikonomou and Jensen2017) to give a low-resolution 3D map or as a single image, which can then be compared at high-resolution against simulated images of known structures as is done in 2D template matching (Rickgauer et al., Reference Rickgauer2017).
Multiple conformational states of a particle, if they can be identified, need an increase in the number of images to obtain good enough statistics per conformer, so may be considered within the same framework.
Different ways to estimate resolution loss; different types of B-factors
Resolution loss in practice has many causes, including image blurring, molecular disorder, partial denaturation, poor determination of individual positional or angular parameters, or instrumental limitations due to electron optics or detector performance, and these provide the experimental backdrop to the theory in this review. Resolution loss can often be characterized by a B-factor, which we discuss in this section.
The original definition of B-factor or Debye–Waller factor was introduced by Debye and Waller in two early publications (Debye, Reference Debye1913; Waller, Reference Waller1923) to describe the attenuation of X-ray scattering due to thermal motion of atoms. The scattering intensity is described by I = I 0 exp(−B/2d 2), where B = 8π 2‹u 2› and u 2 is the mean-square atomic displacement. Thermal motion of the atoms in crystals such as sodium chloride at room temperature (300 K) results in atomic motion of a fraction of an Ångstrom, described by a B-factor of around 1.5 Å2. Lipson and Cochran in their textbook (Lipson and Cochran, Reference Lipson and Cochran1966) cite Bradley and Lu (Reference Bradley and Lu1937) and Fowweather and Hargreaves (Reference Fowweather and Hargreaves1950) with B-factors of 1.1 and 0.4 Å2 for highly ordered crystals of metatolidine and AlCr2 respectively. A B-factor of 4.9 Å2 was used to describe disorder in methyl groups by Roth and Harker (Reference Roth and Harker1948).
Wilson statistics (Wilson, Reference Wilson1949), together with atomic scattering form factors derived from the electron or potential distribution in atoms can be used to predict the theoretically expected value of the average scattering intensity versus resolution. The distribution in real space results in an effective B-factor in reciprocal space. Again, these are small values in the range of 2–3 Å2.
Statistical disorder in typical protein structures or other macromolecular assemblies due to soft fluctuations can be characterized by B-factors, which are often in the range 10–30 Å2.
Rosenthal and Henderson (Reference Rosenthal and Henderson2003) characterized the effect of inaccurate determination of the particle orientations of single particles as B computation, and any intrinsic specimen or image disorder as B image. They emphasized disorder in real space that can be represented by a single Gaussian distribution can be characterized by a single B-factor.
There is also the effect of radiation damage, which causes bond breakage with different bonds being broken in different molecules, so that on average there is an increase in disorder proportional to dose. This can be characterized by an increased B-factor of about 5 Å2 per electron/ Å2 for specimens at 80 K, or 3.5 Å2 per electron/Å2 at 13 K (Dickerson et al., Reference Dickerson2025). The increased disorder is accompanied by an increase in molecular volume, which is due to the breakage of covalent bonds and replacement with van der Waals contacts (Garman, Reference Garman2010).
For ice-embedded specimens, the water molecules in the embedding medium also move and are modified during irradiation (McMullan et al., Reference McMullan2014), though at liquid nitrogen temperature (80 K) or indeed at temperatures below 120 K there is no water motion at all in the absence of irradiation and therefore no dose-rate effect. The water molecules only move during irradiation in what can be described as pseudo-Brownian motion. This pseudo-Brownian motion of the irradiated water displaces the embedded macromolecules and causes a blurring of their image, which again can be characterized by a B-factor, which gets bigger for smaller proteins. The motion of the average water molecule in bulk irradiated amorphous ice is about 1 Å for each 1 el/Å2 of irradiation, or 5 Å during a typical exposure of 25 el/Å2. For a 100,000 Da protein molecule, which is 6,000 times more massive than a water molecule, the resulting B-factor increase for an image averaged over a typical cryoEM exposure has been estimated to be about 25 Å2 (McMullan et al., Reference McMullan2014), though this will be much less in a dose-weighted calculation.
Angular error estimation and contribution to B-factor
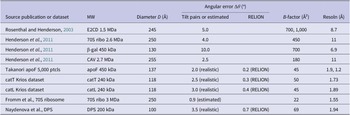
In practice, it is never possible to determine the exact orientation of images of single particles from low-dose images. There is always an uncertainty in the orientation determination, which leads to an angular inaccuracy and blurring of the 3D map that is reconstructed from the images. This blurring can be characterized by a B-factor such as listed in Table 2 or measured experimentally (Henderson et al., Reference Henderson2011) using tilt pairs, which relates angular error to additional B-factor. Rosenthal and Henderson (Reference Rosenthal and Henderson2003) drew a distinction between the angular error that comes from physical motion during the imaging exposure and the computational error that arises later from the stochastic noise in the image. The physical beam-induced motion causes translational and rotational motions, both of which cause image blurring.
Relation between orientation angular error and B-factor

Table 2. Long description
The table contains seven columns: Source publication or dataset, M W, Diameter D in Angstroms, Angular error Delta theta in degrees (split into Tilt pairs or estimated and R E L I O N), B-factor in Angstroms-squared, and Resolution in Angstroms.
* Rosenthal and Henderson 2003: E 2 C D 1.5 M Da, Diameter 245, Angular error 5.0, B-factor 700 to 1,000, Resolution 8.7.
* Henderson et al. 2011: 70 S ribo 2.6 M Da, Diameter 250, Angular error 4.0, B-factor 450, Resolution 11.
* Henderson et al. 2011: beta-gal 450 k Da, Diameter 130, Angular error 10.0, B-factor 700, Resolution 6.9.
* Henderson et al. 2011: C A V 2.7 M Da, Diameter 255, Angular error 2.5, B-factor 180, Resolution 11.
* Takanori apo F 5,000 particles: apo F 450 k Da, Diameter 137, Angular error 2.0 realistic and 0.2 R E L I O N, B-factor 45, Resolution 1.9 and 1.2.
* cat T Krios dataset: cat T 240 k Da, Diameter 118, Angular error 2.5 realistic and 0.3 R E L I O N, B-factor 50, Resolution 1.73.
* cat L Krios dataset: cat L 240 k Da, Diameter 118, Angular error 3.0 realistic and 0.4 R E L I O N, B-factor 45, Resolution 1.89.
* Fromm et al. 70 S ribosome: 70 S ribo 3 M Da, Diameter 250, Angular error 0.9 estimated, B-factor 22, Resolution 1.55.
* Naydenova et al. D P S: D P S 200 k Da, Diameter 100, Angular error 3.5 realistic and 0.7 R E L I O N, B-factor 69, Resolution 1.94.
The formula used in Henderson et al. (Reference Henderson2011) to relate angular error to the B-factor contribution was B = (Δθ·D)2/2,200, where D is particle diameter in Ångstroms and Δθ is measured in degrees. There is a full derivation of the equation, assuming a spherical protein, at the end of the Materials and Methods section of that paper.
It is possible to calculate the effect of the angular error Δθ in particle orientation on the effective B-factor in the resulting map by using the formula from Henderson et al. (Reference Henderson2011), namely.

where D is the particle diameter in Ångstroms and Δθ is measured in degrees. In practice it is not simple to obtain an accurate value for the angular error, but there are several ways to try to estimate it.
Single-particle cryoEM programs such as RELION (Kimanius et al., Reference Kimanius2021), cisTEM (Grant et al., Reference Grant2018), or cryoSPARC (Punjani et al., Reference Punjani2017) estimate the accuracy of the angular parameter fit by comparing internally the shape of the function being minimized with the fluctuating error during sampling. Tilt pair analysis (Rosenthal and Henderson, Reference Rosenthal and Henderson2003; Henderson et al., Reference Henderson2011; Russo and Passmore, Reference Russo and Passmore2014; Wasilewski and Rosenthal, Reference Wasilewski and Rosenthal2014) gives experimental errors from successive images of the same particles recorded with known exact angular differences. These experimental estimates calibrated using the known tilt angles are always bigger than those estimated internally during processing. Tilt pair analysis of larger structures where the angular accuracy is higher revealed the major reason for this discrepancy. The particles and the thin film of ice move during the exposures by angles of up to 4 degrees due to beam-induced motion (Henderson et al., Reference Henderson2011; Campbell et al., Reference Campbell2012). The translational component of this beam-induced motion is removed by motion corrections (Zheng et al., Reference Zheng2017) but the angular change is not normally treated, though it has been done occasionally (Campbell et al., Reference Campbell2012; Dimitry Tegunov apoF, unpublished)). Consequently, the tilt pair analysis error estimate is a more realistic value for the angular uncertainty that gives rise to blurring in real single-particle images. These two measures of angular accuracy are listed in separate columns in Table 2.
An estimate of the overall B-factor that describes the real experimental data can be calculated from the fall-off of map structure factors with spatial frequency squared (1/d 2) or from a Rosenthal plot obtained through a series of map calculations using dataset subsets including, for example, 1/2, 1/4, 1/8, 1/16th of the full particle dataset (e.g. McMullan et al., Reference McMullan2023) showing how ln(Nasym) varies with 1/d 2. Finally, B-factors can also be estimated by refinement of an atomic model against the experimental cryoEM potential maps (e.g. Nicholls et al., Reference Nicholls2018; Terwilliger et al., Reference Terwilliger2018; Joseph et al., Reference Joseph2020).
Thus, the theoretical plots in Figure 2 should be viewed keeping in mind the difficulty in determining an absolute value for the B-factor of the particle images that contribute to the final map. There is also the well-known observation that cryoEM structures of large complexes like the ribosome (Maji et al., Reference Maji2017) or spliceosome (Nguyen et al., Reference Nguyen2016) often have one or more domains that are more highly disordered, so there is often a need for application of a local model B-factor (Beton et al., Reference Beton2024).
It is also clear that the angular error will be smaller for larger particles such as ribosomes or viruses, and much bigger for smaller particles that are near the limit of detectability. To take this into account, Figures 1c and 2 include plots of the number of particles versus resolution as a function of the B-factor due to all sources of contrast loss. These plots show that smaller particles need more images to reach the same resolution or conversely that maps of smaller structures typically have lower resolution, as observed (Patwardhan et al., Reference Patwardhan2025).
For example, good 3D maps of apoferritin, with a MW of 500 kDa, can have B-factors using resolution-dependent dose-weighted movie frames as low as 30 Å2, whereas DPS and catalase, with MWs around 240 kDa, have B-factors around 60 Å2. Structures of molecules with MW below 100 kDa have higher B-factors. The smallest structure in the EMDB determined by single-particle cryoEM is Ara2, to which the authors chose to apply a sharpening B-factor of 90 Å2, but we expect the Rosenthal B-factor to be higher. Its resolution of 2.6 Å from over 600,000 asymmetric units places it in the most populated region in Figure 2.
The Electron Microscopy Data Bank (EMDB): Number of particles currently required in practice
In a recent paper, Patwardhan et al. (Reference Patwardhan2025) examined all the three-dimensional maps produced by single-particle cryoEM that have been deposited in EMDB up to 2024 comparing resolution with particle size. They noted that there is an optimum size of structure that yields the best resolution. Structures of smaller proteins have lower resolution due to higher alignment B-factors. Structures of larger proteins also tend to have lower resolution. This is likely due to more flexibility so that the focused alignment needed to align the domains of larger complexes suffers from the same limitation as for smaller structures. Basically, the amount of information in the image of each domain is too small for accurate alignment, again resulting in higher B-factors and lower resolution. The optimal size for single-particle cryoEM at present falls in the range 0.2 to 3.5 MDa with the peak at 0.5 MDa. In this range, the particle orientations are accurately determined without too much handicap from flexibility. There is also the possibility of loss of intrinsic symmetry due to perturbations during specimen preparation, such as squashing, bending, or partial denaturation at the air-water interface. This possibility has not been systematically investigated.
In this review, we extend this examination of deposited structures to find the relationship between the number of asymmetric units and the resolution achieved in current practice (Figure 2). In this plot, the particle size affects the location of individual structures indirectly through its effect on orientation accuracy, which feeds through into the B-factor, which describes the blurring, and the need for more images.
The distribution of structures shown in Figure 2 shows how the resolutions have improved since the ‘Resolution Revolution’ (Kühlbrandt, Reference Kühlbrandt2014) from typically 5–10 to 3 Å or better, due to improved instrumentation and image analysis software. A few of the best structures indicated with red circles are either apoferritin, rigid enzymes, or ribosomes, which have optimum size or additional advantages such as higher contrast from RNA and slower radiation damage to nucleic acids. These are within a factor of 3 of the best that can ever be expected according to theory. It is likely that about half of this gap between theory and practice arises because all the structures use bright-field defocus phase contrast to create the signal. This means that the contrast transfer function (CTF) has periodic zeros with only some Fourier components being recorded with near-maximum contrast. The availability of a perfect Zernike quarter-wave phase plate would roughly double the signal-to-noise ratio on average with an even larger increase at low resolution (Schwartz et al., Reference Schwartz2019; Remis et al., Reference Remis2024).
On the other hand, the centroid of the distribution in Figure 2 falls around 3 Å resolution for 100,000 asymmetric units, which is about 100 times more images than would be necessary if they were of higher quality. A significant proportion of structures still required over 1,000 times more data than strictly necessary. There are likely to be many reasons for this, and these problems will undoubtedly be the target of future technical improvements. Finally, there are many structures that are apparently well-behaved in solution but never make it onto grids because of specimen preparation problems among which interaction with the air-water interface may be the most important. These will all be targets for future improvements.
Combined influence of particle size and shape
In studying the number of particles required to reach a particular resolution, a related question is whether this is influenced by the size and shape of the macromolecule being studied. The earlier review (Patwardhan et al., Reference Patwardhan2025) explored the relationship between particle size and resolution, but the number of particles and the shape were not investigated explicitly. The Appendix presents an analysis used to make Figure 3. Briefly, a new parameter called PSR is defined as the product of the number of particles, the symmetry, and the resolution achieved, and this is plotted against the particle width defined as the cube root width of a three-dimensional ellipsoid that was fitted to structures in EMDB. A small value of PSR indicates more efficient data collection. The plot makes use of 6% of the EMDB deposited maps with a curve generated to define the lower envelope of the distribution, chosen to reflect the best structures at each particle size in cube root width bins of 20 Å. Figure 3 shows that PSR decreases until it reaches a minimum for a particle size of ~190 Å.
PSR (the product of the number of particles, symmetry, and resolution) varies with particle size using the cube root width as the size measure. PSR decreases toward a minimum around 190 Å, which is dominated by ribosomes and then gradually increases linearly (on the vertical logarithmic scale) as the width increases from there on. For modeling, entries with the three lowest PSR values (shown in orange) in cube root width bins of 20 Å are used to get an even sampling along the curve. There is substantial variation in the PSR within and between subsequent bins. A dotted curve defines the lower envelope. EMD-5039, with a cube root width of 4,550 Å is a reconstruction of a giant mimivirus; it has been plotted using both C5 and icosahedral symmetry, which differ by a factor of 12.

Figure 3. Long description
A line graph with logarithmic scales on both axes. The horizontal x-axis is labeled Cube root width in Angstroms, ranging from approximately 40 to 5,000. The vertical y-axis is labeled Asymmetric units times resolution in Angstroms, representing P S R, ranging from 10 super 4 to 10 super 9.
* Legend: Located in the top-left, it identifies blue open circles as All data, orange solid circles as Lowest P S R, a solid green line as Model fit, and a dotted green line as Scaled model.
* Data Distribution: A dense cluster of blue circles is concentrated between 100 and 300 Angstroms on the x-axis, spanning 10 super 4 to 10 super 8 on the y-axis. Orange circles trace the lower boundary of this cluster.
* Trends: The orange data points form a U-shaped lower envelope that reaches a minimum near 190 Angstroms before increasing linearly on the log scale toward the right.
* Model Curves: The solid green line follows the general upward trend of the lower data points. The dotted green line runs parallel just below it, acting as a lower boundary envelope.
* Specific Entry: At the far right, a single orange dot is labeled E M D minus 5039 (C 5). A vertical dotted line connects this point upward to a pink diamond labeled (I), representing the difference between C 5 and icosahedral symmetry.
The fitted ellipsoid is also used to define the asphericity (Θ), which describes the deviation of the particle’s shape from a sphere. The Appendix shows that more particles are needed to achieve a comparable resolution when asphericity is large. Many of these are oblate or ring-like structures with high cyclic point group symmetries. In practice these could have more uneven Euler angular distributions due to issues such as preferential orientation from interaction with the air-solvent interface. The analysis confirms that roughly spherical particles in the size range 0.2–3.5 MDa produce the highest resolution maps with the smallest number of particles.
Narrowing the gap between theory and practice
What are the innovations needed to bring us nearer to perfect single-particle cryoEM structure determinations? On the technical side, which is targeted at improving the quality of all the images, there are several developments that should become available in the next few years. Some of these will be expensive but others will not.
The three developments likely to be more expensive are colder specimens such as by using liquid helium temperature microscope stages (Naydenova et al., Reference Naydenova2020; Dickerson et al., Reference Dickerson2025), laser phase plates (Schwartz et al., 2019; Remis et al., Reference Remis2024; Petrov et al., Reference Petrov2026) and chromatic aberration correctors (Kabius et al., Reference Kabius2009; Hosokawa et al., Reference Hosokawa2013; Dickerson et al., Reference Dickerson2025; Wu et al., Reference Wu2025). Each of these may allow improvements in the signal-to-noise ratio of images of up to a factor of two, depending on specimen thickness and target resolution. Less expensive innovations involve using lower-energy electrons where the signal is greater for the same amount of radiation damage (Peet et al., Reference Peet2019; McMullan et al., Reference McMullan2023) or installing an objective lens with lower chromatic aberration (Alves et al., Reference Alves2026). Together, all the above may provide a factor of 3–4 improvement. About half of this potential improvement (due to phase plates and Cc correctors) should help to bring theory and practice closer, but the other half (lower temperature and lower energy electrons) should extend the theoretical range by improving the useful information in an exposure.
Aside from these entirely technical or electron-optical improvements, the most important goal for future work will be specimen preparation to minimize the problems with denaturation at the air-water interface, or damage at the surface of specimens during thinning using other approaches such as FIB milling (Mahamid et al., Reference Mahamid2016; Schaffer et al, Reference Schaffer2017), plasma FIB milling (Berger et al, Reference Berger2023) or CEMOVIS (Al-Amoudi et al., Reference Al-Amoudi2004; Eltsov et al., Reference Eltsov2018). The gap between the number of particles needed for an average structure and the best obtained so far is likely due to damage during specimen preparation, which should be a tractable problem and not a fundamental limitation (Gusach et al., Reference Gusach2025).
Some future challenges
As illustrated by a recent publication (Dickerson et al., Reference Dickerson2025), beam-induced motion in cryoEM samples at temperatures near that of liquid helium is a challenging problem but preparing the specimen in very small holes in a supporting gold matrix can reduce motion to the desired minimum. The study of many biological specimens will not in all cases be able to make use of these small-hole (100 nm) grids. There is also still a strong demand to obtain single-particle cryoEM structures for smaller proteins where improvements in the methodology either in physical specimen preparation or in computation will have the most impact. The pseudo-Brownian motion of water molecules in amorphous ice, which appears to be similar at liquid nitrogen (McMullan et al., Reference McMullan2014) and liquid helium temperature (Dickerson et al., Reference Dickerson2025), has a bigger impact on the motion of smaller proteins, so cryoEM structures of smaller proteins will always have an intrinsic B-factor and resolution limitation.
Over many years, there have been attempts to show that diffraction-based or scanning transmission (STEM) imaging methods may have some advantages over bright-field phase contrast imaging with or without a perfect Zernike phase plate (Zernike, Reference Zernike1942) in terms of dose efficiency (Dwyer, Reference Dwyer2023; Dwyer and Paganin, Reference Dwyer and Paganin2024), but the present consensus is that bright-field phase contrast still offers the highest information content for a given exposure that is limited by radiation damage (Bennemann et al., Reference Bennemann2026). It has also been shown experimentally (Peet et al., Reference Peet2019) that there is a moderate increase in information content obtained for a given amount of radiation damage, by using lower electron energy, such as 100 keV, and possibly even more at even lower electron energy.
Almost all the cryoEM structures in EMDB have significant radiation damage, since even the first frame of typical cryoEM images involves a radiation dose of ~3 MGy. In cases where radiation damage is a particular concern, a useful goal might be to record 10 times more images so that 3D maps at only 0.3 MGy could be calculated from the first frames, ensuring that any motion in the first few frames is minimized by using specimen supports that restrict movement of the water during imaging.
Tomography and crowded environments
Although most of the above discussion has concerned the theoretical foundations of single-particle cryoEM and how to extend its range, a substantial portion of the cryoEM community has already moved on to tackle the broader challenges of tomography or cellular imaging in a crowded environment (Rickgauer et al., Reference Rickgauer2017; Russo et al., Reference Russo2022; Lucas et al., Reference Lucas2023; Dickerson et al., Reference Dickerson2025). Such specimens usually do not involve highly purified molecules or molecular complexes. The molecules of interest are sometimes present at low abundance yet surrounded by a high concentration of other proteins or complexes. The challenge is to identify the location of the molecules of interest so that the power of averaging or classification can be used to extract structural information. This identification, whether based on a two-dimensional template matching (2DTM) search or on a sub-tomogram feature search, is intrinsically limited by the signal-to-noise ratio in the image or tomogram and is subject to false positives and false negatives as the structures become less abundant and as the environment becomes more crowded. In the last analysis, tomography is limited by the same fundamental signal-to-noise problems that restrict the range of single-particle cryoEM. The effect of a crowded environment where cellular structures are closely packed, such as in the structure of chromatin in the nucleus, is to reduce the strength of the low-resolution Fourier components and remove the contribution of stronger feature in the resolution range below 8–10 Å. In the final two columns of Table 1 for catalase and pyruvate dehydrogenase E2CD, this represents a two- to fivefold signal reduction. The same four technical improvements discussed above (liquid helium temperature, phase-plates, chromatic aberration correction, and lower energy electrons) are likely to help here too.
Conclusion
Single-particle cryoEM has had enormous impact on our ability to determine structures that were beyond the reach of earlier methods. Current developments, including lower electron energy cryoEM, phase plates, lower specimen temperature, and the use of chromatic aberration correction will help to extend the reach of cryoEM, but after that, future improvements will depend on new methods of specimen preparation, which is an important topic of discussion that is beyond the scope of this article. In the meantime, practitioners may find it interesting to find where each new structure falls in comparison to current practice as well as theoretical criteria on the plot shown in Figure 2.
Acknowledgments
We thank Dr Paul Midgley for valuable discussions.
Financial support
A.P. is supported by the Wellcome Trust (212977/Z/18/Z) and EMBL with funding from its member states. P.B.R. is supported by the Francis Crick Institute, which receives its core funding from Cancer Research UK (CC2106), the UK Medical Research Council (CC2106), and the Wellcome Trust (CC2106). This work is supported by Medical Research Council Grant No. MC_UP_120117 (C.J.R.) and Wellcome Trust Grant No. 220526/B/20/Z (R.H. and C.J.R.).
Competing interests
There are no conflicts of interest.
Appendix: Analysis of how the optimum particle number varies with structure size and shape in single-particle cryoEM
Introduction
Although the size and shape of a structure are not metrics available in EMDB, they can be computationally estimated from the main maps of EMDB entries. For any given size or shape the number of asymmetric units among EMDB entries may vary by several orders of magnitude. The spread can be attributed to various factors such as suboptimal data collection and data processing, molecular heterogeneity, and flexibility. Hence, the analysis focuses on entries with the lowest numbers of asymmetric units for any given size or shape, that is a small selection of the circa 47 K single-particle entries (as of April 2026) in EMDB.
As shown in the main text, see for example Eqs. (1) and (2), and Tables 1 and 2, the number of asymmetric units depends on several parameters including the B factor, the critical dose, neon elastic scattering factor, and the Guinier amplitude. There is also a direct dependence on resolution d via the Crowther term (πD/d) and an indirect dependence via the other parameters. Every single-particle entry in EMDB has a resolution estimate, which was used as the abscissa in Figure 2 and even though the resolution may have been measured using different methods, over time the field has converged to using the 0.143 criteria (Rosenthal and Henderson, Reference Rosenthal and Henderson2003). For the size and shape analysis we use the product of the number of particles, symmetry order, and resolution (PSR) as the dependent variable; all three parameters can be obtained from EMDB metadata, and the PSR relates to Eq. (1) if the 1/d term on the right-hand side is moved to the left and combined with Nasym, that is PSR = Nasym × d.
Methods
Initial data selection
Scripts written in R (https://www.r-project.org/) were used to download EMDB entry metadata and to analyse and filter entries. 2,872 entries comprising ~6% of the ~47 K released single-particle entries were selected. Map data for the selected entries were downloaded using the download_emdb Python (https://www.python.org/) program in the em_map_utils package (https://github.com/ardanpat/em-map-utils; https://pypi.org/project/em-map-utils/).
Procedure for selection of entries to download
-
(a) Use the EMDB API to download the metadata for all released single-particle EMDB entries (100 metadata entries are downloaded at a time until there are no more entries): https://www.ebi.ac.uk/emdb/api/search/structure_determination_method%3A%22singleParticle%22%20AND%20current_status%3AREL?rows=100
-
(b) Check the metadata, keeping only entries that have an aggregation state of ‘particle’ and valid values for the number of particles used as well as the resolution, and removing entries that are marked as composite maps, that are negatively or positively stained and entries missing a PubMed ID for the associated publication.
-
(c) To get a relatively even sampling of different symmetries and resolutions, for every point group symmetry, data were grouped by resolutions ‘bins’ with a width of 1/10 of the base 10 logarithm of the reciprocal resolution. Data in each resolution bin were sorted by PSR in ascending order, and a number (10–15) of the entries with the lowest PSR values in each bin were selected for further analysis.
Manual data curation
Several manual checks were performed on the selected entries resulting in a further reduction to 1,857 entries or ~ 4% of the released single-particle entries.
Manual checks performed
-
(a) Omit entries which have associated publications that cannot be accessed, e.g., due to paid subscriptions not supported by EMBL-EBI and the unavailability of open-source copies.
-
(b) Cross-check the number of particles, point group symmetry, and resolution with the associated publication. If there are discrepancies, update values to match paper or omit entry from analysis if no corroboration can be found.
-
(c) If the entry is a part of a structure, e.g., part of a phage, omit it from the analysis.
-
(d) If the structure is bound to a nano-disc, liposome, or micelle with pronounced contrast of these peripheral structures in the reconstruction, omit them from the analysis.
-
(e) Omit any misannotated entries that managed to slip through the automated selection process, e.g. composite, negatively stained, tomography, and helical structures.
Size and shape measurement
The size and shape of structures were determined using the structure_size_and_shape program in the em_map_utils package using the following procedure:
-
(a) Threshold the map so that any map values below the threshold are set to zero, and the threshold value is subtracted from any map values above the threshold.
-
(b) Calculate the three principal axes of the map value distribution, then rotate the map so that the principal axes align with the box axes.
-
(c) Calculate three 1D line projections of the map value distribution along the three box axes by first finding 2D projections and then reducing the 2D projection to a 1D one, e.g., p(x,y,z) → p(x,z) → p(z).
-
(d) Estimate the widths of the line profiles and use them as measures of the extent of the structure along the three axes.
Cube root width
The volume of an ellipsoid spanned by the three width measurements is given by:

The volume of a sphere with the equivalent volume is given by:

Combining Eqs. (A1) and (A2) one can express the cube root width in terms of the three principal axes widths:

The cube root width provides a measure of the overall size of the structure.
Asphericity
The surface area to volume ratio of an ellipsoid is at a minimum when the three axes are equal in length, that is for the special case of a sphere. As the axes become more dissimilar, e.g. the ellipsoid becomes more oblate or prolate, the ratio increases. One can therefore define a simple measure for the shape of the molecule solely by using the widths along the principal axes and the volume-to-surface area ratio. Here we define ‘asphericity’ as:

where V and S are the volume and surface area for an ellipsoid, and V 0 and S 0 are the same for a sphere with the cube root width calculated from the ellipsoid axes. In terms of widths along the principal axes and the cube root width, the ratios are defined as:

and

where RG is the completely symmetric elliptic integral of the second kind (Carlson, Reference Carlson1995) as implemented by the ‘elliprg’ function in the SciPy package (https://scipy.org/). The asphericity can then be expressed as a dimensionless value between 0 and 1:

Figure A1 shows how the asphericity varies with the shape of macromolecules in EMDB.
Data analysis and model fitting
Data analysis and model fitting were mainly done using R script. The gslnls package (Chau, Reference Chau2025) was used for non-linear least squares fitting. The Barron loss function (Barron, Reference Barron2019) was used for fitting with α = −2 (which is essentially a Geman–McClure loss function (Geman and McClure, Reference Geman and McClure1987), which helps reduce the effect of outliers. The scaling parameter c of the loss function was adjusted empirically by visually observing the overlap of the fit to the data as well as checking modeling statistics.
Results
Width
Figure 3 shows how the PSR varies with the cube root width. PSR decreases toward a minimum around 190 Å, which is dominated by ribosomes and then gradually increases linearly (on the logarithmic PSR scale) as the width increases from there on. For modeling, entries with the three lowest PSR values (shown in orange) in cube root width bins of 20 Å are used to get an even sampling along the curve. There is substantial variation in the PSR within and between subsequent bins, but still a low-order curve may be traced to define the lower envelope of the variation:

The estimates and standard errors for the fitting parameters are C 1 = 1,526 (60), C 2 = 98 (10), and C 3 = 2.666 × 10⁻³ (4 × 10⁻⁶). The Barron loss function was used for fitting with the parameters α = −2 and c = 0.06. The model fitting process by its nature tries to place the fitted curve so that points to which it has been fitted are distributed equally on both sides of it. The scaled model is equivalent to the fitted model with the exception that the C 1 constant has been manually adjusted to 763 (50% of the original value) so that the curve skims the bottom envelope of the data.
The minima of the fitted and scaled models occur at:

which for the given constants is 192 Å. The points defining the minima in the chart consist chiefly of ribosomes, and this width is consistent with the size of a ribosome. If one assumes a protein density of ~0.81 Da Å−3 and a spherical protein, a width of 192 Å corresponds to a molecular weight of ~3 MDa, which is also consistent with that of ribosomes.
There is one data point (EMD-5039) with a cube root width of 4,550 Å that lies well below the curve by two orders of magnitude. EMD-5039 is a reconstruction of the giant mimivirus using C5 symmetry at 65 Å resolution. It was in fact deposited as having icosahedral symmetry despite the title stating that it has C5 symmetry and the map clearly showing a non-icosahedral fivefold feature, and hence manually modified in the analysis as having C5 symmetry. Had the original icosahedral symmetry been kept for this entry, the PSR would be 12 times higher than its current value and closer to the curve (although still almost an order of magnitude better). In common with many virus entries in EMDB, EMD-5039 was first processed using a higher point group symmetry (icosahedral in this case) and subsequently relaxed to a lower symmetry, and the results indicate that in such cases remnants of the originally applied symmetry still are manifested and visible in the final map.
Given the dependence of the B factor exponential and other factors on the right-hand side of Eq. (1) on resolution, it is reasonable to inquire whether Eq. (A8) should have some inverse proportional dependence on resolution, d −a . Indeed, this was tested for values of ‘a’ ranging from 0.25 to 2 but did not result in any visible improvement of the fit.
Asphericity
Figure A2 shows the variation of PSR with asphericity. For modeling, entries with the three lowest PSR values (shown in orange) in asphericity bins of 0.02 are used to get an even sampling along the curve. The lower envelope of the points shows an approximate linear relationship between the logarithm of the PSR and asphericity:

The estimates and standard errors for the fitting parameters are C 1 = 11,700 (387) and C 2 = 11.95 (0.07). The Barron loss function was used for fitting with the parameters α = −2 and c = 0.5. In Fig. A2, the scaled model is equivalent to the fitted model with the exception that the C 1 constant has been manually adjusted to 4,120 (35% of the original value) so that the curve skims the bottom envelope of the data. As with the cube root width fit, attempts to add a resolution term d −a where a was varied between 0.25 and 2 did not result in any visible improvement of the fit.
Can the width and asphericity models be combined?
Given that both models are exponentials it is natural to inquire whether they can be combined into one model:

This requires that the assumption of separability is valid:

If one considers the PSR measurements as a sparse matrix of width and asphericity values then one way to test whether the data is consistent with this assumption is to check that the matrix has rank 1, that is all rows are scalar multiples of one another, and the same applies to all the columns. A matrix is rank 1 if a singular value decomposition yields a solitary non-zero singular value. To reduce the sparseness of the matrix, the width and asphericity values can be binned, and for each unique bin combination the lowest PSR can be used to populate the matrix. This analysis was performed using an asphericity bin size of 0.05 and a width bin size of 100 Å resulting in a sparse matrix with 48 non-zero elements out of 506 (90% sparseness). In contrast to expectations for a separable function, there were around 6 significant singular values out of 11 instead of one. However similar results were seen in simulations performed using a defined separable function as the level of noise and matrix sparseness were increased. The conclusion is that more data (i.e. more structures) are needed before Eq. (A11) can be confirmed.
Example structures from EMDB showing how the asphericity metric (Θ) varies with the shape of macromolecules. The range of Θ varies from 0 to 1.

Figure A1. Long description
A central horizontal blue axis is marked from 0 on the left to 1 on the right with ten red data points. Leader lines connect these points to structural models and data labels arranged in two rows.Top row from left to right:- E M D dash 0 5 4 7. D 6, 3.5 Angstroms. Theta equals 0.17. Shows a star-shaped protein complex.- E M D dash 1 7 8 2 1. C 1 8, 3.2 Angstroms. Theta equals 0.27. Shows a thick, textured ring.- E M D dash 2 3 5 6 9. C 8, 3.3 Angstroms. Theta equals 0.38. Shows a wide, segmented ring.- E M D dash 4 8 7 4 1. C 3 3, 3.6 Angstroms. Theta equals 0.47. Shows a thin, serrated ring.- E M D dash 2 1 1 6 1. C 3 3, 6.9 Angstroms. Theta equals 0.57. Shows a smooth, thin ring.Bottom row from left to right:- E M D dash 2 2 6 5 7. O, 1.3 Angstroms. Theta equals 0. Shows a dense, spherical cluster.- E M D dash 1 5 7 9 3. C 1, 1.6 Angstroms. Theta equals 0.01. Shows an irregular, porous globular structure.- E M D dash 5 1 9 5 3. C 7, 2.2 Angstroms. Theta equals 0.02. Shows a complex asymmetric assembly with protruding subunits.- E M D dash 4 3 0 2 5. C 5, 2.5 Angstroms. Theta equals 0.07. Shows an elongated, vertical protein structure.- E M D dash 3 9 2 4 4. C 2, 2.8 Angstroms. Theta equals 0.12. Shows two interconnected globular lobes.
Top row from left to right:
* E M D dash 0 5 4 7: A star-shaped structure. Metadata: D 6, 3.5 Angstroms, Theta equals 0.17.
* E M D dash 1 7 8 2 1: A thick, textured ring. Metadata: C 1 8, 3.2 Angstroms, Theta equals 0.27.
* E M D dash 2 3 5 6 9: A segmented ring. Metadata: C 8, 3.3 Angstroms, Theta equals 0.38.
* E M D dash 4 8 7 4 1: A thin, spiked ring. Metadata: C 3 3, 3.6 Angstroms, Theta equals 0.47.
* E M D dash 2 1 1 6 1: A large, smooth-edged ring. Metadata: C 3 3, 6.9 Angstroms, Theta equals 0.57.
Bottom row from left to right:
* E M D dash 2 2 6 5 7: A dense, spherical cluster. Metadata: O, 1.3 Angstroms, Theta equals 0.
* E M D dash 1 5 7 9 3: An irregular, porous cluster. Metadata: C 1, 1.6 Angstroms, Theta equals 0.01.
* E M D dash 5 1 9 5 3: A complex, elongated protein structure. Metadata: C 7, 2.2 Angstroms, Theta equals 0.02.
* E M D dash 4 3 0 2 5: A vertical, narrow structure. Metadata: C 5, 2.5 Angstroms, Theta equals 0.07.
* E M D dash 3 9 2 4 4: A double-lobed structure. Metadata: C 2, 2.8 Angstroms, Theta equals 0.12.
Variation of PSR (Product of the number of particles, symmetry and resolution) with asphericity. Points represent EMDB structures: the orange ones were used for model fitting. The solid green line is the model fit and the dashed line is identical except for a manually tweaked scaling factor to make the curve skim the lower envelope of the data points.

Figure A2. Long description
The X-axis is labeled Asphericity with a linear scale from 0.0 to 0.4. The Y-axis is labeled Asymmetric units times resolution in Angstroms using a logarithmic scale from 10 super 4 to 10 super 8.Data points:* All data: Represented by blue open circles, concentrated heavily at low Asphericity values (0.0 to 0.1) across the entire Y-axis range, with a sparse distribution extending toward 0.4 Asphericity.* Lowest P S R: Represented by solid orange circles, forming a distinct lower boundary that trends upward as Asphericity increases.Trend lines:* Model fit: A solid dark green line showing a positive linear correlation starting near 10 super 4 at 0.0 Asphericity and rising to nearly 10 super 7 at 0.5 Asphericity.* Scaled model: A dashed dark green line running parallel to and slightly below the Model fit line.A legend in the bottom-right quadrant identifies the four data categories. The background features a light gray grid.
* Data Distribution: A dense cluster of blue open circles representing All data is concentrated at low Asphericity values between 0.0 and 0.1, spanning the full vertical range of the Y-axis. As Asphericity increases, the density of blue circles decreases.
* Lowest P S R: Solid orange circles representing Lowest P S R are scattered primarily along the lower boundary of the data set, showing a positive linear correlation between Asphericity and the Y-axis value.
* Model Trends: A solid dark green line labeled Model fit starts at approximately 10 super 4.1 on the Y-axis at 0.0 Asphericity and follows a linear upward trend. A dashed dark green line labeled Scaled model runs parallel to and below the solid line, starting at approximately 10 super 3.8.
* Legend: Located in the bottom right quadrant, it identifies blue open circles as All data, orange solid circles as Lowest P S R, the solid green line as Model fit, and the dashed green line as Scaled model.




 Open access

