INTRODUCTION
Nitrogen (N) is one of the key elements that determine crop growth and yield formation (Vold Reference Vold1998) and N fertilizer is a reasonably expensive input produced in an energy-intensive industrial process. As the production and use of N fertilizers cause a high environmental footprint (carbon dioxide (CO2) and nitrous oxide (N2O) emissions, N leaching and denitrification), there is a definite urge to improve N use efficiency in agricultural systems through breeding and crop management (Sylvester-Bradley & Kindred Reference Sylvester-Bradley and Kindred2009; White & Brown Reference White and Brown2010).
According to Moll et al. (Reference Moll, Kamprath and Jackson1982), N use efficiency (NUE) characterizes grain yield produced per unit of available N and comprises two components: N uptake efficiency (NUPE) and N utilization efficiency (NUTE).
The definitions used for the NUE indices were calculated as follows:
 $${\rm NUE} = \displaystyle{{{\rm kg\; grain}} \over {{\rm kg\; available\; N}\, ({\rm soil}\; {\rm N} + {\rm fertilizer}\; {\rm N})}}$$
 $${\rm NUPE} = \displaystyle{{{\rm kg\; biomass\; N\; yield}} \over {{\rm kg\; available}\; {\rm N}\; ({\rm soil}\; {\rm N} + {\rm fertilizer}\; {\rm N})}}$$
 $${\rm NUTE} = \displaystyle{{{\rm kg}\; {\rm grain\;}} \over {{\rm kg\; biomass\; N}\; {\rm yield}}}$$
 $$\hskip-6.5pt{\rm Nitrogen \,\; harvest \,\; index}\, ({\rm NHI}) = \displaystyle{{{\rm kg\;\, grain\;\, N\;\, yield\;}} \over {{\rm kg\;\, biomass}\;\, {\rm N}\;\, {\rm yield}}}\hskip-4pt$$
where available N was estimated as a sum of fertilizer applied N and soil available N (kg/ha). The mean biomass N yield in unfertilized plots was used to represent the soil available N.
In barley, the contribution of NUPE and NUTE to NUE has been found to vary depending on conditions: NUPE is found to dominate in the studies of Muurinen et al. (Reference Muurinen, Slafer and Peltonen-Sainio2006) and Sylvester-Bradley & Kindred (Reference Sylvester-Bradley and Kindred2009), as opposed to NUTE in others (Abeledo et al. Reference Abeledo, Calderini and Slafer2008; Bingham et al. Reference Bingham, Karley, White, Thomas and Russell2012). This agrees with studies in wheat (Foulkes et al. Reference Foulkes, Hawkesford, Barraclough, Holdsworth, Kerr, Kightley and Shewry2009 and references therein). It is possible that under low or moderate N availability, NUTE would play a more important role (Beatty et al. Reference Beatty, Anbessa, Juskiw, Carroll, Wang and Good2010; Bingham et al. Reference Bingham, Karley, White, Thomas and Russell2012), whereas at higher N availability NUTE and NUPE would contribute equally to NUE (Foulkes et al. Reference Foulkes, Hawkesford, Barraclough, Holdsworth, Kerr, Kightley and Shewry2009; Beatty et al. Reference Beatty, Anbessa, Juskiw, Carroll, Wang and Good2010). Moreover, crop management, fertilizer practices (application methods, timing and rate) and cultivar choice are likely to affect expression of NUE (Lemaire et al. Reference Lemaire, Recous and Mary2004; Muurinen et al. Reference Muurinen, Slafer and Peltonen-Sainio2006; Sylvester-Bradley & Kindred Reference Sylvester-Bradley and Kindred2009; Bingham et al. Reference Bingham, Karley, White, Thomas and Russell2012).
One of the main drivers for the recorded yield improvements of cereals over the last century has been the introduction of external N fertilizer and increases in N application rates (Sylvester-Bradley & Kindred Reference Sylvester-Bradley and Kindred2009; Beatty et al. Reference Beatty, Anbessa, Juskiw, Carroll, Wang and Good2010; Lillemo et al. Reference Lillemo, Reitan and Bjørnstad2010), along with the mechanization of agriculture and changes to crop management practices (Lillemo et al. Reference Lillemo, Reitan and Bjørnstad2010; Peltonen-Sainio et al. Reference Peltonen-Sainio, Salo, Jauhiainen, Lehtonen and Sieviläinen2015). In addition, breeding for higher-yielding cultivars has been successful (Peltonen-Sainio & Jauhiainen Reference Peltonen-Sainio and Jauhiainen2010; Bingham et al. Reference Bingham, Karley, White, Thomas and Russell2012), with the improved grain yields being associated with many drastic modifications in plant stand structure, such as reduced straw length, increased grain number and higher harvest index (HI) (Austin et al. Reference Austin, Bingham, Blackwell, Evans, Ford, Morgan and Taylor1980; Ortiz et al. Reference Ortiz, Nurminiemi, Madsen, Rognli and Bjørnstad2002; Bertholdsson & Kolodinska-Brantestam Reference Bertholdsson and Kolodinska-Brantestam2009; Bingham et al. Reference Bingham, Karley, White, Thomas and Russell2012). These genetic improvements in grain yield have often been accompanied with improved NUE (Sylvester-Bradley & Kindred Reference Sylvester-Bradley and Kindred2009; Bingham et al. Reference Bingham, Karley, White, Thomas and Russell2012), but also with decreased grain protein content (Sylvester-Bradley & Kindred Reference Sylvester-Bradley and Kindred2009; Bingham et al. Reference Bingham, Karley, White, Thomas and Russell2012; Peltonen-Sainio et al. Reference Peltonen-Sainio, Jauhiainen and Nissilä2012). Low protein content is not necessarily a negative characteristic for malting barley, but it is for bread wheat and feed barley (Foulkes et al. Reference Foulkes, Hawkesford, Barraclough, Holdsworth, Kerr, Kightley and Shewry2009; Peltonen-Sainio et al. Reference Peltonen-Sainio, Jauhiainen and Nissilä2012) where low grain N may necessitate the need to increase N fertilizer application rates. An alternative means of improving N use without excessive N fertilizer is to improve N uptake and allocation to the grains. Such genetic improvements in NHI have been found for spring barley in Scotland (Bingham et al. Reference Bingham, Karley, White, Thomas and Russell2012), but not for Canada and Argentina (Bulman et al. Reference Bulman, Mather and Smith1993; Abeledo et al. Reference Abeledo, Calderini and Slafer2008).
Stresses, especially plant diseases, reduce grain yield and hence, use efficiency of agricultural inputs. Globally, pests and diseases inflict an average of 16% reduction in yield despite commonly applied crop protection practices in food production chains (Oerke Reference Oerke2006). According to long-term trials, fungicide treatments have increased barley yields in Finland by on average 650 kg/ha, corresponding to a 13% increase (T. Purola, personal communication). During the past 40 years, the total barley area in Finland has increased by 50%, leading to shorter crop rotations or monocultures on many farms. Simultaneously, traditional ploughing has been replaced by reduced and no-tillage systems, which again has enhanced the risks for seed- and stubble-borne diseases: net blotch (Pyrenophora teres f. teres and P. teres f. maculata), scald (Rhynchosporium commune) and spot blotch (Bipolaris sorokiniana). The means of disease control are changing with the current EU pesticide directive (2009/128/EC, EC 2009) that emphasizes the need for an integrated pest management (IPM) approach in crop protection that includes non-chemical alternatives. Plant disease resistance is an economical and environmentally feasible approach to control plant diseases, but disease resistance has not always been the core target of barley breeding programmes. Genetic disease resistance in plants results from the long-term co-evolution of plants and their pathogens, with plants evolving resistance mechanisms while plant pathogens have evolved means to recognize these defence systems (Stukenbrock & McDonald Reference Stukenbrock and McDonald2009).
Genetic diversity within breeding germplasm is necessary for progress to be made in breeding objectives including higher yields, efficient N use and disease resistance. However, it has been postulated that the genetic diversity of European barley has been decreased due to bottlenecks and strict selection during a century of breeding (Fishbeck Reference Fishbeck, Munck, Kirkegaard and Jensen1992; Melchinger et al. Reference Melchinger, Graner, Singh and Messmer1994). Conflicting results have been published on temporal changes in genetic diversity of barley, depending on the germplasm studied and the marker type used in each study (Graner et al. Reference Graner, Ludwig and Melchinger1994; Russell et al. Reference Russell, Ellis, Thomas, Waugh, Provan, Booth, Fuller, Lawrence, Young and Powell2000; Matus & Hayes Reference Matus and Hayes2002; Koebner et al. Reference Koebner, Donini, Reeves, Cooke and Law2003; Malysheva-Otto et al. Reference Malysheva-Otto, Ganal, Law, Reeves and Röder2007). According to studies using random amplification of polymorphic DNA (RAPD), inter-simple sequence repeat (ISSR) or simple sequence repeat (SSR) markers, Nordic barley has retained its genetic diversity despite a century of breeding (Manninen & Nissilä Reference Manninen and Nissilä1997; Kolodinska-Brantestam et al. Reference Kolodinska-Brantestam, von Bothmer, Dayteg, Rashal, Tuvesson and Weibull2004, Reference Kolodinska-Brantestam, von Bothmer, Dayteg, Rashal, Tuvesson and Weibull2007). A more recent study on a large collection of European two-row spring barley germplasm found that although genetic diversity has changed overall, different genomic regions differ in diversity, probably due to breeding efforts (Tondelli et al. Reference Tondelli, Xu, Moragues, Sharma, Schnaithmann, Ingvardsen, Manninen, Comadran, Russell, Waugh, Schulman, Pillen, Rasmussen, Kilian, Cattivelli, Thomas and Flavell2013).
The current study aimed to evaluate breeding effect on NUE and its components as well as some agronomic traits in northern European barley, as the germplasm adapted to high latitude conditions is distinctive and the growing conditions set specific constraints not only on the cultivars used, but also for N dynamics and management. It also aimed to investigate how the resistance against the four major seed- and stubble-borne diseases of barley: spot and net types of net blotch, scald and spot blotch, has evolved from Nordic barley landraces to commercial cultivars. In addition, temporal changes in genetic diversity of the germplasm collection were monitored with single nucleotide polymorphism (SNP) markers.
MATERIALS AND METHODS
Field experiments and statistical analyses
Two-year field experiments were conducted during 2011/12 at the experimental farm of the Natural Resources Institute Finland (Luke) (former MTT Agrifood Research Finland) in Jokioinen, southern Finland (60° 48′N, 23°28′E, 84 m asl). All together 195 genotypes [72 landraces from the Nordic Genetic Resource Center (NordGen), 122 cultivars and one breeding line] were grown in two N regimes (35 and 70 kg N/ha) with three replications. Landraces were all of Scandinavian origin, whereas the set of cultivars was ⅓ of Finnish origin, ⅓ Scandinavian and Baltic origin and ⅓ from other regions. Prior to sowing, blocks were placement fertilized with compound nitrogen : phosphorus : potassium (NPK) fertilizer (N-P-K: 20–3–8) at the rate of 35 and 70 kg N/ha and a total of 27 unfertilized plots (with nine genotypes) were placed at the other end of the fertilization blocks to facilitate the evaluation of soil-released N. Plots were sown at 450 viable seeds/m2 in plots of 3·9 m2 (3·1 × 1·25 m2) In 2011, weeds were controlled with Logran 20 WG, active ingredient (a.i) triasulfuron 200 g/kg, at 20 kg/ha and K-MCPA, a.i. 2-methyl-4-chlorophenoxyacetic acid (MCPA) 750 g/l at 0·5 l/ha and in 2012 with Ariane S, a.i. MCPA 200 g/l, fluroxypyr 40 g/l, clopyralic 20 g/l) at 1·75 l/ha. The diseases were controlled at flag leaf stage (growth stage (GS) 39, Zadoks et al. Reference Zadoks, Chang and Konzak1974) with Proline, a.i. protioconazole 250 g/l, at 0·8 l/ha. Heading date (GS 58) and yellow ripeness (GS 90) were recorded as days from sowing. Percentage of plot area lodged (%) was monitored three times during the grain-filling period; at early, mid and late grain-filling. At heading, 50 plants were randomly uprooted from each plot to determine biomass (mg/plant) and biomass N concentration (g/kg, Kjehdahl method). At physiological maturity (GS 92), 50 plants were randomly collected from each plot to determine vegetative biomass (mg/plant), grain yield (mg/plant), HI, NHI and N concentration in grain (grain N, g/kg, near infra-red (NIR) method) and vegetative above-ground biomass (straw N) g/kg, Kjehdahl method). Biomass N yield, grain N yield and straw N yield (kg N/ha) were calculated based on grain yield, HI and grain and straw N. Plots were harvested with a combine harvester and grain yield (kg/ha converted to 15% moisture content), hectolitre weight (HLW, kg), single grain weight (SGW, mg) and grain number/m2 (GRNO) were measured.
The experimental design was a modified strip-plot design with row- and column-factors being 195 genotypes and two N regimes, respectively. In the experimental design used, the levels of row-factors were randomized according to incomplete block design (six incomplete blocks for each replication), which reduced the within-block variation. The statistical model used to analyse the data was:
 $$\eqalign{ y_{ijklmn} &= \mu + {\rm yea}{\rm r}_i + {\rm replication} \,({\rm year})_{ij} \cr &\quad + {\rm incomplete \;block} \,({\rm replication} \times {\rm year})_{ijk} \cr &\quad + {\rm origi}{\rm n}_l + {\rm cultivar} \;({\rm origin})_{lm} + {\rm errorA} \cr &\quad + {\rm Nfer}{\rm t}_n + {\rm errorB} + {\rm origin} \times {\rm Nfer}{\rm t}_{ln} \cr &\quad + b\; \times \;{\rm YOR} + b_{n{^\ast}}{\rm Nfert}\; \times \;{\rm YOR} \cr &\quad + b_l{^\ast}{\rm origin}\; \times \;{\rm YOR} + b_{nl}{^\ast}{\rm origin}\; \cr &\quad \times \;{\rm Nfert}\; \times \;{\rm YOR} + {\rm TO}{\rm B}_m + \varepsilon _{ijklmn}} $$
where year i , replication (year) ij and incomplete block (replication × year) ijk are random effects of environments: year (i = 2011, 2012), replication (j = 1,..,3), and incomplete block (k = 1,…,6). Originl is fixed effect of origin (l = Finland, Scandinavian/Baltic, other regions), while cultivar (origin) lm represents variation between cultivars within origin (m = 1,…,195). Nfert n and origin × Nfert ln are fixed effects of fertilization (n = 35 or 70 kg N/ha) and fertilization × origin interaction, respectively. As in the traditional analysis of variance for the strip-plot design, errorA and errorB are error terms for the origin and the fertilization level. In addition, year of release (YOR) of a cultivar was added as a regression slope to the model (b 1*YOR). Slope was allowed to vary between fertilization levels, as well as between origins and combinations of origin × fertilization levels (slopes: b n , b l, b nl ). The model takes into account the average difference between two-row and six-row cultivars (TOB m = 2 or 6, m = 1,…,195) with ε ijklmn being the residual error.
A variance components model was fitted to find out the most important interactions and this included all the possible main effects and interaction effects as random effects. The coefficients of variation in NUE and yield related traits were analysed by the row type. In addition, a third model was fitted to the data, which was similar to the first model, but the YOR was used as the categorical variable.
Pearson correlation coefficients were calculated to describe the relationships among traits; other variables were calculated separately for two-row and six-row barleys. Principal component analysis (PCA) was performed to find relationships between the 17 variables and again was performed separately for two-row and six-row barley data. Two similar factors were found from both analyses that explained 61–66% of the total variance.
Statistical analyses were carried out with SAS/MIXED software (SAS 9.2, SAS Institute Inc., 2002–08) and the restricted maximum likelihood (REML) estimation method. Scatter plots of residual and predicted values and box-plots of residuals were used to check assumptions about normal distribution and a common variance and the PCA were carried out with SAS/FACTOR software.
Disease resistance screening
The disease resistance of the barley germplasm was tested against four leaf diseases: net type net blotch, spot type net blotch, spot blotch and scald. Resistance studies were made for each disease in separate trials in a greenhouse.
Two viable seeds of each barley accession were sown per pot (0·2 l) containing nutrient supplemented peat (90 kg N/ha) in four replicates using a randomized complete block design. Plants were grown in a photoperiod of 16 h light and 8 h darkness. The temperature was 18–20 °C during the day and 15 °C during the night, except for spot blotch with day temperatures of 20–22 °C. Inoculations were made at the two to three leaf stage (GS 13). Relative humidity was 100% and plants were inoculated with a conidial suspension at 0·2 ml/plant. Lights were switched off and humidity was maintained for 24 h after inoculation. Infection was recorded 10 (net blotch, spot blotch) and 16 (scald) days after inoculation on the second seedling leaf. Net blotch was recorded according to Tekauz (Reference Tekauz1985), spot blotch according to scale of Fetch & Steffenson (Reference Fetch and Steffenson1999) and scald according to 1–4 scale (Jackson & Webster Reference Jackson and Webster1976).
The median value of disease assessments for each accession and disease was used to compare overall resistance of cultivars released in different decades to that in landraces. The breeding age groups for cultivar release were 1910–59, 1960–79, 1980–95, 1996–2011. The average disease rating of each period was compared pair-wise with that of landraces using PROC GENMOD available in SAS 9.3 procedure in SAS/STAT version 9.3 (SAS Institute Inc., Cary, NC, USA). Maximum likelihood statistics were used to calculate estimates for corresponding disease ratings and probabilities for their Wald χ2 values.
Diversity analyses
A small-scale cetyltrimethyl ammonium bromide (CTAB) method (Tinker et al. Reference Tinker, Fortin and Mather1993) was used to extract DNA from young leaves of each barley genotype. These DNA samples were sent to UCLA, Los Angeles for genotyping with 1536 SNP markers using the Barley Oligonucleotide Pool Assay (BOPA1) set described in Close et al. (Reference Close, Bhat, Lonardi, Wu, Rostoks, Ramsay, Druka, Stein, Svensson, Wanamaker, Bozdag, Roose, Moscou, Chao, Varshney, Szűcs, Sato, Hayes, Matthews, Kleinhofs, Muehlbauer, DeYoung, Marshall, Madishetty, Fenton, Condamine, Graner and Waugh2009). A cluster analysis to group genotypes (Q matrix) was performed using STRUCTURE software (version 2.3.2) with no admixture model (Pritchard et al. Reference Pritchard, Stephens and Donnelly2000; Falush et al. Reference Falush, Stephens and Pritchard2003; Hubisz et al. Reference Hubisz, Falush, Stephens and Pritchard2009). To estimate the number of clusters (K), four runs of 20 000 iterations were used following 10 000 burn-in iterations for values of K between 1 and 10. The best number of clusters (K) was identified by using the delta K method, which was based on the estimated probability of data Ln P(D) (Evanno et al. Reference Evanno, Regnaut and Goudet2005). To analyse genetic diversity and differentiation of barley germplasm, gene diversity (D), percentage of polymorphic loci (P) and population fixation values (F st) were calculated with GenAlex 6·4 (Peakall & Smouse Reference Peakall and Smouse2006, Reference Peakall and Smouse2012). Shannon diversity index and F st was calculated for each SNP marker to show genetic diversity and differentiation along the barley chromosomes. Analysis of Molecular Variance (AMOVA) and Principal Coordinates Analysis (PCoA) based on Euclidean distances between individuals were used to inspect diversity separately in the two-row and six-row germplasm (Peakall & Smouse Reference Peakall and Smouse2006, Reference Peakall and Smouse2012). Barley genotypes were divided into five breeding age groups: landraces and varieties released during 1910–59, 1960–79, 1980–95 or 1996–2011. In total, 1203 SNPs were used in the analyses, as markers with more than 20% missing data were removed from diversity analyses.
RESULTS
Nitrogen use efficiency traits
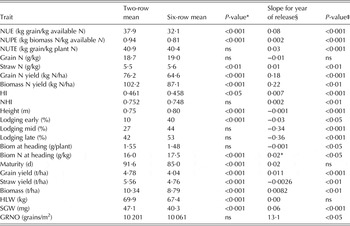
Two-row genotypes expressed substantially higher mean values than six-row genotypes for grain N yield (76·2 and 64·6 kg N/ha) and biomass N yield (102·2 and 87·1 kg N/ha), which meant that both NUE (37·9 and 32·1 kg yield/kg available N) and NUPE (0·94 and 0·81 kg biomass N/kg available N) were higher in two-row barleys (Table 1). Correlation of NUE with NUPE and NUTE varied slightly according to the row type, but in both row types NUE was more closely correlated with NUPE (r = 0·88–0·84, P < 0·001, in two- and six-row, respectively, Supplementary Table S1, available from http://journals.cambridge.org/AGS) than with NUTE (r = 0·73–0·74, P < 0·001, in two- and six-row, respectively). In Supplementary Table S1, correlation coefficients for N- and yield related traits are presented for both row types.
Mean Pearson correlation coefficients for year of release and measured traits calculated over N-rates and mean annual breeding induced change. Slope is given over the head type, as breeding responses were similar in both row types

N, nitrogen; NUE, N use efficiency; NUPE, N uptake efficiency; NUTE, N utilization efficiency; HI, harvest index; NHI, N harvest index; HLW, hectolitre weight; SGW, single grain weight GRNO, grain number per m2.
* Significance between two- and six-row mean values.
§ Genetic gain in a year.
‡ Significance of slope.
Response to breeding was found to be significant for almost all traits studied, without a significant interaction with row type. Breeding has markedly improved NUE in barley by 0·08 kg/year (Table 1). In total, NUE has increased by 26% over 100 years with both of its components, NUTE and NUPE, also improved by breeding (8 and 26%, respectively, Table 1). Positive breeding effects were evident for N traits such as biomass N yield and grain N yield and NHI (Table 1). Grain N yield has increased by 0·18 kg/year, which again represents a 21% improvement over the 100 years. Similar improvements were evident also for biomass N yield (Table 1) and to a lesser extent for NHI with an annual increase of 0·02% (Table 1). Grain N was an exception to this trend, with no significant change found (Table 1). The breeding effect on NUE, NUPE and NUTE was found equally in two- and six-row barleys, but there was more variation within six-row germplasm as correlation coefficients between N traits and the YOR were smaller than in two-row (data not shown). Furthermore, the coefficient of variation in NUE was smaller in the most recent six-row genotypes when compared with other age groups, whereas in two-row genotypes no marked change was observed. For other NUE-related traits, no apparent breeding-induced change in coefficient of variation was evident in either row type (data not shown). There was no breeding effect apparent for biomass (mg/plant) and biomass N (g/kg) measured at heading stage (data not shown). However, when genetic gain was calculated over the row type and N rate, a slight positive breeding effect was found on biomass N at heading (Table 1). Biomass and biomass N at heading did not correlate with yield or plant N traits (data not shown), except that the straw N at maturity correlated positively with biomass N at heading (r = 0·62, P < 0·001 and r = 0·68, P < 0·001 in two- and six-row, respectively).
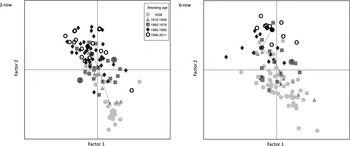
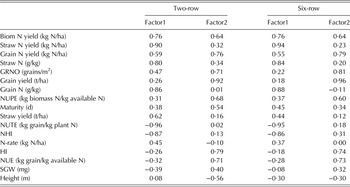
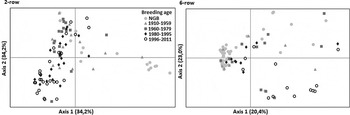
Factors and their loadings in PCA were similar for both row types (Table 2). The first factor generally represents plant N traits and the second factor grain yield traits (Table 2). High negative loadings were found for NUTE and NHI, whereas grain and straw N (g/kg) and straw N yield (kg N/ha) had positive loadings on the first factor (Table 2). Grain yield, GRNO, grain N (g/kg), HI, NUE and NUPE had positive loadings on the second factor, whereas plant height had negative loading (Table 2). A scatter plot of the factor scores separated cultivars of different ages and revealed positive breeding effect on both factors, more perceptible on the second, yield-related factor (Fig. 1).
Principal Component Analysis score scatter plots of two- and six-row barley cultivars. Factor 1 represents plant N and factor 2 yield traits. Closed circle with number 1 is the mean value for 2011 and number 2 for 2012. NordGen collection is included in group NGB.

Factor loadings for 17 variables in two- and six-row barley

N, nitrogen; GRNO, grain number per m2; NUPE, N uptake efficiency; NUTE, N utilization efficiency; NHI, N harvest index; HI, harvest index; NUE, N use efficiency; SGW, single grain weight.
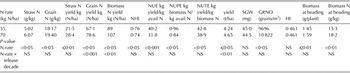
Increase in N fertilizer rate from 35 to 70 kg N/ha decreased NUE, NUPE, NUTE and NHI, whereas straw and grain N and biomass N yield, grain N yield and straw N yield were increased (Table 3). Higher N fertilizer rate decreased NUE by 21%, NUPE by 12% and NUTE by 9% compared with 35 kg N/ha, when calculated across row types (Table 3). When examining breeding effect on responses of studied N traits to N rate depending on row type, no marked differences were found (data not shown). Statistical analyses showed that interaction between N rate and YOR was not significant for NUE, NUPE, NUTE and NHI (Table 3). On the other hand, interaction was found for grain N yield and biomass N yield (Table 3): increase in N rate increased total grain N yield by 14 and 32% and biomass N yield by 21 and 28% in landraces and the most recently released cultivars, respectively.
Means for yield and nitrogen use efficiency (NUE) traits by nitrogen (N)-rate. Results are presented over the row type

NS, not significant; N, nitrogen; NUPE, N uptake efficiency; NUTE, N utilization efficiency; NHI, N harvest index; NUE, N use efficiency; SGW, single grain weight; GRNO, grain number per m2.
Yield traits
Many changes in plant stand and yield traits were found to associate with improvements in N traits. Breeding had markedly improved grain yield (Table 1), though variation among genotypes was notable. The most recent cultivars of both row types yielded on an average 35 and 40% more than landraces at 35 and 70 kg N/ha rate, respectively. Though two-row cultivars clearly out-performed six-row cultivars in grain yield (mean difference 750 kg/ha), in relative terms the yield improvements associated with breeding were equal for both row types (Table 1). Modern cultivars and two-row barley utilized N fertilizer more effectively for yield formation, as when N rate was increased from 35 to 70 kg N/ha, the average increase in yield was approximately 200 and 300 kg/ha in landraces and in modern cultivars and 500 and 600 kg/ha in two- and six-row barleys, respectively. This corresponds to a 5 and 8% increase in landraces and 14 and 17% increase in cultivars for two- and six-row barleys, respectively. Though lower yielding at both N rates, six-row genotypes expressed slightly higher proportional yield response to increase in N fertilizer rate than two-row genotypes. Along with yield, breeding improved yield-related traits such as total above-ground biomass, SGW, HI and GRNO, whereas straw length and lodging were reduced (Table 1). Similar to the breeding improvements in N traits, impacts on yield and yield related traits were generally more strongly correlated with YOR in two- than six-row genotypes (data not shown). Again the coefficient of variation in yield, SGW, GRNO and HI was smaller in the most recent six-row genotypes, whereas in two-row genotypes no marked breeding associated change in coefficient of variation was observed (data not shown). Increase in N rate from 35 to 70 kg N/ha elevated the mean grain yield by 410 kg/ha. This was driven by higher GRNO, whereas SGW and HI tended to be slightly lower at higher N rate (Table 3). Little, if any, genotype × N rate interaction occurred in yield, yield traits and N traits, and thus mean values were shown across row type in Table 3. Furthermore, the variance component model showed that all interactions with genotype explained only 4–6% and genotype × N rate interaction <1% of the total variation. The differences between genotypes were evident since genotype explained 20–80% of the total variation.
Genetic diversity and population structure
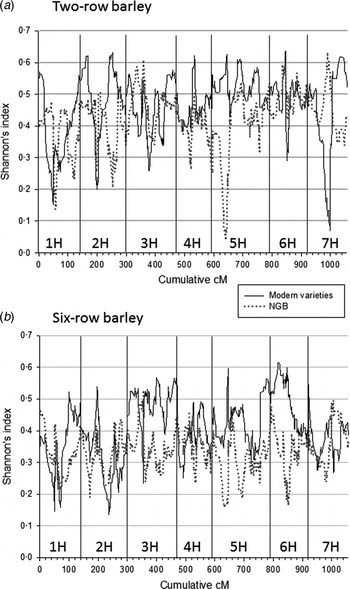
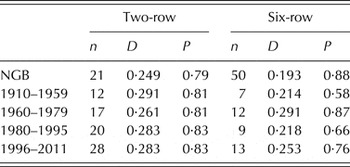
When changes in genetic diversity during barley breeding history were analysed with SNP markers, gene diversity (unbiased expected heterozygosity) and percentage of polymorphic loci remained at roughly the same level in both two- and six-row barleys (Table 4). However, diversity in six-row barley varied more, which might be a consequence of the limited number of genotypes in some of the year groupings. When genetic diversity along the barley chromosomes was studied (Fig. 2), genomic regions of high and low diversities were evident. Both two- and six-row barley landraces were especially low in diversity on chromosome 5H (36-50 cM) while modern varieties were very diverse in that region. On chromosome 7H (around 78 cM), two-row modern varieties lacked diversity in contrast to landraces where diversity was maintained. This difference was not observed in six-row barley, where the biggest difference in diversity between landraces and modern varieties were observed around the centromeric region of chromosome 6H (around 55 cM) where modern varieties were much more diverse (Fig. 2).
Genetic diversity along barley chromosomes between modern varieties and landraces (NGB) in two- (a) and six-row (b) barley, respectively. Shannon indexes are calculated as rolling means between 20 adjacent loci.

Genetic diversity (D) and proportions of polymorphic loci (P) in different breeding age groups; n is the number of varieties/lines within each age group. Landraces from NordGen collection are included in group NGB

NGB, landraces from NordGen collection.
The analysis of genetic structure of the whole barley germplasm studied revealed an optimum (the highest increase of delta K value) for two groups. Each group contained mostly either six-row or two-row genotypes (data not shown). Hence, AMOVA was done separately according to row type and it revealed that within six- and two-row genotypes 12 and 10%, respectively, of the variation was due to differences between breeding age groups. Significant genetic differentiation among breeding age groups was observed for both row types (Table 5). In two-row genotypes, landraces clearly differed from all breeding age groups, which was also evident from the PCoA plot (Table 5, Fig. 3). In six-row barley, landraces did not differ from the earliest breeding age group (years 1910–1959). In both row-types, F st values between landraces and cultivars was higher than the later breeding age group. In the PCoA plot, six-row landraces formed a tight cluster, indicating some redundancy in the collection (Fig. 3). Although the level of diversity has been maintained despite breeding progress, genetic differentiation has occurred between old and more modern varieties. When F st values between landraces and modern varieties were calculated along the chromosomes, substantial differentiation (F st up to 0·75) was found on chromosomes 3H (52·5 and 127·1 cM), 5H (179·6 cM), and 6H (5·4 cM) in two-row barley and on 2H (69·3 cM) and 3H (56·4 cM) in six-row barley (data not shown).
Plots from principal coordinate analyses of two- and six-row barley. NordGen collection is included in group NGB.

Population fixation values (Fst) describing differentiation between breeding age groups. Values above diagonal represent six-row barley and values below diagonal two-row barley

NGB, landraces from NordGen collection.
Comparison of disease resistance between barley cultivars and landraces
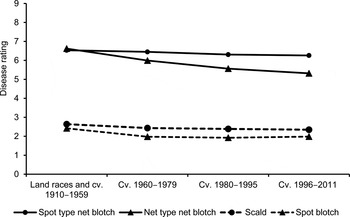
Breeding-associated improvements in disease resistance were detected against the four barley diseases tested: net type net blotch, spot type net blotch, scald and spot blotch (Fig. 4). Most progress had taken place in resistance against net type net blotch, in which the average score of 6·9 for landraces was decreased to 5·3 for cultivars released after 2000. This corresponds to a 23% reduction in scores for susceptibility. Similarly, the disease scorings had decreased 12 and 21% in modern cultivars for scald and spot blotch, respectively. Only a 5% decrease in average disease scorings was found against spot type net blotch.
The average disease scorings of barley landraces and cultivars for net and spot type net blotch, scald and spot blotch according to the year of release.

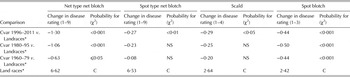
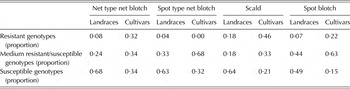
When the genotypes were classified according to the decade when they were released, statistically significant differences in disease resistance were found between landraces and cultivars (Table 6). The disease severity in cultivars released after 1990 was significantly lower for all four leaf diseases tested compared with the landraces (Table 6). When classifying the resistance reaction of the genotypes to three classes, resistant, medium resistant/susceptible and susceptible, the highest number of resistant genotypes was found against scald, 46 and 18% of cultivars and landraces, respectively (Table 7). However, none of the barley cultivars showed good resistance against spot type net blotch, while 4% of the landraces were resistant (Table 7). The frequency of genotypes classified as susceptible was highest among landraces for all the four diseases, whereas the cultivars were mostly categorized as medium resistant/susceptible for spot type net blotch and spot blotch and as resistant for scald (Table 7).
Maximum likelihood estimates of changes of disease ratings of net and spot type of net blotch, scald and spot blotch in cultivars released during different decades from 1960 to 2011 in comparison with landraces and cultivars released during 1910–59

C, control; NS, not significant.
* cultivars released during 1910–59.
Resistance type frequencies (proportion) in barley landraces and cultivars against net and spot type net blotch, scald and spot blotch

DISCUSSION
Breeding effect on nitrogen use efficiency
Breeding barley to cope with the prevailing and often variable conditions of northern Europe has been successful in improving not only grain yield but also the important N use efficiency traits: NUE, NUPE and NUTE. When comparing age groups, the breeding associated improvement was apparently independent of N rate in both row types, and no N-rate × age group interactions were observed. Applied N rates were low (35 kg N/ha) and moderate (70 kg N/ha) and potentially, modern cultivars could have shown higher relative efficiency at higher N application rates, but nevertheless, these data showed continuous and similar breeding improvements for most relevant traits at both N rates. The superior grain yield and grain N yield production of bred cultivars compared with landraces was found at low N application rate. Similarly, modern cultivars utilized higher N fertilizer availability more efficiently for grain yield production than landraces and older cultivars, especially in 2012 (data not shown). Breeding-induced improvement in NUE has been realized as higher grain yields in the absence of fertilizer (Bingham et al. Reference Bingham, Karley, White, Thomas and Russell2012), or steady or increasing yields at decreasing fertilizer application rates (Lillemo et al. Reference Lillemo, Reitan and Bjørnstad2010). Accordingly, improvements in NUE seem to be realized regardless of fertilizer application rate. However, in general, barley genotypes responded systematically to higher N rate by having less efficient N use. These results from the northernmost European conditions agree with those found elsewhere (Sylvester-Bradley & Kindred Reference Sylvester-Bradley and Kindred2009; Beatty et al. Reference Beatty, Anbessa, Juskiw, Carroll, Wang and Good2010; Anbessa & Juskiw Reference Anbessa and Juskiw2012; Bingham et al. Reference Bingham, Karley, White, Thomas and Russell2012).
Regarding sub-components of NUE, breeding has been more efficient in increasing NUPE compared with NUTE. Annual increases in NUPE and NUTE were approximately 0·26 and 0·08%, respectively, with NUPE accounting for around 70% and NUTE 30% of the variation in NUE (data not shown). This finding agrees with those of Muurinen et al. (Reference Muurinen, Slafer and Peltonen-Sainio2006) and Sylvester-Bradley & Kindred (Reference Sylvester-Bradley and Kindred2009), who reported a stronger breeding effect for NUPE, although other studies have reported a larger effect on NUTE (Abeledo et al. Reference Abeledo, Calderini and Slafer2008; Bingham et al. Reference Bingham, Karley, White, Thomas and Russell2012). Such differences seem to be common for cereals, as differing effects of past breeding and the correlation of NUE with either NUPE or NUTE have also been reported for wheat (Foulkes et al. Reference Foulkes, Hawkesford, Barraclough, Holdsworth, Kerr, Kightley and Shewry2009 and references therein). Potentially, the contribution of NUPE and NUTE to NUE varies depending on N availability, with NUTE contributing more at conditions of low N availability (Foulkes et al. Reference Foulkes, Hawkesford, Barraclough, Holdsworth, Kerr, Kightley and Shewry2009; Beatty et al. Reference Beatty, Anbessa, Juskiw, Carroll, Wang and Good2010; Bingham et al. Reference Bingham, Karley, White, Thomas and Russell2012). However, in the current study, NUPE was more closely associated with NUE at both N rates, whereas correlation of NUTE was slightly weaker. After a review of the relevant literature (Muurinen et al Reference Muurinen, Slafer and Peltonen-Sainio2006; Abeledo et al. Reference Abeledo, Calderini and Slafer2008; Anbessa et al. Reference Anbessa, Juskiw, Good, Nyachiro and Helm2009; Sylvester-Bradley & Kindred Reference Sylvester-Bradley and Kindred2009; Gaju et al. Reference Gaju, Allard, Martre, Snape, Heumez, LeGouis, Moreau, Bogard, Griffiths, Orford, Hubbart and Foulkes2011; Anbessa & Juskiw Reference Anbessa and Juskiw2012; Bingham et al. Reference Bingham, Karley, White, Thomas and Russell2012), no firm conclusion can be drawn for the reasons behind varying NUE, NUPE and NUTE relationships. On the other hand, NUTE is an unambiguous trait to measure, whereas NUE and NUPE are traits that contain an estimation of soil N availability, which is difficult to measure and prone to more variation compared with estimates of plant N. In addition, soil N estimation based on N uptake of non-fertilized plots is inclined to result in overestimation of NUE and NUPE values (Beatty et al. Reference Beatty, Anbessa, Juskiw, Carroll, Wang and Good2010; Bingham et al. Reference Bingham, Karley, White, Thomas and Russell2012).
As the results indicate, breeding has improved NUE and other N related traits in barley genotypes. This has presumably been achieved indirectly through the association of these traits with grain yield traits. Root characteristics influence water and nutrient uptake capacity and hence yield performance, but no root measurements were carried out in the current study. In another Nordic barley study, breeding has been shown to increase specific root length (SRL) along with grain yield (Bertholdsson & Kolodinska-Brantestam Reference Bertholdsson and Kolodinska-Brantestam2009), but whether similar responses would have been evident in the current study is not known. In the future, tools to breed directly for more efficient N use and N allocation to harvested plant organs will potentially need to be in conjunction with changes to agronomy such as precision agriculture (Bongiovanni & Lowenberg-Deboer Reference Bongiovanni and Lowenberg-Deboer2004; Huggins et al. Reference Huggins, Pan, Smith, Kruger, Yorgey, Chen, Collins, Feise, Frear, Granatstein, Higgins, Huggins, MacConnell, K. Painter and Stöckle2010) to reduce the environmental footprint of agriculture.
Reduction in grain nitrogen
The current study found a reduction in grain N by 0·001 g/kg/year, albeit non-significant. Any such change is unlikely to be the result of direct selection, but rather induced by an increase in grain yield and consequent reduction in grain N, i.e. a dilution effect. There was a negative correlation between grain yield and grain N in both row types. While breeding has improved grain yield by 35–40%, the simultaneous reduction in grain N has been 7–8%. It would seem, therefore, without the increases in NUPE and NHI that accompanied increases in grain yield, decrease in grain N could have been substantially higher. This negative correlation between grain yield and grain N agrees with the findings of other studies (Sylvester-Bradley & Kindred Reference Sylvester-Bradley and Kindred2009; Bingham et al. Reference Bingham, Karley, White, Thomas and Russell2012; Peltonen-Sainio et al. Reference Peltonen-Sainio, Jauhiainen and Nissilä2012). Accumulating starch and other endosperm constituents dominate over the grain N accumulation and thereby reduce grain N (Bulman et al. Reference Bulman, Mather and Smith1993; Bingham et al. Reference Bingham, Karley, White, Thomas and Russell2012), though Peltonen-Sainio et al. (Reference Peltonen-Sainio, Jauhiainen and Nissilä2012) reported that some elite breeding lines expressed both high grain N and grain yield, resulting in superior total grain N yield. In the current study, grain N decreased and total grain yield and biomass N increased, agreeing with the findings of Bingham et al. (Reference Bingham, Karley, White, Thomas and Russell2012) and Peltonen-Sainio et al. (Reference Peltonen-Sainio, Jauhiainen and Nissilä2012), but the limited effect on grain N could imply that indirect selection for NUPE and NHI have largely enabled the maintenance of this important trait.
Possible avenues to increase grain N would be via improving soil and fertilizer N uptake capacity or increasing the allocation of straw N into grain (Foulkes et al. Reference Foulkes, Hawkesford, Barraclough, Holdsworth, Kerr, Kightley and Shewry2009; Bingham et al. Reference Bingham, Karley, White, Thomas and Russell2012). In fact, breeding had slightly improved NHI, which correlated negatively with grain N and positively with grain yield. Similar findings have been published recently (Bingham et al. Reference Bingham, Karley, White, Thomas and Russell2012) although other studies have found either the opposite (Montemurro et al. Reference Montemurro, Maiorana, Ferri and Convertini2006) or no correlation between NHI and grain yield and/or grain N (Bulman et al. Reference Bulman, Mather and Smith1993; Przulj & Momcilovic Reference Przulj and Momcilovic2001, Reference Przulj and Momcilovic2003).
Grain N correlated negatively with NUTE in both row types and this relationship has also been shown for wheat (Barraclough et al. Reference Barraclough, Howarth, Jones, Lopez-Bellido, Parmat, Shepherd and Hawkesford2010; Sadras & Lawson Reference Sadras and Lawson2013). To overcome this, NHI would need to be increased along with NUTE to alleviate the negative impact on grain N. In the current data, NUTE and NHI correlated positively. However, in modern cultivars, it may well be that NHI has already approached its threshold when reaching 80% (Sinclair & Rufty Reference Sinclair and Rufty2012), giving limited, if any, potential for further increases.
Breeding effect on yield and yield components
The current study found that breeding has improved grain yield and yield related traits, HI, GRNO and SGW, which agrees generally with other findings for cereals (Austin et al. Reference Austin, Bingham, Blackwell, Evans, Ford, Morgan and Taylor1980; Peltonen-Sainio & Rajala Reference Peltonen-Sainio and Rajala2007; Bertholdsson & Kolodinska-Brantestam Reference Bertholdsson and Kolodinska-Brantestam2009; Bingham et al. Reference Bingham, Karley, White, Thomas and Russell2012). Associated with grain yield, above-ground biomass was also increased, but straw biomass showed a slight decline. This agrees with experiments carried out in Scandinavia (Ortiz et al. Reference Ortiz, Nurminiemi, Madsen, Rognli and Bjørnstad2002; Bertholdsson & Kolodinska-Brantestam Reference Bertholdsson and Kolodinska-Brantestam2009) and Scotland (Bingham et al. Reference Bingham, Karley, White, Thomas and Russell2012), contrary to those in Canada (Bulman et al. Reference Bulman, Mather and Smith1993) and Argentina (Abeledo et al. Reference Abeledo, Calderini and Slafer2003). When change in straw biomass was assessed according to the geographical origin of the cultivars, Finnish, Scandinavian and Baltic cultivars showed slight negative correlation with YOR, whereas no such trend was evident for cultivars from other regions (data not shown).
One of the most important breeding-induced changes in cereal performance is the reduction in straw length and the consequent improvements in lodging tolerance and HI (Austin et al. Reference Austin, Bingham, Blackwell, Evans, Ford, Morgan and Taylor1980; Bulman et al. Reference Bulman, Mather and Smith1993; Bertholdsson & Kolodinska-Brantestam Reference Bertholdsson and Kolodinska-Brantestam2009; Bingham et al. Reference Bingham, Karley, White, Thomas and Russell2012). These changes were also evident for studied barley germplasm. Though lodging tolerance greatly improves agronomic performance and yield stability in cereals, its association with yield improvements is not solely due to reduced lodging rate, as the positive breeding effects on yield are also apparent in non-lodging conditions (Bingham et al. Reference Bingham, Karley, White, Thomas and Russell2012). Furthermore, reduced straw length and improved HI contribute to higher yields also due to associated changes in N traits. Nitrogen use efficiency traits correlated positively with yield, SGW, GRNO and HI. In particular, HI showed high correlation coefficients with both NUE and NUTE, as also reported elsewhere for barley (Bulman et al. Reference Bulman, Mather and Smith1993; Abeledo et al. Reference Abeledo, Calderini and Slafer2008; Sylvester-Bradley & Kindred Reference Sylvester-Bradley and Kindred2009; Bingham et al. Reference Bingham, Karley, White, Thomas and Russell2012). The positive association of plant N and yield related traits in this and other studies support the assumption of indirect breeding improvement in NUE traits via positive yield development. The current study also showed that breeding has increased both yield determining components, GRNO and SGW, in agreement with Bingham et al. (Reference Bingham, Karley, White, Thomas and Russell2012), although no breeding effect on SGW was evident in other studies (Bulman et al. Reference Bulman, Mather and Smith1993; Abeledo et al. Reference Abeledo, Calderini and Slafer2003; Bertholdsson & Kolodinska-Brantestam Reference Bertholdsson and Kolodinska-Brantestam2009). Though breeding has improved both SGW and GRNO, grain yield was more affected by GRNO, as also recorded for other small-grain cereals (Slafer Reference Slafer2003; Peltonen-Sainio et al. Reference Peltonen-Sainio, Kangas, Salo and Jauhiainen2007; Rajala et al. Reference Rajala, Peltonen-Sainio, Kauppila, Wilhelmson, Reinikainen and Kleemola2007).
Grouping the material studied into cultivars released before and after 1970 indicated no decline in the effect of breeding on the studied traits (data not shown). Hence, the current study found that no marked levelling off has taken place in recent years, in agreement with Peltonen-Sainio et al. (Reference Peltonen-Sainio, Jauhiainen and Laurila2009). Similar consistent breeding trends were evident for cultivars of different geographical origin likely because increasing yield, shortening straw and improving lodging tolerance have been common breeding targets throughout Europe.
Effect of breeding on genetic diversity
No overall decrease of genetic diversity could be observed in the current study, as modern varieties were genetically as variable as the landraces, although the variation observed was somewhat different. Most of the genetic variation was found within breeding age groups for both row types, while 12 and 10% of variation was explained by the breeding age groups in six- and two-row barley, respectively. Tondelli et al. (Reference Tondelli, Xu, Moragues, Sharma, Schnaithmann, Ingvardsen, Manninen, Comadran, Russell, Waugh, Schulman, Pillen, Rasmussen, Kilian, Cattivelli, Thomas and Flavell2013), classified European two-row barley germplasm by Structure analyses into two groups K1 and K2 with a third mixed group in the middle. These three groups explained 14·1% of the genetic variation in the material and classification to K1 and K2 corresponded respectively to modern and old varieties. Genetic diversification between the breeding age groups was on a comparable level in the Nordic barley material used in the current study. Although the group of modern varieties included several accessions originating outside the Nordic-Baltic region, removing these accessions from diversity analyses did not change diversity measures, potentially indicating that modern breeding utilizes much the same genetic diversity across all Europe.
Differences between landraces and modern varieties in genetic diversity in certain chromosomal regions were observed, but modern varieties were more or less diverse than landraces. These differences could be due to differing breeding constraints with directional selection reducing diversity while introgression of new traits from exotic sources could enhance it due to linkage drag. Tondelli et al. (Reference Tondelli, Xu, Moragues, Sharma, Schnaithmann, Ingvardsen, Manninen, Comadran, Russell, Waugh, Schulman, Pillen, Rasmussen, Kilian, Cattivelli, Thomas and Flavell2013) observed a low diversity region on 2H around the HvCEN locus associated with flowering time and yield and postulated that this may be due to fixation of the late flowering and higher yielding allele in European two-row spring barley. Nordic barley did not show marked reduction of diversity in this region, indicating that maybe the alleles for later flowering have not been fixed in Nordic material as they are in more southern European two-row barley. However similar to Tondelli et al. (Reference Tondelli, Xu, Moragues, Sharma, Schnaithmann, Ingvardsen, Manninen, Comadran, Russell, Waugh, Schulman, Pillen, Rasmussen, Kilian, Cattivelli, Thomas and Flavell2013) landraces were found lacking genetic diversity on 5H (37–46 cM), not only in two- but also in six-row types, while modern varieties expressed considerable diversity. In Nordic two-row barley one region on 7H (around 78 cM) was devoid of diversity similar to findings in other European two-row barleys (Tondelli et al. Reference Tondelli, Xu, Moragues, Sharma, Schnaithmann, Ingvardsen, Manninen, Comadran, Russell, Waugh, Schulman, Pillen, Rasmussen, Kilian, Cattivelli, Thomas and Flavell2013). However, unlike European landraces, Nordic landraces were very diverse in this region. These similarities and differences in the patterns of genetic diversity along the chromosomes may reflect different breeding aims or selection pressures for different geographical regions. Low diversity in chromosomal regions affecting important traits such as NUE or disease resistance may result in low variability in these traits. However, the lower coefficients of variation (CVs) observed in several traits for the modern six-row cultivars were unlikely to be caused by a lack of genetic diversity since modern varieties were more diverse than landraces in the majority of the chromosomal regions.
In six-row barley, many of the landraces were found to be closely related, which may be a consequence of their collection history. Many of the landraces in the NordGen collection were collected during the second half of the 20th century and may represent early varieties instead of true landraces. Some popular varieties may have been collected several times under a local name and thus the six-row landrace collection may contain some redundancy.
Genetic erosion was not observed in the current study for barleys from the Baltic area over a hundred years of barley breeding. The same conclusion was reached when barley germplasm from Nordic and Baltic areas was studied with SSR markers, although at some specific loci a reduction in the number of alleles was observed (Kolodinska-Brantestam et al. Reference Kolodinska-Brantestam, von Bothmer, Dayteg, Rashal, Tuvesson and Weibull2007). Directional selection and limited size of germplasm in breeding programmes may lead to genetic erosion, but exchange of breeding materials between breeders and use of exotic material has probably enabled breeders to maintain the high level of diversity in modern varieties.
Improvements in disease resistance
The improvement of disease resistance has been one of the main objectives in most cereal crop breeding programmes during recent decades (Walters et al. Reference Walters, Avrova, Bingham, Burnett, Fountaine, Havis, Hoad, Hughes, Looseley, Oxley, Renwick, Topp and Newton2012) and has been successful in northern European regions. However, the current study found that older cultivars, released during 1930–80, already had higher disease tolerance than landraces to all four major barley diseases. Breeding resistance to spot type of net blotch and spot blotch has not been a high priority in more recent barley breeding programmes and accordingly, no clear improvement in resistance against these diseases was found for the past two decades. Increasing resistance against net type of net blotch has, however, been a high priority in certain breeding programmes (Jalli Reference Jalli2010) and the cultivars released in the 1990s and especially in the 2000s seem to have higher resistance against net type of net blotch than older cultivars or landraces. It is not known if exotic sources have been used for creating resistance in these modern varieties. If this is the case, then the high level of diversity found in modern varieties could be due to linkage drag in the chromosomal regions containing the selected resistance loci. However, some caution in interpreting the results is required in extrapolating to realized field resistance as the current results were based on seedling tests in the greenhouse with a single, aggressive Finnish isolate of each pathogen.
The majority of barley genotypes in the NordGen collection were found to be highly susceptible to all the major leaf spotting diseases. However, this material contained some individual genotypes that may carry useful, unexploited resistance sources for the future resistance breeding although to confirm this, more field-testing with adult plants and a more comprehensive selection of pathogen strains is needed. The disease pressure in Nordic countries is assumed to increase in the future due to climate change, changes in crop management practices (reduced tillage) and the pressure to reduce fungicide use according to IPM targets set by the EU. All these factors combine to increase the need for the deployment of disease resistance in the breeding of future barley cultivars.
CONCLUSIONS
To minimize the negative environmental impact of N fertilizer use and to further improve yields, further improvements in N use efficiency are needed. Positive breeding effects were found with no signs of a levelling-off for traits related to yield, N use efficiency and disease resistance without any decrease in genetic diversity in barley adapted to northern European growing conditions. In the future, further improvements in barley cultivars achieved through plant breeding, in conjunction with developments in crop management, will be needed to achieve both these important goals.
SUPPLEMENTARY MATERIAL
The supplementary material for this article can be found at http://dx.doi.org/10.1017/S002185961600068X.
This study was funded by the Ministry of Agriculture and Forestry and former MTT Agrifood Research Finland through OHRASOPU and SusIntens projects. The authors are grateful for the assistance of technical and laboratory staff in MTT Agrifood Research. Especially, the invaluable contribution of field technicians Mrs. Jaana Nissi and Mr. Arto Timonen is gratefully acknowledged.