INTRODUCTION
Geographic Information Systems (GIS) play a major role in health care, surveillance of infectious diseases, and mapping and monitoring of the spatial and temporal distributions of vectors of infection (Shaw, Reference Shaw2012). GIS combine sophisticated algorithms, spatial analysis, geo-statistics and modelling, making GIS technology a powerful tool for the prediction of disease patterns and parasite ecology associations (Higgs, Reference Higgs2004; Guo et al. Reference Guo, Penelope, Cao, Jürg, Zhu, Daniel, Zhu, He, Li, Hu, Chen and Marcel2005; García-Rangel and Pettorelli, Reference García-Rangel and Pettorelli2013). Given the variety of tools, concepts and applications of GIS in public health, a brief synthesis of the state of the field is due. In this paper, we review examples of successful applications of GIS in public health, with emphasis on parasitic diseases. Some useful definitions and concepts of GIS discussed in this paper are briefly introduced here, but we refer the readers to Caprarelli and Fletcher (2014 and references therein) for a comprehensive review of GIS architecture, availability, analytical tools, and for a synthesis of relevant principles of spatial analysis and modelling (Caprarelli and Fletcher, Reference Caprarelli and Fletcher2014).
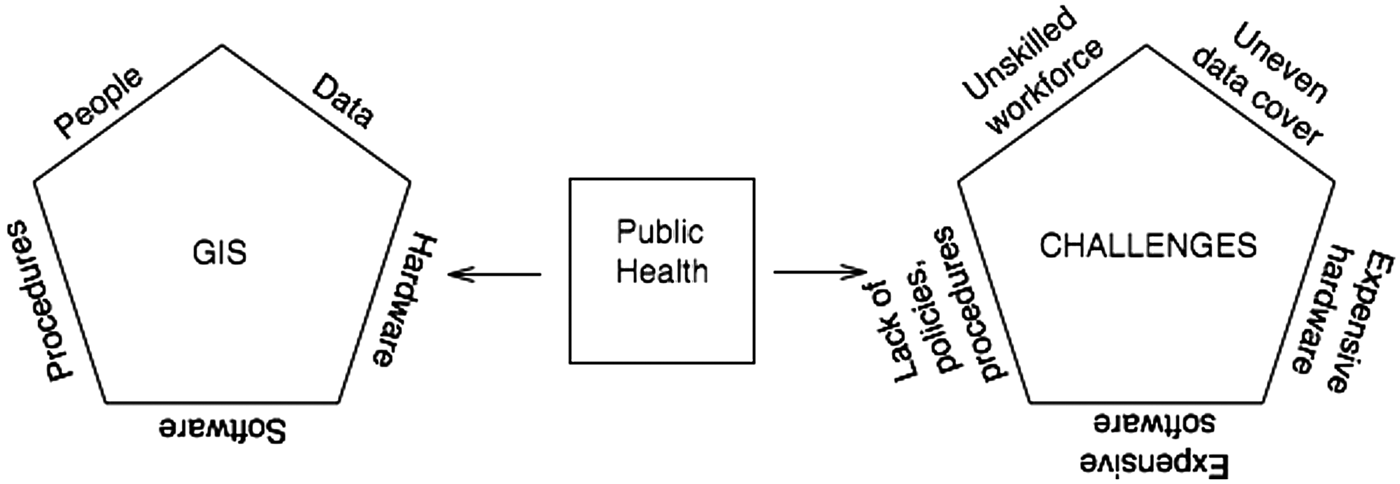
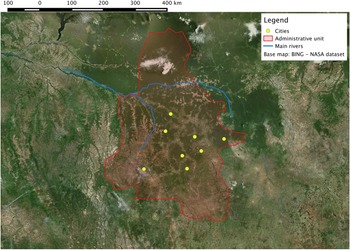
Every GIS is structured around five fundamental components (Fig. 1): (i) spatially referenced data, collected and stored in a relational geodatabase, i.e. an information system from which data can be retrieved by formulation of sequences of logical queries; (ii) the hardware physically storing data and processing tools; (iii) the software assembling the user-interface algorithms by which users access the database, query and analyse the data; (iv) the algorithms and data management procedures; and (v) the people, both producers and consumers of spatial data. Each of these components incorporates varying levels of complexity, depending on the scope and scale for which GIS is used. Regardless of the differences, all systems provide basic mapping and spatial analysis tools, which can be mastered in relatively short time even by users with no programming skills. The most basic operations involve creating maps by overlaying data stored as tables comprising details of geographic features symbolized by points, lines or polygons, or raster datasets (e.g., photographs), and their geographic coordinates (an example is shown in Fig. 2). Once the features are mapped, geo-statistical analysis, such as cluster analysis and network analysis, important for disease monitoring and investigation (Bergquist and Rinaldi, Reference Bergquist and Rinaldi2010), can be carried out using the analysis tools included in the GIS software package. This basic approach may be followed by more complex modelling to understand the mechanisms of disease spreading, by linking disease processes and explanatory spatial variables (Graham et al. Reference Graham, Atkinson and Danson2004). GIS has increased the accessibility and reliability of integration between health data and mapping processes (Brooker et al. Reference Brooker, Kabatereine, Smith, Mupfasoni, Mwanje, Ndayishimiye, Lwambo, Mbotha, Karanja and Mwandawiro2009b ), allowing researchers to study the relationships between spatial and temporal trends and risk (Clements et al. Reference Clements, Lwambo, Blair, Nyandindi, Kaatano, Kinung'hi, Webster, Fenwick and Brooker2006a ; Brooker and Clements, Reference Brooker and Clements2009; Brooker et al. Reference Brooker, Kabatereine, Smith, Mupfasoni, Mwanje, Ndayishimiye, Lwambo, Mbotha, Karanja and Mwandawiro2009b ), and between environmental factors and health, to all scales (McGeehin et al. Reference Mcgeehin, Qualters and Niskar2004; Beale et al. Reference Beale, Hodgson, Abellan, Lefevre and Jarup2010). Examples include the epidemiological application of data obtained from climate-based forecast systems that include observation of oceans, land, elevations, land cover, land use, surface temperatures and rainfall, for disease surveillance and early-warning systems (Bergquist and Rinaldi, Reference Bergquist and Rinaldi2010).
The five components of GIS represented as the edges of a pentagon (left polygon in the figure): data, hardware, software, procedures, people. Public health data are perfectly suited to be treated and analysed as information layers in a GIS, provided location specific information (e.g., geographic coordinates, addresses, street names, etc.) is also included in the database. Additional information layers, for example census or environmental data, can be added in the database and can be queried together with the health data in order to map, analyse, interpret and model the incidence and spread of diseases. Where one or more of the GIS components are lacking or inadequately resourced, however, the geodatabase loses its analytical and predictive power. Challenges (graphically represented by the right-hand pentagon in the figure) ensue when data are collected unevenly or unrepresentatively, when the layers of information are handled by an unskilled workforce, in the absence of proper data handling and storage procedures, and if adequate hardware and software cannot be obtained. In dealing with zoonotic diseases, affecting mostly developing countries, these challenges represent obstacles in building efficient and effective GIS architectures.

Draft map showing information layers in GIS. Example of draft of map prepared with information layers in GIS. The location is the administrative province of Kasai Occidental, in the Democratic Republic of Congo. The map is prepared by overlaying geo-referenced vector layers stacked on top of each other (as in the map legend) on a basemap obtained from NASA satellite imagery through the free Bing Maps web mapping service (http://www.bing.com/maps/). The vector layers were digitized by editing GIS shapefiles at a scale 1:3 322 505, using a WGS 84/Pseudo Mercator projection, and taking the basemap as a reference map. Yellow circles (Cities): point shapefile; shaded red area (Administrative unit): polygon shapefile; blue lines (Main rivers): polyline shapefile. The shapefiles and the map were prepared using the open-source software QGIS v. 2·8·1 – Wien. No topological rules, validation procedure or error corrections were applied, so the shapes and geographic coordinates of all vector layers in this figure must be considered only approximations and the resulting map in the figure should not be used as a detailed geographical reference.

While GIS is broadly used in many countries as part of routine public health management and services, its diffusion is not uniform across developing countries, where some of the most lethal and crippling parasitic diseases are endemic. We will discuss some of the challenges faced by many countries in adopting GIS for routine monitoring and spatial analysis of infectious diseases and of the environmental factors contributing to their spreading. We also suggest possible simple and low-cost initiatives that might assist embracing this technology more widely where it is most needed.
RESEARCH METHODOLOGY
Personal experience, particularly of one of the authors (SF-L), has been the principal source of inspiration for this paper. Working in the field in several developing regions in Central America and the Western Pacific, has brought about the realization that the management of some of the most debilitating infectious diseases require effective approaches, informed by geospatial analyses at the local level. While regulations and ethical considerations do not allow dissemination of specific information collected in the field, the authors believe that addressing some of the more general aspects can provide insight to public health practitioners globally. The author's observations and experiences derived from field notes [a concept frequently used in qualitative studies (Baxter and Jack, Reference Baxter and Jack2008)], have informed the challenges and solutions section. These observations indicate that, in spite of the obvious willingness of local public health workers and some local communities to educate and train themselves to combat and prevent the spread of diseases, the uneven distribution of infrastructural resources and expertise, otherwise taken for granted in the developed world, stands in the way of a systematic approach that would produce real long-term benefits.
Peer-reviewed reports describing how GIS has been successfully applied to the monitoring and prediction of parasitic diseases, focusing mainly on examples from developing countries, were also reviewed. This provided a clear indication that the information collected and managed within a GIS is linked to real and measurable public health benefits for communities in those regions. We then considered individually each of the five principal elements composing a GIS (Fig 1), to identify possible barriers to their effective deployment in developing countries, and referred to examples in the peer-reviewed literature that could highlight specific challenges. Following this step we then looked at possible solutions that could alleviate the challenges. Where no examples of solutions were found in the literature, we proposed some recommended actions, informed by personal experiences. Our literature search repositories were PubMed and Google Scholar. Based on the study aim, we adopted a discursive writing approach and a narrative literature review approach rather than presenting a systematic review of the literature.
EXAMPLES OF SUCCESSES
Understanding the socio-cultural determinants of health
Investments into disease prevention and control activities should take into consideration the broad socioeconomic, cultural, and educational determinants, which are often modifiable predictors of health outcomes (Njau et al. Reference Njau, Stephenson, Menon, Kachur and Mcfarland2014). Epidemiological studies have generally described the association between various health determinants and the risk for transmission and spread of infectious diseases. Whilst it is generally accepted that some people are more at risk of infection than others, some of the underlying determinants of disease spread are not clearly understood, and even within the same population group, heterogeneity in disease distribution exists, and has been identified through spatial analysis (Clements et al. Reference Clements, Reid, Kelly and Hay2013; Kasasa et al. Reference Kasasa, Asoala, Gosoniu, Anto, Adjuik, Tindana, Smith, Owusu-Agyei and Vounatsou2013). The application of GIS in disease studies has furthered the understanding of the intersection between person, place and time in infectious disease outbreaks and underlying social and cultural factors. These factors are often unevenly distributed but the extent and intensity of a particular disease may be influenced by their spatial distribution (Moore and Carpenter, Reference Moore and Carpenter1999). Epidemiological mapping has helped to advance understanding of the social and cultural perspectives of the spread of certain infectious diseases. Social and cultural variables (such as access to water, sanitation, health care, population density, over-crowding, farming and nutritional practices, to name a few) can be mapped in a similar way to relevant environmental covariates such as temperature and rainfall. Predictive modelling utilizes current estimates of disease burden to predict future burden based on expected changes in population demographics and relevant social determinants (Lau et al. Reference Lau, Won, Becker, Magalhaes, Fuimaono, Melrose, Lammie and Graves2014). By understanding the distribution of social determinants of health, hotspots can be identified and targeted interventions developed to address them (Schneider et al. Reference Schneider, Aguilera, Barbosa Da Silva Junior, Ault, Najera and Brooker2011).
Poverty remains a significant social determinant in the propagation of neglected tropical diseases, and forms part of a vicious cycle of reduced economic productivity due to long-term disability and morbidity, maternal and child health issues and other health-related challenges. These limit productivity, resulting in individuals and their communities being caught in a health-related ‘poverty trap’ (Brooker et al. Reference Brooker, Hotez and Bundy2010; Conteh et al. Reference Conteh, Engels and Molyneux2010; Hotez and Pecoul, Reference Hotez and Pecoul2010). The development of poverty maps for many countries by the United Nations Development Programme (UNDP), the World Bank and similar agencies, has provided the means by which health services can identify priority populations.
Variability in human activities that may impact inadvertently upon the life cycle of parasites and their vectors and the degree to which humans are exposed have improved understanding of emerging and re-emerging diseases. This is possible when local human activities (e.g., migration, outdoor leisure activities and forest use) impact the nature and level of contact between people, parasites and/or their vectors (Semenza et al. Reference Semenza, Suk, Tsolova, Gillespie, Mook, Little, Grant, Mclauchlin, Kafatos and Randolph2010). The value of geospatial databases has been demonstrated through the incorporation of multiple sources of information on human health and demographics to determine hotspots for disease transmission, and the use of predictive risk charts and maps to inform public health interventions (Lau et al. Reference Lau, Won, Becker, Magalhaes, Fuimaono, Melrose, Lammie and Graves2014).
Mapping socio-economic and cultural determinants has been successfully used to predict the occurrence of parasite co-infections and multi-parasitism (Raso et al. Reference Raso, Vounatsou, Singer, Eliézer, Tanner and Utzinger2006). There is evidence that the distribution of trachoma shows heterogeneity between districts and regions and while its occurrence has been linked to environmental sanitation and behavioural factors, patterns at large scales reflect disparities in socioeconomic status and indicators such as water, sanitation and hygiene (WASH) (Clements et al. Reference Clements, Kur, Gatpan, Ngondi, Emerson, Lado, Sabasio and Kolaczinski2010; Smith et al. Reference Smith, Solomon, Basanez, Bockarie, Bundy, Clements, Emerson, Flueckiger, Foster, Haddad, Kelly-Hope, Mabey and Soar2013). The spatial variation in the incidence of WASH is associated with the geographical variation in soil-transmitted helminths (Smith et al. Reference Smith, Solomon, Basanez, Bockarie, Bundy, Clements, Emerson, Flueckiger, Foster, Haddad, Kelly-Hope, Mabey and Soar2013). By understanding the spatial aspects of WASH indicators, Magalhães et al. (Reference Magalhães, Barnett and Clements2011) were able to determine the contribution of water and sanitation to the overall burden of helminthic infections in school-aged children. Geo-referenced household-level data for three WASH indicators obtained from demographic health surveys (DHS) conducted in participating countries (Burkina Faso, 2003; Ghana, 2003; Mali, 2006) were used to generate predictive maps of areas without piped water, toilet facilities and improved household floor types. This facilitated the identification of areas in West Africa that were lagging behind the Millennium Development Goals for water and sanitation (Magalhães et al. Reference Magalhães, Barnett and Clements2011). The authors were then able to quantify the role of WASH in the risk of Schistosoma hematobium, Schistosoma mansoni and hookworm infection in school-aged children. Lack of access to clean water and sanitation is a possible determinant of polyparasitism (Brooker and Clements, Reference Brooker and Clements2009). The ability to identify this association between WASH and the occurrence of parasitic diseases facilitates identification of communities in West Africa where interventions to prevent disease spread and improvement of WASH can produce greater health benefits (Magalhães et al. Reference Magalhães, Barnett and Clements2011). Similarly for Western Côte d'Ivoire, demographic, environmental, and socioeconomic data were incorporated into GIS in order to conduct risk profiling and spatial prediction of co-infection with Schistosoma mansoni and hookworm. The evidence suggests that the socioeconomic status was useful in predicting co-infections between S. mansoni and hookworm at small geographical scales (Raso et al. Reference Raso, Vounatsou, Singer, Eliézer, Tanner and Utzinger2006). Maternal education mapped at small scale was found to be a significant variable associated with the availability of water supply and sanitation facilities in households in West Africa. Higher levels of maternal education were correlated with childhood protection from helminth infection (Magalhães et al. Reference Magalhães, Barnett and Clements2011).
Household and community practices have been mapped to understand disease risk in the Pacific Island Countries. In Papua New Guinea, spatial stratification of district-specific risks associated with high-risk areas of malnutrition was used to describe the spatial features associated with the prevalence of stunting and wasting outcomes at the province and district-levels (Wand et al. Reference Wand, Lote, Semos and Siba2012). By conducting a spatial analysis study, high geographical variability of stunting and wasting over the targeted region was identified. This was useful to highlight district-level differences in health outcomes, which are often masked because of data aggregation, resulting in misleading conclusions (Wand et al. Reference Wand, Lote, Semos and Siba2012). The advancement in understanding of the distribution of social determinants of health will continue to inform ongoing targeted surveillance and the development of interventions to prevent and control infectious diseases (Schneider et al. Reference Schneider, Aguilera, Barbosa Da Silva Junior, Ault, Najera and Brooker2011).
Disease surveillance and early warning systems
Public health surveillance is defined as ‘the continuous, systematic collection, analysis and interpretation of health-related data needed for the planning, implementation, and evaluation of public health practice’ (World Health Organization, 2015). Effective surveillance systems provide early warning systems for public health emergencies, assess the impact of interventions or evaluate progress towards specified goals, and monitor trends in the development and proliferation of health threats, informing the prioritization of issues, allocation of resources, public health policy and strategies. Mapping with GIS tools is increasingly being used globally as part of disease surveillance and monitoring programmes. Maps provide a symbolic representation of underlying geographical distribution of disease incidence, improving the understanding of disease rates over time, and enabling the detection of outbreaks or possible epidemics (Bailey, Reference Bailey2001; Norstrom, Reference Norstrom2001; Boulos, Reference Boulos2004; Blanton et al. Reference Blanton, Manangan, Manangan, Hanlon, Slate and Rupprecht2006; Duncombe et al. Reference Duncombe, Clements, Hu, Weinstein, Ritchie and Espino2012; Kelly et al. Reference Kelly, Hale, Donald, Batarii, Bugoro, Nausien, Smale, Palmer, Bobogare, Taleo, Vallely, Tanner, Vestergaard and Clements2013). Spatial observations of environmental factors such as rainfall, land use, surface temperatures, oceans and land cover have a direct epidemiological impact on the transmission of diseases. Consequently, the ability to apply GIS techniques to disease surveillance has opened up a world of possibilities in creating early-warning systems for emerging and re-emerging diseases (Bergquist and Rinaldi, Reference Bergquist and Rinaldi2010).
Geospatial tools improve understanding of the spatiotemporal distribution of parasitic diseases and thus enhance our ability to design appropriate cost-effective integrated disease control programmes (Brooker and Utzinger, Reference Brooker and Utzinger2007; Fletcher et al. Reference Fletcher, Caprarelli, Merif, Andresen, Van Hal, Stark and Ellis2014). For example, geospatial tools assisted Jamaica to rapidly control and eliminate malaria after its reintroduction to the country in 2006. Mapping revealed the foci of infection and enabled targeted intervention and rapid containment of the outbreak. Public health officials were able to divide the affected area into 23 geographic grids, eight of which corresponded to the affected communities. This enabled surveillance teams to systematically examine communities for anopheles breeding sites that were subjected to larvicidal treatment or implementation of environmental controls, and concentration of adulticidal treatment in the affected grids (Webster-Kerr et al. Reference Webster-Kerr, Figueroa, Weir, Lewis-Bell, Baker, Horner-Bryce, Lewis-Fuller, Bullock Ducasse, Carter and Campbell-Forrester2011).
The incorporation of GIS technology into routine disease surveillance has been achieved in some resource limited settings based on increased recognition of the value of GIS technology in the understanding and control of infectious diseases, which has led to increased political, financial and technical support for such programmes (Malone et al. Reference Malone, Bergquist, Huh, Bavia, Bernardi, El Bahy, Fuentes, Kristensen, Mccarroll, Yilma and Zhou2001; Zhou et al. Reference Zhou, Lv, Yang, Kristensen, Bergquist, Utzinger and Malone2009; Brooker et al. Reference Brooker, Kabatereine, Smith, Mupfasoni, Mwanje, Ndayishimiye, Lwambo, Mbotha, Karanja and Mwandawiro2009b ). The incorporation of a GIS-based spatial decision support system (SDSS) into the surveillance-response system in the South Pacific is a major achievement for Vanuatu and Solomon Islands. The SDSS is designed to automatically locate and map confirmed malaria cases, to classify active foci of infection, and to guide targeted interventions. With technical assistance provided by the Pacific Malaria Initiative Support Centre (PacMISC) and WHO, local authorities were able to build custom applications into the existing provincial SDSS used in previously identified elimination provinces, to support general topographic mapping, geographic reconnaissance and vector control intervention management. This enabled teams to automatically classify and map transmission foci based on the spatiotemporal distribution of cases, and to identify priority areas of interest for the implementation of foci-specific targeted response (Kelly et al. Reference Kelly, Hale, Donald, Batarii, Bugoro, Nausien, Smale, Palmer, Bobogare, Taleo, Vallely, Tanner, Vestergaard and Clements2013). Several developing countries now have to access GIS technology as a result of their participation in the Global Fund for Tuberculosis, Malaria and AIDS programmes (Chang et al. Reference Chang, Parrales, Jimenez, Sobieszczyk, Hammer, Copenhaver and Kulkarni2009). The Global Fund for Tuberculosis, Malaria and AIDS programmes is a partnership between governments, civil society, the private sector and people affected by these diseases to accelerate the end of AIDS, TB and malaria as epidemics (http://www.theglobalfund.org/en/).
Other examples demonstrate that the incorporation of GIS technology into disease surveillance systems has facilitated the control of infectious diseases such as: cutaneous leishmaniasis (Ali-Akbarpour et al. Reference Ali-Akbarpour, Mohammadbeigi, Tabatabaee and Hatam2012), human African trypanosomiasis (Cecchi et al. Reference Cecchi, Paone, Franco, Fevre, Diarra, Ruiz, Mattioli and Simarro2009; Simarro et al. Reference Simarro, Cecchi, Paone, Franco, Diarra, Ruiz, Fèvre, Courtin, Mattioli and Jannin2010), schistosomiasis (Bergquist, Reference Bergquist2002; Raso et al. Reference Raso, Matthys, N'goran, Tanner, Vounatsou and Utzinger2005; Clements et al. Reference Clements, Lwambo, Blair, Nyandindi, Kaatano, Kinung'hi, Webster, Fenwick and Brooker2006a ; Brooker, Reference Brooker2007; Ekpo et al. Reference Ekpo, Mafiana, Adeofun, Solarin and Idowu2008), loiasis (Diggle et al. Reference Diggle, Thomson, Christensen, Rowlingson, Obsomer, Gardon, Wanji, Takougang, Enyong, Kamgno, Remme, Boussinesq and Molyneux2007), various animal diseases (Norstrom, Reference Norstrom2001; Clements et al. Reference Clements, Pfeiffe, Martin and Otte2007), tick-borne diseases (Randolph and Rogers, Reference Randolph and Rogers2006; Estrada-Peña, Reference Estrada-Peña2007), rabies (Blanton et al. Reference Blanton, Manangan, Manangan, Hanlon, Slate and Rupprecht2006) and malaria (Keating et al. Reference Keating, Macintyre, Mbogo, Githeko, Regens, Swalm, Ndenga, Steinberg, Kibe, Githure and Beier2003; Snow et al. Reference Snow, Guerra, Noor, Myint and Hay2005; Gosoniu et al. Reference Gosoniu, Vounatsou, Sogoba and Smith2006; Mabaso et al. Reference Mabaso, Vounatsou, Midzi, Da Silva and Smith2006; Hay et al. Reference Hay, Guerra, Gething, Patil, Tatem, Noor, Kabaria, Manh, Elyazar, Brooker, Smith, Moyeed and Snow2009; Grillet et al. Reference Grillet, Barrera, Martínez, Berti and Fortin2010; Mboera et al. Reference Mboera, Senkoro, Rumisha, Mayala, Shayo and Mlozi2011; Noor et al. Reference Noor, Elmardi, Abdelgader, Patil, Amine, Bakhiet, Mukhtar and Snow2012).
A vector-borne disease surveillance system was established in American Samoa to monitor the elimination progress of lymphatic filariasis after mass drug administration (MDA) from 2000 to 2006. Spatial epidemiology was incorporated into the system and applied to geo-referenced serum bank data to look for hot spots of transmission of lymphatic filariasis based on spatial dependence, and household level clustering based on the assessment of the seroprevalence of lymphatic filariasis antigens and antibodies (2010) in American Samoan adults. Geographic analysis identified the possible location and estimated size of residual foci of potentially infectious adults. The study demonstrated the value of spatial analysis in post-MDA surveillance and confirmed the risk of re-introduction of the disease by new migrants, while identifying strategies to determine whether ongoing targeted surveillance of high risk groups was warranted (Lau et al. Reference Lau, Won, Becker, Magalhaes, Fuimaono, Melrose, Lammie and Graves2014).
The rapid epidemiological mapping of onchocerciasis (REMO) in over 20 African countries (Brooker et al. Reference Brooker, Hotez and Bundy2010) led by the African Programme for Onchocerciasis Control (APOC), quickly and cheaply identified priority areas and the number of individuals requiring treatment by community-directed treatment with ivermectin (CDTI) (Noma et al. Reference Noma, Nwoke, Nutall, Tambala, Enyong, Namsenmo, Remme, Amazigo, Kale and Seketely2002; Brooker et al. Reference Brooker, Hotez and Bundy2010). This was achieved due to the ability to conduct rapid assessments that enabled the stratification of countries into areas that are suitable and unsuitable for transmission (Brooker et al. Reference Brooker, Hotez and Bundy2010).
Increased availability and access to geospatial tools facilitates the acquisition of advantageous geographical and environmental perspectives on the diseases (Beale et al. Reference Beale, Hodgson, Abellan, Lefevre and Jarup2010). Increased availability of free or inexpensive tools (such as WHO's HealthMapper or CDC's EpiMap) for mapping disease distribution and community treatment information has enabled public health workers to be more effective and reach wider population. Recognizing the burden from neglected parasitic diseases upon affected countries, the World Health Assembly resolved that the elimination of lymphatic filariasis and onchocerciasis was a public health priority for the WHO and its member-states (World Health Assembly, 1997). Remarkable progress has been made towards the elimination of targets due to the ability to map the distribution of disease, and conduct spatial analysis to evaluate transmission levels in populations under MDA (Molyneux, Reference Molyneux2003). Geographical analysis was conducted to determine the level of risk of infection amongst populations residing in ‘Implementation Units’ (or health districts) in programme countries (Hooper et al. Reference Hooper, Chu, Mikhailov, Ottesen and Bradley2014). Mapping of the geographical distribution of infected persons and spatial modelling to determine the magnitude of the population needing intervention were critical to the progress of elimination efforts (Ottesen, Reference Ottesen2000; Hooper et al. Reference Hooper, Chu, Mikhailov, Ottesen and Bradley2014).
Luan and Law (Reference Luan and Law2014) provided an in-depth review of web GIS-based Public Health Surveillance Systems (WGPHSSs). One noteworthy example of how GIS has been applied to other infectious diseases is the World Health Organization (WHO)'s DengueNet, a centralized data management system that includes a database and GIS for the global epidemiological and virological surveillance of dengue fever (DF) and dengue haemorrhagic fever (DHF). This web-based system makes available to users a standard platform where current surveillance data on the incidence and trends of dengue and DHF are shared. Data are standardized and reported at the country level resulting in greater comparability of the reported cases of dengue fever across different geographical areas. This translates into useful early warning information for public health professionals who can then be better prepared for the management of individual cases and epidemics, thus reducing fatality rates. The data can also be used to relate health and economic conditions to the cost effectiveness of prevention and control interventions (World Health Organization, 2014), thus building useful blueprints for prediction and prevention of future outbreaks. Growth in the user-base of GIS technology applied to dengue fever has improved our understanding of the geographical prevalence of the disease, of its distribution over time, hence its spreading potential, and has enabled the evaluation of the spatial relationships between incidence and disease risk factors to inform effective control programmes (Duncombe et al. Reference Duncombe, Clements, Hu, Weinstein, Ritchie and Espino2012; Hsu et al. Reference Hsu, Fuad, Lazuardi and Sanjaya2012; Luan and Law, Reference Luan and Law2014). There are several other examples where the successful application of inexpensive geodatabase tools have resulted in long-term benefits for communities: the utilization of epidemiological data, rapid assessment surveys and climate-based risk prediction models to map the distribution of urinary and intestinal schistosomiasis across Africa (Brooker et al. Reference Brooker, Kabatereine, Gyapong, Stothard and Utzinger2009a ); the development of empirical databases and predictive maps which describe the global distribution of helminths (Brooker et al. Reference Brooker, Rowlands, Haller, Savioli and Bundy2000; Brooker, Reference Brooker2010; Brooker et al. Reference Brooker, Hotez and Bundy2010) and malaria (Snow et al. Reference Snow, Guerra, Noor, Myint and Hay2005; Hay and Snow, Reference Hay and Snow2006); the use and analysis of raster datasets obtained from orbit using remote sensing techniques, in order to map the distribution of schistosomiasis and a variety of other parasites, and to study the association between infection and environmental variables (Cross and Bailey, Reference Cross and Bailey1984; Cross et al. Reference Cross, Perrine, Sheffield and Pazzaglia1984; Malone et al. Reference Malone, Bergquist, Huh, Bavia, Bernardi, El Bahy, Fuentes, Kristensen, Mccarroll, Yilma and Zhou2001; Brooker et al. Reference Brooker, Hay and Bundy2002; Clements et al. Reference Clements, Lwambo, Blair, Nyandindi, Kaatano, Kinung'hi, Webster, Fenwick and Brooker2006a , Reference Clements, Moyeed and Brooker b ).
International collaboration on zoonotic parasite diseases
There is growing political and financial commitment in both developed and developing countries to establish measures aimed at providing efficient and cost-effective control of neglected tropical diseases. These include infections mostly endemic to low-income populations in Africa and the Middle East, South America and Asia, (Zhou et al. Reference Zhou, Lv, Yang, Kristensen, Bergquist, Utzinger and Malone2009; Simarro et al. Reference Simarro, Cecchi, Paone, Franco, Diarra, Ruiz, Fèvre, Courtin, Mattioli and Jannin2010; Scholte et al. Reference Scholte, Freitas, Dutra, Guimaraes, Drummond, Oliveira and Carvalho2012). In recognition of the need to improve understanding of the social, economic and environmental burden caused by these diseases, global experts have come together to support the establishment of spatial databases aimed at profiling multiple species of parasitic diseases (Malone et al. Reference Malone, Bergquist, Huh, Bavia, Bernardi, El Bahy, Fuentes, Kristensen, Mccarroll, Yilma and Zhou2001; Zhou et al. Reference Zhou, Lv, Yang, Kristensen, Bergquist, Utzinger and Malone2009). One example of a spatial database of parasitic diseases is the Global Network for Geospatial Health (GNGH), established in 2000, initially set up to develop computer-based models to improve control programmes for schistosomiasis and other snail-borne diseases of medical and veterinary importance (Malone et al. Reference Malone, Bergquist, Huh, Bavia, Bernardi, El Bahy, Fuentes, Kristensen, Mccarroll, Yilma and Zhou2001; Zhou et al. Reference Zhou, Lv, Yang, Kristensen, Bergquist, Utzinger and Malone2009). The scope of the GNGH has since expanded to include other widespread infectious diseases, such as soil-transmitted and waterborne helminth infections, as well as arthropod-borne diseases such as leishmaniasis, malaria and lymphatic filariasis (Zhou et al. Reference Zhou, Lv, Yang, Kristensen, Bergquist, Utzinger and Malone2009).
In the Latin American and Caribbean Region, The Pan American Health Organization developed a Regional Strategic Framework to address neglected diseases (NDs) in neglected populations. The aim of the plan is to strengthen surveillance, prevention, and control systems for neglected diseases, and by extension strengthen other disease surveillance and control programmes. The plan outlines that epidemiological surveillance and mapping are integrated into the achievement of three strategic priorities: (1) diseases that can be eliminated by mass preventive or targeted chemotherapy alone; (2) diseases that can be controlled by mass preventive or targeted chemotherapy coupled with intensified, improved, early case detection and management; and (3) diseases which require improved transmission control through better health promotion, behaviour change, emergency preparedness, and environmental sanitation and management strategies (Ault, Reference Ault2007). The expected outcome of the strategic framework is to improve public health by developing multi-disease based surveillance systems and incorporating GIS into the planning, monitoring, risk and impact assessment processes to inform decision-making for NDs in the participating countries and communities (Ault, Reference Ault2007).
WHO and the Partners for Parasite Control are coordinating a global programme to control helminths and schistosomiasis. The partnership, formed in 2001, includes governments of WHO Member States where helminthic infections are endemic, governments of Member States committed to reduce poverty in low-income countries, various United Nations (UN) agencies, universities, philanthropic foundations and pharmaceutical companies (Ault, Reference Ault2007). The aim of the partnership is to deliver permanent relief from helminthic diseases for millions of affected people by utilizing risk mapping, regular chemotherapy, and education in the control of at least 75% of all school-age children at risk of morbidity from schistosomiasis and soil-transmitted helminthiasis (World Health Organization, 2005; Ault, Reference Ault2007).
The First International Symposium on Geospatial Health was organized by the GNGH in Lijiang, Yunnan province, People's Republic of China in September 2007. The aim of the symposium was ‘to review advances made in the control of zoonotic parasitic diseases through the use of geospatial tools’. The symposium brought together local and international scientists to encourage sharing of data and geospatial health applications in formats that can be used across health disciplines in different contexts (Zhou et al. Reference Zhou, Lv, Yang, Kristensen, Bergquist, Utzinger and Malone2009).
Since then, other collaborative approaches have emerged targeting parasitic disease control. The Roll Back Malaria (RBM) Partnership has developed the Global Malaria Action Plan (GMAP) (http://www.rollbackmalaria.org/microsites/gmap/default.html). The GMAP is based on input from experts from 30 malaria endemic countries and regions, 65 international institutions and 250 experts globally, consolidated into a vision for a substantial and sustained reduction in the burden of malaria and the eventual global eradication of malaria. The GMAP provides a global framework for action to assist partners to coordinate their efforts through an evidence-based approach for the delivery of effective prevention and treatment to all people at risk, and estimates the annual funding needed to achieve its goals (Roll Back Malaria Partnership, 2008).
Several other international projects involve the use of datasets on a global scale. The Malaria Atlas Project (MAP; http://www.map.ox.ac.uk/) managed by the University of Oxford, in the United Kingdom (UK), brings together researchers interested in developing techniques to map and understand the distribution and spread of malaria. The project seeks to support effective planning of malaria control (Hay and Snow, Reference Hay and Snow2006). The online portal provides access to maps and data processing tools that are updated regularly to ensure the information provided stays current. Users with advanced mathematical and geospatial skills may also download programs and instructions for data modelling and apply the spatial analysis concepts to new datasets. Publications by scientists contributing to the project are also accessible from the website.
The London School of Hygiene and Tropical Medicine in the UK manages the Global Atlas of Helminth Infections (GAHI; http://www.thiswormyworld.org/). The GAHI uses data from thousands of field surveys to provide reliable and updated maps of helminth infection distribution to facilitate and prioritize targeted treatment. A variety of maps including survey data maps, predictive risk maps and control and planning maps can be accessed through the GAHI and new datasets can be forwarded to the project team members directly by email. The project team provides capacity building in mapping and the use of epidemiological tools. GAHI also provides access to updated publications (Brooker et al. Reference Brooker, Hotez and Bundy2010).
An example of how regional organizations have attempted to build local mapping and analytic capacity through technical cooperation is with SIGEpi: ‘Application and development of GIS in Epidemiology and Public Health.’ The purpose of this project is to strengthen the analytical capacities of the Ministries of Health and other institutions of the Pan American Health Organization (PAHO) WHO member countries in the ‘Region of the Americas’ and other regions. The SIGEpi's license is available to local ministries and institutions upon request through the PAHO/WHO Representative Offices in the respective countries, and to other professionals, academics, researchers and the private sector directly from the Management of the Area of Analysis of Health and Information Systems (AIS) of PAHO (Martínez Piedra et al. Reference Martinez, Vidaurre, Najera, Loyola, Castillo-Salgado and Eisner2001).
There are opportunities to learn from the many examples of successful studies combining GIS, satellite data and spatial epidemiology concepts, to enable application to other infectious vector-borne diseases (Yang et al. Reference Yang, Vounatsou, Zhou, Tanner and Utzinger2005; Brooker, Reference Brooker2007; Ekpo et al. Reference Ekpo, Mafiana, Adeofun, Solarin and Idowu2008; Simoonga et al. Reference Simoonga, Utzinger, Brooker, Vounatsou, Appleton, Stensgaard, Olsen and Kristensen2009; Bergquist and Rinaldi, Reference Bergquist and Rinaldi2010; Brooker et al. Reference Brooker, Hotez and Bundy2010; Zeng et al. Reference Zeng, Yang, Meng, Wang, Tang, Tang, Zeng, Jeschke and Wang2011). The query and analysis tools developed in a GIS framework would assist with decisions regarding the most effective deployment of defence measures against all vector-borne diseases. There is much scope for wider application of GIS in Latin America, the Caribbean and the Asia Pacific region, where internet access is constantly improving. These regions share similarities in geographical and ecological risk factors for infectious diseases and as such there is scope to translate some of the experience acquired in Africa to these regions.
CHALLENGES AND SOLUTIONS
The scale at which mapping and geostatistical analyses are carried out is extremely important if GIS is to be adopted as an effective tool in the hand of communities and public health officials to control the spread of parasitic diseases. Data collected from the Global Infectious Diseases and Epidemiology Network (GIDEON), complemented by those mined from indexed PubMed publications, were analysed by Hay et al. (Reference Hay, Battle, Pigott, Smith, Moyes, Bhatt, Brownstein, Collier, Myers and George2013) to obtain a global perspective regarding the extent by which infectious diseases are mapped. These authors found that only 7, out of 174 clinically significant mappable infectious diseases, had actually been documented for their spatial distribution. Their list however missed some of the most diffused, chronic and debilitating tropical parasitic diseases, such as trachoma and soil-transmitted helminths, because distribution of these parasitic diseases and of the relevant agents and vectors of infection did not meet the first inclusion criterion of being spatially variable at the global scale at which the statistical analysis was conducted, and was thus considered a low priority for mapping (Hay et al. Reference Hay, Battle, Pigott, Smith, Moyes, Bhatt, Brownstein, Collier, Myers and George2013). Some important infectious diseases show no spatial variability at global planetary scale, but prove to be space dependent when their prevalence is analysed at finer statistical scale and interpreted against environmental and ecological data.
In commending the massive statistical work undertaken by these authors, Smith et al. (Reference Smith, Solomon, Basanez, Bockarie, Bundy, Clements, Emerson, Flueckiger, Foster, Haddad, Kelly-Hope, Mabey and Soar2013) pointed out however that, while Hay et al.'s (2013) analysis provided a valuable framework for global-scale interpretations, mining data only from the GIDEON database and from topical publications indexed in PubMed, did not capture important local data collection and open-source mapping initiatives feeding into the regional scale modelling on which surveillance, prevention and effective intervention initiatives must ultimately be based (Smith et al. Reference Smith, Solomon, Basanez, Bockarie, Bundy, Clements, Emerson, Flueckiger, Foster, Haddad, Kelly-Hope, Mabey and Soar2013). Additionally, local and regional mapping efforts (where available), supported by open-access projects (such as those listed in the previous sections of this review) demonstrate granularity at the local and regional scale (Clements et al. Reference Clements, Kur, Gatpan, Ngondi, Emerson, Lado, Sabasio and Kolaczinski2010; Magalhães et al. Reference Magalhães, Barnett and Clements2011). Furthermore, local environmental conditions, and the ecological dimension of parasitic spread, must be considered an integral part of the spatial analysis of infectious disease transmission, requiring complex high-resolution modelling of several types of data layers (e.g., Caprarelli and Fletcher, Reference Caprarelli and Fletcher2014) over a range of scales. Reliable spatial information gathered locally by public health officers, health carers, environmental assessors and the general community must therefore be included in all spatial analyses and models of infectious diseases. However, this information is often lacking.
Some deadly diseases, such as dengue fever, to date have received very little attention (Eisen and Lozano-Fuentes, Reference Eisen and Lozano-Fuentes2009). This may be in part because of the uneven distribution of resources in affected countries and the lack of uniformity in data collection processes (Brooker et al. Reference Brooker, Kabatereine, Gyapong, Stothard and Utzinger2009a ; Brooker et al. Reference Brooker, Hotez and Bundy2010). For example, while population-level datasets on the incidence of human infection are generally available for Burundi, Rwanda and Uganda, data from Kenya and Tanzania are sparse and statistically non-representative (Brooker et al. Reference Brooker, Kabatereine, Smith, Mupfasoni, Mwanje, Ndayishimiye, Lwambo, Mbotha, Karanja and Mwandawiro2009b ; Brooker et al. Reference Brooker, Hotez and Bundy2010). This has limited the application and impact of geospatial mapping efforts. There is consistent evidence that the application of GIS technology to public health and parasitology has far reaching benefits, particularly to study the distribution of parasites and their vectors. Most of the focus has been on the African continent, which suffers significant burden from infectious and neglected parasitic diseases. The limited application of GIS in other regions suggests there may be some challenges to its widespread uptake and application. In the following sections we list and examine some of these challenges and suggest cost-effective solutions. Content is based on the available literature, complemented and supplemented by the personal experiences of one of the authors (SF-L) gained over many years working in various capacities in Public Health in different geographical settings. Table 1 summarizes some of the major challenges and proposed cost-effective solutions, particularly geared at low- and middle-income settings.
Summary of challenges and possible solutions to the application of GIS in public health settings.

Limited access to GIS infrastructure
Lack of infrastructure has historically been a barrier to the utilization of GIS technology. This is partly related to the need for sophisticated (and usually expensive) licensed GIS software, which may be a significant hurdle for resource limited settings (Bergquist and Rinaldi, Reference Bergquist and Rinaldi2010). Significant costs are associated with the development of SDSSs, which often require specialized equipment. One study found that geographical reconnaissance accounted for the majority of the costs and, had household geo-reference data been previously collected, the costs would have been significantly reduced (Marston et al. Reference Marston, Kelly, Hale, Clements, Hodge and Jimenez-Soto2014).
There is increasing use of GIS in the mapping of households in countries where the technology is readily available (Clements et al. Reference Clements, Reid, Kelly and Hay2013; Kelly et al. Reference Kelly, Hale, Donald, Batarii, Bugoro, Nausien, Smale, Palmer, Bobogare, Taleo, Vallely, Tanner, Vestergaard and Clements2013). Open source GIS software is becoming increasingly user friendly, by incorporating graphic user interfaces (GUI) in addition to traditional command line operations, and a variety of algorithms and structured query language (SQL) packages analogous to those of the commercial options (Table 1 in Caprarelli and Fletcher, Reference Caprarelli and Fletcher2014). The use of low-cost internet and free GIS infrastructure is documented by Fisher and Myers (Reference Fisher and Myers2011). Their experience demonstrates how free software can be effectively applied to mapping and preliminary geospatial analysis, without the need for any centralized database or internet access (Fisher and Myers, Reference Fisher and Myers2011).
Chang et al. (Reference Chang, Parrales, Jimenez, Sobieszczyk, Hammer, Copenhaver and Kulkarni2009) have successfully developed a low-cost mapping and geo-referencing system which does not rely on continuous access to Internet, and is particularly useful for vector-borne disease surveillance and control. The system, created in Nicaragua as part of a nation-wide initiative, was successfully built around satellite images from Google Earth 4·3 (Google Inc. Mountain View, CA, USA) and constructed with ArcGIS 9 ArcMap software (ESRI, Redlands, CA, USA) made available through the Global Fund Program. The authors were able to easily manipulate base maps using ArcGIS and Erdas Imagine software, enabling future users to work with the complete satellite map without need of an Internet connection. The system is flexible and scalable, and could easily be replicated in other developing contexts with limited internet access (Chang et al. Reference Chang, Parrales, Jimenez, Sobieszczyk, Hammer, Copenhaver and Kulkarni2009), using open source GIS software.
Limited technical capacity and experience
There are several analytical techniques employed in the application of GIS technology which require from basic to more advanced skills (see Caprarelli and Fletcher, Reference Caprarelli and Fletcher2014). However, many organizations still do not have access to even the basic technical expertise, properly trained or devoted staff, to focus on GIS-related activities and to follow standardized procedures (Boulos, Reference Boulos2004). Many humanitarian and development focused agencies are increasingly utilizing GIS as part of their work in developing countries but lack of local technical capacity has resulted in external technical experts having to be brought in to build capacity for GIS-related activities (Kaiser et al. Reference Kaiser, Spiegel, Henderson and Gerber2003; Eisen and Lozano-Fuentes, Reference Eisen and Lozano-Fuentes2009). This increases the cost of the technology to the local organizations. Building local capacity is necessary for sustained use and maintenance of the resources, and requires a concerted effort to empower individuals and groups, sufficient time for training, and motivation and strategic planning. All these factors must exist to ensure that knowledge transfer, up-skilling and building of local technical capacity actually occurs (Ramasubramanian, Reference Ramasubramanian1999). International aid or donor-driven programmes in aid-dependent economies often find limited local capacity on which to build, due to limited or already stretched human resources, lack of institutional will and numerous competing priorities, unsustainable practices, heavy reliance upon technical assistance, with little or no transfer of technical skills, thus undermining post-project sustainability (Kimaro and Nhampossa, Reference Kimaro and Nhampossa2007; Chapman, Reference Chapman2010). Hence, the vicious cycle of dependence on external technical assistance in developing capacity continues (Godfrey et al. Reference Godfrey, Sophal, Kato, Vou Piseth, Dorina, Saravy, Savora and Sovannarith2002; Eade, Reference Eade2007).
One solution to this problem could be for local authorities to ensure that a capacity-building component that facilitates technical up-skilling of local personnel is included in all technical agreements. Strategic planning for workforce needs should also include identification of training capacity, both in terms of those to be trained and the source of training, and where this is not available locally, a suitable sustainable alternative ought to be identified. This may require strong links and collaboration with academic institutions and industry partners. Many high-income countries now offer scholarships/fellowships to developing counterparts for technical up-skilling, and GIS should be an area included in this development agenda. Local scientists could be regarded as assets in this area, by being involved in developing local GIS capability using their understanding of the local context, politics and needs, to ensure sustainability through continued knowledge transfer and skill development of local public health officers (Dunn et al. Reference Dunn, Atkins and Townsend1997; Sieber, Reference Sieber2000; Saikia, Reference Saikia2010), perhaps in the form of targeted high-intensity short training courses.
The experience with SIGEpi demonstrates how development partners have collaborated to build local capacity through technical cooperation. However, the process of requesting resources, support and engagement from the consortium members is highly structured, requiring a detailed proposal and high level institutional involvement. This may limit the effectiveness of this system to completely fulfil its stated objective to be a ‘GIS tool for different analytical procedures and processes related to monitoring of health events, health situation analysis, and support for the decision-making in health’ (Pan American Health Organization, 2008) in the broader Central and South American region. This is ultimately a problem, considering that the spread of infectious diseases does not recognize human-made political barriers between countries. Hence, affordability by the largest possible number of local and regional institutions should be one of the priorities to implement, and economic studies should provide ancillary data to envisage sustainable strategies to make this possible.
Limited data availability and analysis capacity
While the use and recognition of geographical information systems in health care and research institutions is increasing, some authors have lamented the fact that health and population datasets are imported on an ad-hoc basis and as such are not routinely stored or available for analysis (McGeehin et al. Reference Mcgeehin, Qualters and Niskar2004; Beale et al. Reference Beale, Hodgson, Abellan, Lefevre and Jarup2010). This generates problems, both in relation to the statistical uncertainties that are introduced as a consequence of uneven distribution of data in the spatial analysis, and in relation to the effectiveness of intervention, considering that the most data-poor areas are generally those that would require the most intensive monitoring (e.g., low- and middle-income countries, or less wealthy area codes in developed countries). Thus, in the public health context, an essential consideration for the use of GIS applications is the availability of good quality data, with access and utilization guided by appropriate policies and standard operating procedures, to ensure that public health policy and practice are informed by the best available evidence (Boulos, Reference Boulos2004).
Problems often arise with the use of population-based surveys that were not collected for mapping. This can lead to the use of clustering of data resulting in uneven geographical coverage (Clements et al. Reference Clements, Kur, Gatpan, Ngondi, Emerson, Lado, Sabasio and Kolaczinski2010), and the use of proxy variables which are imprecise exposure measurements, resulting in underestimation of the true effects or in a regression dilution bias (Frost and Thompson, Reference Frost and Thompson2000; Magalhães et al. Reference Magalhães, Barnett and Clements2011). Lack of uniformity in the way disease-related metrics (rates, incidence and prevalence) are recorded and reported within and between countries, and an inconsistency in the use of a wide array of covariates, complicates the development of national, regional and globally comparative maps of the same diseases (Hay et al. Reference Hay, Battle, Pigott, Smith, Moyes, Bhatt, Brownstein, Collier, Myers and George2013).
Good quality data are needed to determine the effectiveness of different spatial models such as spatially targeted vs. ad hoc or spatially uniform resource allocation strategies for disease elimination (Clements et al. Reference Clements, Reid, Kelly and Hay2013). Geospatial methods can be applied to the identification of malaria hotspots by investigation of spatial heterogeneity at different scales (Clements et al. Reference Clements, Reid, Kelly and Hay2013; Kasasa et al. Reference Kasasa, Asoala, Gosoniu, Anto, Adjuik, Tindana, Smith, Owusu-Agyei and Vounatsou2013). Limited emphasis has been placed on the conduct of operational research and randomized controlled trials that can determine the effectiveness of geospatial methods in real-world settings. Clements et al. (Reference Clements, Reid, Kelly and Hay2013) suggested that these types of studies are needed to demonstrate the effectiveness of geospatial science on improving decision-making and resource allocation in real-world elimination programmes. They postulated that a formal framework is needed to assess the effect of SDSSs on malaria elimination and that research is needed to identify measureable indicators to assess geospatial methods (Clements et al. Reference Clements, Reid, Kelly and Hay2013).
With the availability of cheaper and more user-friendly GIS technology, some of the problems of uneven data capture are being resolved: regular updating of data, allowing the addition of environmental and geographical variables to historical datasets that previously lacked them, has now become broad practice (Brooker et al. Reference Brooker, Kabatereine, Smith, Mupfasoni, Mwanje, Ndayishimiye, Lwambo, Mbotha, Karanja and Mwandawiro2009b ; Brooker et al. Reference Brooker, Hotez and Bundy2010). Limited availability of spatial data, privacy and confidentiality issues, restrictions to the access and use of individual health incident and outcomes data are some of the challenges that can be encountered particularly in working with human diseases. Challenges with data ownership, the ability to link publicly available data due to inconsistencies in data collection parameters and systems and limited knowledge of the application and interpretation of GIS in decision-making processes have also been reported (McLafferty, Reference Mclafferty2003). Data ownership is particularly problematic when it comes to access, and laws vary widely in different countries. Accessibility to data obtained via sponsors, donors or grants may be restricted.
Donors should ensure that clear agreements are in place to govern future ownership of the data collected in their sponsored projects, and how the infrastructure will be managed or integrated into local systems once donor funding ceases. Donors and local partners should ensure that clear guidelines and standard operating procedures are established around data entry (who, what, when and where) and for the sharing of information between stakeholders at the local level (Dunn et al. Reference Dunn, Atkins and Townsend1997; Sieber, Reference Sieber2000; Saikia, Reference Saikia2010). Some international organizations have already produced open access declarations in support of publicly funded research been made publicly available as a global public good (Chan et al. Reference Chan, Kirsop and Arunachalam2005). This approach could be adopted by other countries with the use of publicly funded data. In the public health context, ethical issues associated with rare conditions, confidentiality and de-identification of data would need to be considered and governed. In those cases, an ethics review process would need to be developed to streamline data access and use, and ensure that data are properly de-identified.
The overarching rationale to make data available and accessible is to ensure global public health is protected. Geospatial tools are paramount to prevention and containment of global threats. The international public health community therefore has interest in ensuring that adequate regulations are in place to govern the sharing of geospatial data for public health purposes. This could be achieved through existing international collaborative approaches such as those discussed in the previous section.
CONCLUDING REMARKS
The application of GIS technology in public health and epidemiology is expanding, thanks to increasing availability of the technology. The incorporation of GIS technology into disease surveillance systems and for the study of the distribution of parasites and of their vectors has furthered our understanding of the spatial components of disease risk and distribution patterns. The application of GIS technology to the study of parasitic diseases has contributed significantly to the understanding of parasite ecology and their associations with disease distribution, enabling the development of effective control and prevention interventions, mainly in developing regions. However, it is evident that GIS has been underutilized in some areas of public health and in some regions. While systemic limitations (lack of infrastructure, training, long-term maintenance of database, uniform and complete data collection, sharing of databases) may have contributed to its underutilization, there are several opportunities to improve free or low-cost access to GIS infrastructure, develop local technical capacity, and improve data availability and analysis capacity. This can be achieved through well- designed operational research and randomized control trials that can provide adequate evidence on the effectiveness of the GIS technology and SDSSs particularly in areas where implementation has so far been limited. Numerous lessons have been learned from the application of GIS technology in the developing world that can be translated to other regions sharing similar public health challenges and risks, as well as for the understanding of exotic diseases and risk factors among remote populations in industrialized regions. A good starting point is to build local technical capacity in under-resourced areas and to ensure that clear guidelines are in place to facilitate the use of GIS infrastructure, and sharing and application of data to manage public health problems. International collaborations that facilitate the sharing of knowledge and best practice should be encouraged.
ACKNOWLEDGEMENTS
Two anonymous reviewers provided valuable comments that led to an improved version of the manuscript.
FINANCIAL SUPPORT
This research received no specific grant from any funding agency, commercial or not-for-profit sectors.