I. INTRODUCTION
Al–Zn–Mg–Cu alloys have considerable physical properties such as low density, high strength, good processing, and welding performance. Reference Zhang, Li, Nie, Huang and Sun1,Reference Lin, Zhang, Chen, Zhou and Ma2 They are widely used in aerospace, aviation and civilian industries, and other industry fields. In particular, they play very important roles in the aviation industry as one of the main structural materials. With the wide use and one of the most important 7xxx alloys, performance requirements on Al–Zn–Mg–Cu alloys are also gradually increased. Different methods have been used to enhance the strength of Al–Zn–Mg–Cu alloys. Spray forming has rapidly developed in the past decades. Reference Raju, Ojha and Harsha3–Reference Liu, Lei, Xie, Wang and Li6 The cooling rate of the spray forming would approach 102–103 K/s, which was much higher than that of the conventional mold casting. Thus, a large solid solubility, fine grain size, homogeneous structure, and low segregation level were kept in the ingot. The 7055 alloys fabricated by spray forming have typical characteristics of rapid solidification advanced materials, such as equiaxed grains, homogeneous refinement, and slight segregation. Reference Wang, Wang, Yue and Gao7
High strength and high corrosion resistance were required simultaneously in spray deposited 7xxx alloys since they were used in aviation industry, where they need to significantly reduce the weight of the fuselage. Most previous researchers focused on the microstructure and mechanical properties of the 7xxx alloy to pursue high strength and fatigue resistance. Reference Zhao, Wang, Chen and Yan8,Reference Ning, Guo, Zhang, Cao, Jia and Sun9 However, in the service time of application, Al–Zn–Mg–Cu alloys are susceptible to local corrosion, like pitting, intergranular corrosion (IGC), exfoliation corrosion (EXCO), and stress corrosion cracking (SCC). Reference Najjar, Magnin and Warner10 Meantime, the comparatively complex environment of civil aircraft can lead to lots of water in the fuselage. Being soaked in such corrective solutions for a long period, the protective layer on components will be gradually ineffective. The aluminum alloy parts are inevitably exposed to a corrosive solution thus suffering corrosion. Reference Hu, Wang and Wen11,Reference Chen, Cheng and Xi12 Those components will be unserviceable and even endanger flight safety. As the aircraft flew in the sky, the exfoliation corrosion (EXCO) would always exist and it is one of the main types of structural corrosion in 7xxx aluminum alloys. Reference Li, Peng, Li, Jia, Chen and Zheng13,Reference Poole, Wells and Lloyd14 Moreover, the exfoliation corrosion reduces the strength, plasticity and fatigue properties, and the service life. As a replacement of the 7055 alloy, the spray deposited Al–Zn–Mg–Cu–Zr alloy exhibits high strength and ductility in our previous work. Reference Liu, Lei, Xie, Wang and Li6,Reference Yu, Wang, Jia, Xiao, Chen, Lei, Li, Chen, Zhang, Wang and Cai15 The corrosion resistance of Al–Zn–Mg–Cu alloy can be improved by developing a new heat-treatment process. Reference Andreatta, Terryn and de Wit16 Turning to the Al–Zn–Mg–Cu–Zr alloy, it is regarded as a candidate for replacing the 7055 alloy being used now. However, until now, there are no reports that investigated the exfoliation corrosion on the spray deposited Al–Zn–Mg–Cu–Zr alloy, which is an obstacle blocking this alloy to be the next generation of fuselage materials. In this work, different thermo-mechanical heat treatment methods were applied on a spray deposited Al–Zn–Mg–Cu–Zr alloy. The microstructure evolution and mechanical properties were studied, as well as the effect of aging mechanisms on the exfoliation corrosion behavior were discussed in detail, with an aim to explore the optimal thermos-mechanical heat treatment mechanism to develop high strength spray deposited Al–Zn–Mg–Cu–Zr alloy with good corrosion resistance.
II. EXPERIMENTAL PROCEDURE
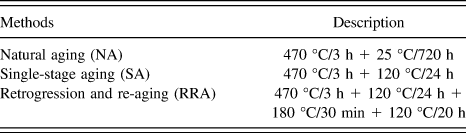
The material used in this study was an Al–Zn–Mg–Cu–Zr aluminum alloy including (in wt%) 8.11% Zn, 2.01% Mg, 2.36% Cu, 0.12% Zr, and the balance was Al. The ingot was prepared in a spray deposition method using an SFZD-5000 type environmental chamber, at Haoran Co., Ltd. (Jiangsu, China). Reference Yu, Wang, Jia, Xiao, Chen, Lei, Li, Chen, Zhang, Wang and Cai15 The as-deposited ingot was preheated at 420 °C for 30 min and forward hot extruded with an extrusion ratio of 6.25:1. The extruded rod was cut into several billets, then all of them were solution treated at 470 °C for 3 h, and followed by rapid quenching. Then, the samples with three different aging mechanisms [natural aging (NA), single-stage aging (SA), and retrogression and re-aging (RRA)] were prepared to conduct corrosion testing. The aging treatment temperature and time for the corrosion test samples are listed in Table I. Exposed surface of the aging treatment samples for corrosion test was ground, polished, rinsed, and dried successively.
Aging treatments applied to the studied alloy.

The accelerated EXCO test was performed according to the standard EXCO test as described in ASTM-G34-01. 17 The EXCO solution consisted of 4 mol/L NaCl + 0.5 mol/L M KNO3 + 0.1 mol/L HNO3. 234 g of NaCl and 50 g of KNO3 were dissolved in water, and 6.3 mL of concentrated HNO3 (70 wt%) was added. Dilute to 1 L solution having an apparent pH of 0.4. The solution temperature was maintained at 25 ± 2 °C using a thermostat. The electrolyte volume-electrode surface area ratio was 15 mL/cm3, as defined by the EXCO test standard. Three electrode systems with Pt were conducted as auxiliary electrodes, and saturated calomel electrodes (SCE) were used as the reference electrodes. The potentiodynamic scanning curves were conducted in a CHI660E electrochemical workstation (CH Instruments, Inc., Austin, Texas) with a scanning range from −1.1 V to −0.5 V and a scan rate of 5 mV/s EIS. Experiments were performed with an Autolab electrochemical workstation (Metrohm Autolab B.V., Utrecht, The Netherlands). A frequency range of 0.01 Hz–10 kHz was selected for its sensitivity to corrosion resistance; the alternating voltage was 10 mV. Meanwhile, EIS data were simulated via Z-View software according to an equivalent circuit. After the corrosion products were eliminated by immersing the samples in 30% HNO3 for 2 min, they were cleaned with plenty of distilled water. The samples’ corrosion morphologies were characterized by a Sirion 200 scanning electron microscope (FEI Company, Hillsboro, Oregon). To evaluate the depth of the corrosion attack, samples that underwent EXCO test were mechanically ground and polished, and the cross-section views of morphology were recorded by an optical microscope. The aging treatment samples were observed using a TECNAI G2 F20 transmission electron microscope (FEI Company) with an operation voltage of 200 kV.
III. RESULTS AND DISCUSSION
A. Thermomechanical treatment
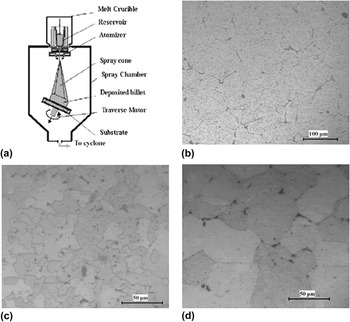
Figure 1(a) shows a schematic diagram of the spray-forming deposition process. Spray forming technology in the Osprey mode includes metal melting, gas atomization, micro-droplets spraying, deposition, and semisolid slurry consolidation. Reference Yu, Wang, Sheng, Li, Chen, Lei and Chen18 This novel technology could produce near-net shape preforms through the integration of the above stages as one single-step operation naturally. Another important feature is high cooling rate, which reaches 104–105 K/s, Reference Grant4,Reference Afonso, Spinelli, Bolfarini, Botta, Kiminami and Garcia19 which depends on the size of the micro-droplets and their relative velocity with the gas stream. The distinguished microstructural features of spray forming products are the refined equiaxed-grain structure and low segregation level. Reference Wu, Del Castillo and Lavernia20,Reference Hyodo, Bolfarini and Ishikawa21 Figure 1(b) shows the microstructures of the as-deposited Al–Zn–Mg–Cu–Zr alloys followed by thermal-mechanical heat treatment. During the solidification process, some secondary phases were precipitated during solidification. These secondary phases were distributed both on grain boundaries and inside grains [Fig. 1(b)]. After being extruded at 420 °C with an extrusion ratio of 6.25, equiaxed grains appeared in billets with a grain size between 20 and 30 μm. Non-equilibrium solidification phases still were inherited in the homogenization samples [Fig. 1(c)]. 470 °C was an appropriate solution treatment temperature for the 7055 Al alloy. Reference Liu, Zhong, Zhang, Liu, Zhang and Deng22 After a solution treatment at 470 °C for 3 h was performed, the dendrite structure in the spray deposited Al–Zn–Mg–Cu–Zr alloy ingot has been eliminated, and non-equilibrium solidification phases were re-dissolved into the matrix [Fig. 1(d)].
(a) Schematic diagram of the spray forming process. 17 (b) Microstructure of the as-deposited ingot. (c) Microstructure of the billet after being extruded at 420 °C with an extrusion ratio of 6.25:1. (d) Microstructure of the extruded billet after being solution treated at 470 °C for 3 h.

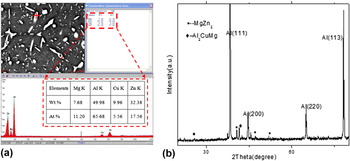
To determine the types of secondary phases, energy dispersive spectrometry and X-ray diffraction spectra of the spray-deposited studied alloy were detected, as shown in Fig. 2. Some white rod-shaped precipitates were captured in the as-deposited ingot [Fig. 2(a)], and the point analysis EDS results showed that white precipitates were rich in Mg and Zn. The X-ray diffraction spectra in Fig. 2(b) show that the MgZn2 was the main secondary phase in the ingots, which was the main hardening phase. Reference Deschamps, Livet and Brechet23 In addition, Al2CuMg phases were formed during the solidification process Reference Lai, Jiang, Liu, Dun, Li, Li and Cent24 [Fig. 2(b)]. Higher temperatures were required to dissolve the secondary phase particles into matrix; therefore, a solution treatment was conducted on the extruded samples [Fig. 1(d)].
Non-equilibrium solidification phase analysis on the as-deposited ingot. (a) Energy dispersive spectrometry, (b) X-ray diffraction pattern.

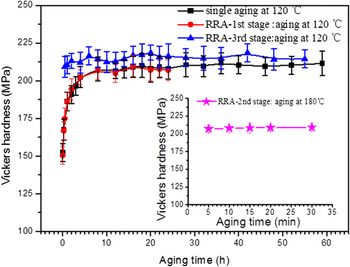
Figure 3 shows the hardness variation of the solution treated Al–Zn–Mg–Cu–Zr alloy aged at 120 °C with different methods. The aging treated temperature and time for the corrosion test samples are listed in Table I. After hot extrusion at 420 °C and solution treatment at 470 °C for 3 h, the hardness of the spray-deposited alloy was 152 HV. Here, two different aging methods were conducted on the samples, the first one was single-stage aging treatment, which means the sample was aged at 120 °C after solution treatment; and the other one was a retrogression and re-aging, which means the samples were aged at 120 °C for 24 h first, and then aged at 180 °C for 30 min, finally aged at 120 °C. As with the single-stage aging process, at the early aging state, hardness increased quickly and reached 205 HV in 4 h. Further increasing the aging time to 60 h, the hardness increased persistently and slightly, and the final Vicker hardness was 211 HV. As with the retrogression and re-aging, the first stage ranges from 0 h to 24 h when the sample was aged at 120 °C, the hardness variation showed a same trend to that occurred in single aging process (from 152 HV to 207 HV). Then in the second stage (aged at 180 °C for 30 min), the hardness slightly increased from 207 HV to 209 HV. Finally in the third stage (aged at 180 °C for 54 h), the hardness increased in the early few hours and then decreased slightly, and the peak hardness appeared after being aged for 20 h, with an average high hardness of 215 HV.
Hardness via a function of aging time with different aging methods.

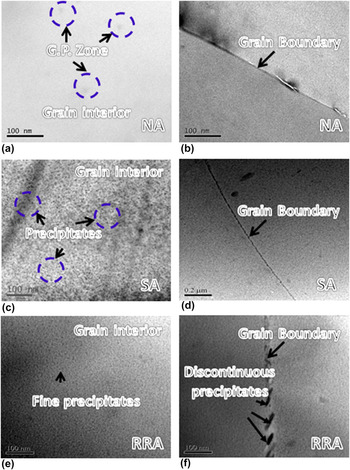
The hardness is primarily dependent on the microstructure. Precipitation occurred in the solution treatment during aging treatment. TEM observations were conducted to characterize the initial microstructure of the exfoliation corrosion samples. Figure 4 shows the bright-field TEM images of the studied samples. Figures 4(a) and 4(b) give the micrographs of the studied alloys that underwent natural aging at room temperature (25 °C) for 720 h. From Figs. 4(a) and 4(b), there is a mottled appearance in the matrix and slightly discrete contrast due to the GP zones in the natural aging (NA) sample. On the grain boundaries, there is no precipitation free zone (PFZ). Figures 4(c) and 4(d) give the micrographs of the studied alloy having been treated with single aging at 120 °C for 24 h. In the single aging sample aged at 120 °C for 24 h, precipitates were observed in the bright field TEM photographs [Fig. 4(c)]. There are also some precipitates on the grain boundary [Fig. 4(d)]. In the retrogression and re-aging sample treated at 470 °C for 3 h, first aging occurred at 120 °C for 24 h, second aging at 180 °C for 30 min, and final aging at 120 °C for 20 h, a great number of precipitates were formed, and they were located inside the grains with small size [Fig. 4(e)], and there are many coarse discontinuous precipitates on the grain boundary [Fig. 4(f)]. According to investigations reported by many researchers, the rod-like precipitate is η′-MgZn2. Reference Li, Hansen, Gjonnes and Wallenberg25–Reference Totten and MacKenzie27 From Fig. 4, the precipitates on the grain boundary of the RRA sample are much larger than those in SA and NA samples. In the aging process of spray deposited Al–Zn–Mg–Cu–Zr alloy, the precipitation sequence of the precipitated phase was approximately: Reference Uguz and Martin28–Reference Talianker and Cina30 SSS (supersaturated solid solution) → G. P. Zone → η′(MgZn) → η(MgZn2). The G. P. Zone was coherent with the matrix, the η′(MgZn) was semi-coherent with the matrix, and the η(MgZn2) was non-coherent with matrix. The G. P. Zone and the η′(MgZn) played a major strengthening role in strengthening the alloy, while the η(MgZn2) was often coarse and has smaller strengthening effect. The change of RRA process performance primarily depended on the size, number, and distribution of the G. P. Zone and η′(MgZn) phase. Thus, the RRA only slightly improves the strength of the alloy due to the coarse precipitates on the grain boundary.
TEM graph of the studied alloy samples having undergone different aging methods. (a) Grain inside and (b) grain boundary of the NA samples having undergone natural aging at 25 °C for 720 h; (c) grain inside and (d) grain boundary of the SA samples having undergone aging at a temperature of 120 °C for 24 h; (e) grain inside and (f) grain boundary of RRA samples having undergone retrogression and re-aged (120 °C/24 h + 180 °C/30 min + 120 °C/20 h).

B. Exfoliation corroded morphologies
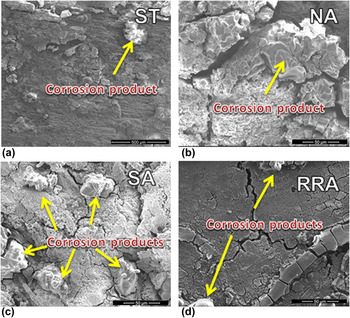
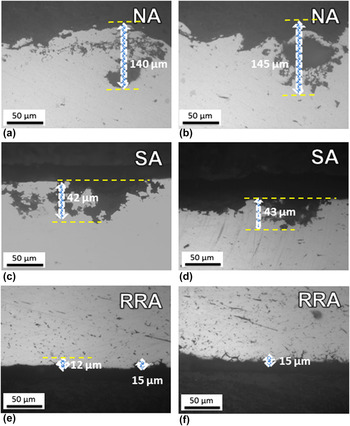
The corrosion bubbles adsorbed on the surface of specimens after being immersed in the EXCO solution, then they moved to the surface of the solution while the amount of corrosion spots was increased. The homogeneous corrosion gradually develops to intergranular corrosion and pitting corrosion that can become peeling, blistering, and bursting. After immersion for 24 h, the surface morphologies of the samples were observed using an SEM, the results are shown in Fig. 5. While the cross-section view of the morphologies of the samples was characterized by an optical microscope, the micrographs are shown in Fig. 6. The NA samples had been seriously corroded with blisters even after bursts appeared on the surface and deeply-etched pits from the cross-section sample. The NA sample showed some blisters on the surface, and the exfoliation corrosion attack depth was 143 µm [Fig. 6(a)] after aging at 25 °C for 720 h. It was 42 µm in the SA sample [Fig. 6(c)] after aging at 120 °C for 24 h, and it was 15 µm in the RRA sample [Fig. 6(e)] after aging at 120 °C/24 h + 180 °C/30 min + 120 °C/20 h. The EXCO susceptibilities of the studied alloy were significantly influenced by the aging treatment method, and the RRA sample showed the smallest corrosion attack depth. The exfoliation corrosion is a special form of intergranular corrosion. During the intergranular corrosion process, the corrosion product accumulates on grain boundary, resulting in a wedging force and lifting the alloy surface. That is to say, greater susceptibility to intergranular corrosion leads to greater sensitivity to exfoliation corrosion. The intergranular corrosion susceptibility is associated with the distribution, size, and electrochemical behavior of the precipitate on the grain boundary. Some precipitate particles on the grain boundary are preferentially corroded. If the anodic precipitates are distributed continuously or closely on the grain boundary, there exists an active corrosion path resulting from the galvanic action between these anodic precipitates and their adjacent matrix or PFZ, resulting in severe sensitivity to intergranular corrosion, since the precipitates are more sensitive to corrosion than the matrix, and will be preferentially dissolved. Then great susceptibility to exfoliation corrosion was expected. This is why the RRA sample with coarse precipitates possessed much smaller depth of corrosion attack than the NA and SA samples with fine and continuous precipitates on the grain boundary.
Exfoliation corrosion morphologies of spray deposited studied alloy having undergone different aging methods after immersion in EXCO solution for 24 h. (a) As-solution treated (ST) state; (b) NA: aged at 25 °C for 720 h; (c) SA: aged at 120 °C for 24 h; (d) RRA: 120 °C/24 h + 180 °C/30 min + 120 °C/20 h.

Cross sections of exfoliation corrosion samples having undergone different aging methods after immersion in EXCO solution for 24 h: (a) and (b) NA: aged at 25 °C for 720 h; (c) and (d) SA: aged at 120 °C for 24 h; (e) and (f) RRA: 120 °C/24 h + 180 °C/30 min + 120 °C/20 h.

C. Electrochemical test
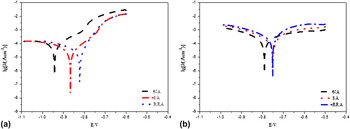
Polarization curves of the spray deposited Al–Zn–Mg–Cu–Zr alloy with and without immersion in the EXCO solution for 24 h are shown in Fig. 7. The corrosion attack is in proportion to the corrosion current (i corr), while the corrosion potential (E corr) reveals the corrosion tendency. The more positive the corrosion potential, the harder corrosion initiates. For the samples without immersion in the EXCO solution, the potentiodynamic scanning curves indicate that the corrosion potential of the SA treatment was higher than that of the NA specimen, but was lower than that of the RRA specimen. The tafel slopes of the anodic branches of the polarization curves were larger than those of the cathodic ones, indicating that cathodic polarizing showed a higher polarization resistance. The difference in corrosion potential of different agings had decreased. The compact oxide film was formed on the surface by increasing the immersion time. The corrosion tendency of the matrix tended to stop. Slopes of the anodic branches in the polarization curves were close to cathodic ones and corrosion potential values were shifted to higher positive values.
Polarization curves of the studied alloy without and with immersion in the EXCO solution. (a) Without immersion in the EXCO solution; (b) after immersion in the EXCO solution for 24 h.

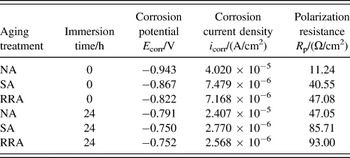
The corresponding corrosion parameters such as the corrosion current density (I corr), corrosion potential (E corr), and polarization resistance (R p) are listed in Table II. The polarization resistance can be calculated by the following equation: Reference Tait31
 $${R_{\rm{p}}} = {{\left| {{b_{\rm{a}}}} \right| \cdot \left| {{b_{\rm{c}}}} \right|} \over {2.303\left( {\left| {{b_{\rm{a}}}} \right| + \left| {{b_{\rm{c}}}} \right|} \right)}} \cdot {1 \over {{I_{{\rm{corr}}}}}}\quad ,$$
where b a is the anodic slope and b c is the cathodic slope. For immersion both 0 and 24 h, RRA samples showed the lowest corrosion current densities and the most positive corrosion potential, indicating that the RRA sample has the best exfoliation corrosion resistance. Compared with Figs. 4(b), 4(d), and 4(f), it could be seen that after RRA, the dispersed precipitates on the grain boundary coarsened, and a PFZ zone was formed. These coarse precipitates stroke a balance of electrochemical potential between the matrix and particles near the grain boundary, and meanwhile the blocked anodic dissolution channels, revealing that RRA could improve the resistance to exfoliation corrosion. Reference Wang, Zhao, Cui and Guo32
Polarization curves fitting parameters of the studied alloy in EXCO with different aging methods.

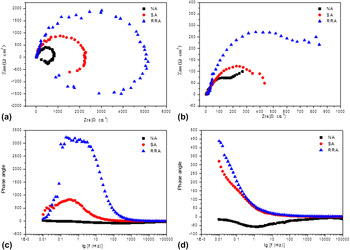
The EIS was a non-destructive electrochemical technique to characterize the electrochemical reactions at the metal/electrolyte interface and the formation of corrosion products. Impedance spectra were normally displayed in the form of a Nyquist plot and a Bode plot. Solute atoms, residual stress, and lattice distortion would accelerate the corrosion process. Reference Lin, Zhang, Liu and Liang33,Reference Wang, Zhao, Yan and Lu34 To compare the exfoliation corrosion susceptibility of the studied alloy under different aging treatments, EIS diagrams were carried out in the EXCO solution for 0 h and 24 h, respectively. Figure 8 gives the experimental EIS plots for all samples with and without immersion in EXCO solution for 24 h. When EIS testing was conducted on samples directly without immersion in EXCO solution, as shown in Fig. 8(a), the Nyquist plots revealed only a depressed capacitive arc in the high-medium frequency range, which indicated that the corrosion process had undergone an activation control process. Moreover, inductive loops in the low frequency zone were related to the initiation of pitting corrosion. Reference Su, Zhang, Shi, Yang, Zhang and Cao35,Reference Conde and de Damborenea36 The weakening of the aluminum oxide thin film promoted the inductive behavior due to the anodic dissolution of Al alloy. In addition, the inductive resistance was produced in inducing period of pitting of the aluminum oxide film. The inductive resistance disappeared as soon as pitting initiated. Reference Li, Jia, Li, Birbilis and Cai37,Reference Keddam, Kuntz, Takenouti, Schuster and Zuili38 Compared with samples without immersion in the EXCO solution, samples having undergone immersion in EXCO solution for 24 h showed different Nyquist plot curves, as shown in Fig. 8(b). The NA sample showed the smallest arc diameter in Figs. 8(a) and 8(b), indicating that the NA sample showed a low anti-resistance in the EXCO solution. The RRA sample showed the largest arc diameter in Figs. 8(a) and 8(b), which means that the RRA sample showed the best corrosion resistance in EXCO solution. In general, it can be seen that the EIS measurements agreed well with the polarization results, and the corrosion resistance of the RRA sample is the largest after the sample was immersion treated in EXCO solution for 0 h or 24 h.
Electrochemical impedance spectroscopy of the three kinds of aged treated samples without and with immersion in an EXCO solution for 24 h. Nyquist plot (a) and Bode plot (c) are for samples without immersion in EXCO solution; Nyquist plot (b) and Bode plot (d) are for samples with immersion in EXCO solution for 24 h.

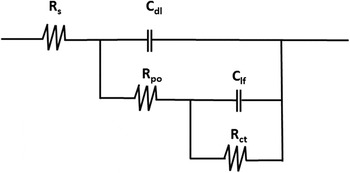
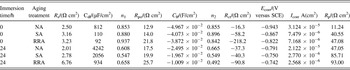
Figure 9 gives quantitative support to the experimental results and a better explanation about the susceptibility to corrosion, impedance parameters obtained by the Zview software using an equivalent circuit model. Reference Peng, Chen, Fang, Chao and Chen39 The physical meanings of the equivalent circuit elements are shown as follows: R s is the equivalent series resistance of the electrolyte, C fl is the capacitance of the film, R po is the pore resistance of the film, C dl is the capacitance of the double layer of the aluminum alloy, and R ct is the polarization resistance of the electrode. According to the circuit, the typical EIS parameters are listed in Table III. It is clear that the RRA sample has higher R po or the porous layer polarization resistance than those of NA and SA samples. Moreover, the C dl for the RRA sample exhibited the lowest measured values, which can be associated with both an increase in the passive layer thickness and a decrease in the oxide film dielectric constant. Reference Xiao, Pan, Li, Liu and He40 Generally, a system with lower C dl and higher R po is resistant to corrosion. Reference Lin, Liao, Jehng, Chang and Lee41 These results further confirmed that the RRA sample showed highest corrosion resistance while the NA sample showed the lowest corrosion resistance.
Equivalent electric circuit for all immersions of spray deposited studied alloy in EXCO solution. R s: solution resistance; C dl: origin surface double layer capacitive; R p: polarization resistance; C lf: low frequency capacitive; R ct: charge transfer resistance.

Polarization curves fitting parameters of the studied alloy in EXCO solution.

D. Corrosion products
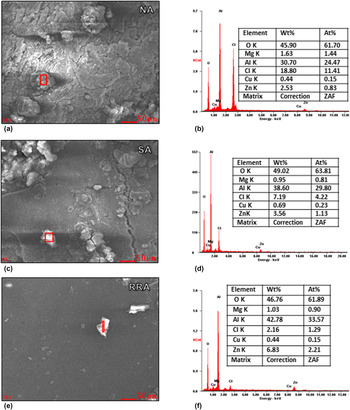
Figure 10 shows SEM images and EDX analysis of the Al–Zn–Mg–Cu–Zr alloy in the EXCO solution for 24 h. As seen from the EDX results, corrosion products were rich in O, Cu, Zn, and Al elements. The content of Al was as high as 30–42% in the products, indicating that the Al2O3 was the main corrosion product. The contents of Zn of NA, SA, and RRA samples were 2.53%, 3.46%, and 6.83%, respectively. Zn existed in aging treatment samples in forms of MgZn2 precipitates, Reference Liu, Zhang, Li, Li, Xiong and Zhang42 and it was dissolved from the precipitates due to the exfoliation corrosion. After different aging treatments, the RRA sample precipitated more MgZn2 particles, thus the Zn content in the corrosion products of the RRA sample was much higher than those in the other two samples. For the studied Al–Zn–Mg–Cu–Zr alloy, magnesium and zinc-depletion zones often provided the opportunity of intergranular and exfoliation attack. Therefore, during the corrosion process, the corrosion took place on the grain boundary first, and then corrosion propagated along the grain boundary parallel to the sample’s surface. Corrosion products were accumulated in the grain boundary and they lifted the surface. Since the MgZn2 precipitates were well-distributed due to the aging treatment, the intergranular corrosion can be deterred by this phase. The exfoliation degree was superficial and the exfoliation morphology displayed as local blisters. As soon as the exfoliation corrosion began, the impedance spectroscopy would be composed of two capacitive arcs [Fig. 8(a)], one resulting from the original old surface and the other from the newly formed interface by exfoliation corrosion (Figs. 5 and 6). Therefore, the intensity of the exfoliation corrosion can be judged through the analysis of these two capacitive components. After immersion for long time, the corrosion condition in the EXCO solution was not so aggressive, the surface of the corroding electrode began self-preparation and the corrosion product film on the surface became denser, which resulted in only one capacitive loop in the Nyquist plot [Figs. 8(b) and 8(d)] and which indicated a beginning of general corrosion [Figs. 5(d), 6(e), 6(f), and 10(c)].
EDX analysis of the corrosion products in NA (a and b), SA (c and d), and RRA (e and f) samples.

E. Corrosion mechanism
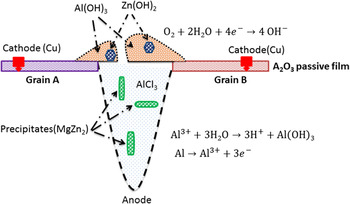
Figure 11 gives a schematic diagram showing the intergranular corrosion. It is very common that the copper corrosions were formed by the oxidation of the CuAl2 units in the metal structure. Under the same condition, the aluminum oxide formed as aluminum corrodes. Due to the high reactive nature of aluminum, Cu2O was converted back to metal by reaction with aluminum metal,
 $$2{\rm{Al}} + 3{\rm{C}}{{\rm{u}}_2}{\rm{O}} \to {\rm{A}}{{\rm{l}}_2}{{\rm{O}}_3} + 6{\rm{Cu}}\quad {\rm{.}}$$
Schematic diagram of the exfoliation corrosion behavior in the spray deposited Al–Zn–Mg–Cu–Zr alloy.

The formal cell potential for the above reaction is +1.98 V and thus this process is spontaneous. In light of the fact that none of the copper corrosion products can co-exist in contact with aluminum metal under equilibrium condition, it is not surprising to find that copper deposits on parts of the aluminum surface. In the intergranular corrosion of aluminum the deposited copper acts as a cathodic site for the facile reduction of oxygen, Reference Rao and Rao43 viz.,
 $${{\rm{O}}_2} + 2{{\rm{H}}_2}{\rm{O}} + 4{{\rm{e}}^ - } \to 4{\rm{O}}{{\rm{H}}^ - }\quad .$$
The anodic reaction appeared at the bottom of the pitting, as well as on grain boundaries
 $${\rm{Al}} \to {\rm{A}}{{\rm{l}}^{3 + }} + 3{{\rm{e}}^ - }\quad ,$$
and aluminum ions were migrated to the interfacial region where a hydrolysis occurred,
 $${\rm{A}}{{\rm{l}}^{3 + }} + 3{{\rm{H}}_2}{\rm{O}} \to {\rm{Al}}{({\rm{OH}})_3} + 3{{\rm{H}}^ + }\quad ,$$
which made the pitting acidic. Chloride ions were migrated into the pitting to form aluminum chloride (AlCl3) which has been dissolved in the solution. Because of the low pH the aluminum may also corrode with the evolution of the hydrogen,
 $$2{\rm{Al}} + 6{{\rm{H}}^ + } \to 2{\rm{A}}{{\rm{l}}^{3 + }} + 3{{\rm{H}}_2}\quad ,$$
where there was an equilibrium between the formation of aluminum oxide and AlCl3, at the interfacial region,
 $${\rm{A}}{{\rm{l}}_2}{{\rm{O}}_3} + 6{{\rm{H}}^ + } + 6{\rm{C}}{{\rm{l}}^ - } \to 2{\rm{AlC}}{{\rm{l}}_3} + 3{{\rm{H}}_2}{\rm{O}}\quad {\rm{.}}$$
When aluminum chloride is formed, a pit develops and the pit passivated when the alumina formed. The chloride ions directly affected the corrosion potential of aluminum. The higher the chloride ion concentration, the more negative is the corrosion potential, and the faster the metal will corrode. Chloride ions accelerated the corrosion process but whether it was due to oxide film breakdown or assisting the anodic reaction has not been known. To be effective in arresting further corrosion the treatment process must remove the re-deposited copper from the remaining metal surface and also remove chloride ions. Appropriate aging treatment could approach the desirable microstructure. According to Fig. 4, the RRA sample showed a similar structure in the grain interior with the NA sample, and with coarse discontinuous precipitates in grain boundary. Comparing with the NA sample and SA samples, the RRA sample had less G.P. Zones and more precipitates, thus the lattice distortion stress is small and it has high thermodynamic stability. Reference Lin, Liu, Li, Han and Chen44,Reference Robinson45 After the RRA treatment, solute atoms formed precipitates on the grain boundary, resulting in purifying the matrix, homogenizing the chemical composition, and reducing the electrochemical difference between grain interior and grain boundary. Precipitates were dissolved during the exfoliation corrosion process. Reference Zheng, Li and Mo46 Moreover, it is difficult that precipitates on the grain boundary formed continuous corrosion channels, Reference You, Li, Li, Liu and Zhu47 which slowed down the corrosion speed along the grain boundary. Zhe et al. reported that coarse precipitates could capture the free hydrogen atoms and turn them to hydrogen molecule, which escaped from the grains in form of the bubbles, Reference Zhe, Gu and Gao48 resulting in reducing the hydrogen concentration on the grain boundary and enhancing the corrosion resistance. The precipitates in grain interior and grain boundary of RRA samples are larger in amount and size than those of the SA and NA samples, which make the RRA sample low corrosion susceptible.
IV. CONCLUSIONS
In summary, three aging mechanisms of the natural aging (NA), single-stage aging (SA), and retrogression and re-aging (RRA) were pretreated on spray deposited Al–Zn–Mg–Cu–Zr alloy samples, then effects of aging mechanisms on the exfoliation corrosion behavior were investigated in detail. The self-corrosion potentials of all the electrodes followed the sequence of E RRA > E SA > E NA, which also implied that the descending order of corrosion resistance in the studied alloy was as follows: RRA < SA < NA. At the beginning of the immersion, the corrosion current densities of all the electrodes satisfied the sequence: I NA > I SA > I RRA. The impedance diagrams in the Nyquist plots display a capacitive arc in the high frequency range and an inductive loop in the low frequency range when samples were immersion treated in an EXCO solution for 24 h. The corrosion current densities and the polarization resistance decreased after immersion in the EXCO solution for 24 h. The precipitates in grain interior and grain boundary of RRA sample were larger in amount and size than those of SA and NA samples, which made the RRA sample low corrosion susceptibility.
ACKNOWLEDGMENTS
The authors thank and acknowledge the financial support from the National Natural Science Foundation of China (51271203).