INTRODUCTION
The formation and evolution of the Tibetan Plateau have profound implications for the understanding of continental deformation mechanics (Tapponnier et al., 2001). Most of the high-elevation landforms related to the plateau were distributed east of the main Himalayan collision zone, where the crustal volume increased more than 2 × 10⁷ km3 in Cenozoic times (Clark et al., 2005). The crustal deformation and thickening in the southeastern Tibetan Plateau had a significant effect on large fluvial systems, landforms, and climate in East Asia (Brookfield, Reference Brookfield1998; Zhong et al., Reference Zhong, Xu, Yang and Wang2018; McRivette et al., Reference McRivette, Yin, Chen and Gehrels2019; Li et al., Reference Li, Chen, Zhou, Song, Zhang, Gu and Cao2020; Xiang et al., Reference Xiang, Huang, Ogg, Zhu and Kang2020; Li et al., Reference Li, Sun and Zhang2022). Thus, research of river evolution can reveal the processes and degree of effect of the Tibetan Plateau tectonic activity on East Asia and its surrounding regions, and help us better understand the significance of the Tibetan Plateau uplift.
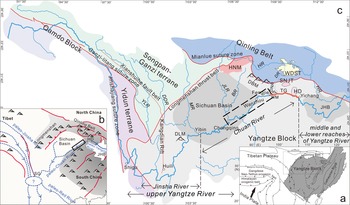
The Yangtze River originates in Tibet and flows through the southeastern Tibetan Plateau (Fig. 1), whose evolution mirrors the tectonic activity of the plateau and allows a reconstruction of the surface uplift history of the plateau (Li, Reference Li1991; Pan et al., Reference Pan, Wang, Gao, Chen, Li and Liu2005a; Clift et al., Reference Clift, Blusztajn and Nguyen2006, Reference Clift, Long, Hinton, Ellam, Hannigan, Tan, Blusztajn and Duc2008; Perrineau et al., Reference Perrineau, Van Der Woerd, Gaudemer, Jing, Pik, Tapponnier, Gloaguen and Ratschbacher2011; Li et al., Reference Li, Fang, Song, Pan, Ma and Yan2014). The Yangtze River can be divided into three segments based on tectonic and topographic units (Wang, Reference Wang1985; Zhang et al., Reference Zhang, Liu, Wang, Liu and Xue2018): the Jinsha River from its headwaters to Yibin, the Chuan River from Yibin to Yichang (the Jinsha and Chuan Rivers together are called the upper Yangtze River), and the middle and lower reaches of the Yangtze River (Fig. 1c). In previous studies, more attention was paid to the Chuan River, especially in the Three Gorges area, because it holds a critical position, connecting the upper Yangtze River with the middle and lower Yangtze River (Yang et al., Reference Yang, Li and Yokoyama2006; Liu et al., Reference Liu, Chen, Maher, Zhao, Yue, Sun and Chen2018; Sun et al., Reference Sun, Li, Kuiper, Wang, Tian, Vermeesch, Zhang, Zhao and Wijbrans2018). Tian et al. (Reference Tian, Li and Luo1996) and Clark et al. (Reference Clark, Schoenbohm, Royden, Whipple, Burchfiel, Zhang and Tang2004) proposed that there was a westward-flowing paleoriver west of the Three Gorges before the eastward-flowing Yangtze River appeared. Clift et al. (Reference Clift, Blusztajn and Nguyen2006, Reference Clift, Long, Hinton, Ellam, Hannigan, Tan, Blusztajn and Duc2008, Reference Clift, Carter, Wysocka, Hoang, Zheng and Neubeck2020) conducted research on the Red River catchment in Vietnam and sedimentary rocks in SW China, and these works supported the presence of a paleoriver flowing from east to the west via the Three Gorges and Shigu (Fig. 1b) before the major reorganization of the ancient river systems. A paleoriver flowing westward from west of the Three Gorges was also proposed by Wang (Reference Wang2010) and Wang et al. (Reference Wang, Zheng and Liu2013b, Reference Wang, Zheng and Liu2013c), based on an analysis of topographic gradients, logarithmic relationships of the drainage areas and distances, and confluence angles of the tributaries. Although the existence of the westward-flowing paleo-Chuan River before the Yangtze River reorganization was accepted by most geologists (Tian et al., Reference Tian, Li and Luo1996; Clark et al., Reference Clark, Schoenbohm, Royden, Whipple, Burchfiel, Zhang and Tang2004; Clift et al., Reference Clift, Blusztajn and Nguyen2006, Reference Clift, Long, Hinton, Ellam, Hannigan, Tan, Blusztajn and Duc2008, Reference Clift, Carter, Wysocka, Hoang, Zheng and Neubeck2020; Wang, Reference Wang2010; Wang et al., Reference Wang, Zheng and Liu2013b, Reference Wang, Zheng and Liu2013c), little sedimentary evidence has been found to support this viewpoint.
(a) Map showing the major tectonic blocks and the study area location. (b) Sketch map showing the tectonic–geomorphic framework before the birth of the modern Yangtze River. (c) Simplified tectonic map of the upper Yangtze River, adjacent orogenic belts and terranes; the dashed box indicates the study area (modified from Wang, Reference Wang1985; Zheng, Reference Zheng2015). BR, Ba River; DBM, Daba Mountains; DDR, Dadu River; DLM, Daliang Mountains; DNR, Daning River; DR, Du River; HD, Huangling Dome; HNM, Hannan Massif; HR, Han River; JHB, Jianghan Basin; JLR, Jialing River; MR, Min River; SG, Shigu; SNJT, Shennongjia terrane; TG, Three Gorges; WDST, Wudangshan terrane; WM, Wu Mountain; YLR, Yalong River.

Debate on the formation of the Three Gorges has continued. Most previous studies suggest that the formation age of the Three Gorges is 1.2 –0.7 Ma (Pleistocene) based on studies of terraces in the Three Gorges, Quaternary deposits in the Jianghan Basin, and continuous cores of boreholes in the Yangtze delta (Tang and Tao, Reference Tang and Tao1997; Li et al., Reference Li, Xie and Kuang2001; Yang et al., Reference Yang, Li and Yokoyama2006; Wang et al., Reference Wang, Li, Yang and Wang2009; Xiang et al., Reference Xiang, Yang, Tian, Li and Lu2011, Reference Xiang, Du, Huang, Kang, Zhu and Feng2018; Liu et al., Reference Liu, Chen, Maher, Zhao, Yue, Sun and Chen2018; Sun et al., Reference Sun, Li, Kuiper, Wang, Tian, Vermeesch, Zhang, Zhao and Wijbrans2018). Other studies, however, have indicated that the Three Gorges formed before the Pliocene, based on the fluvial deposition in the lower reaches of the Yangtze River, detrital zircons in the Yangtze delta, Nd and Pb isotopes in the sediments of the Hanoi Basin, and the Cenozoic sediments in the Jianghan Basin and offshore basins in East China (Clift et al., Reference Clift, Long, Hinton, Ellam, Hannigan, Tan, Blusztajn and Duc2008; Jia et al., Reference Jia, Zheng, Huang, Wu, Yang, Wang and He2010; Zheng et al., Reference Zheng, Clift, Wang, Tada, Jia, He and Jourdan2013; Yang et al., Reference Yang, Shen, Massimiliano, Yu, Shi and Mei2019; Fu et al., Reference Fu, Zhu, Geng, Yang, Zhong, Huang, Zhang and Xu2021; Sun et al., Reference Sun, Tian, Kuiper, Li, Zhang and Wijbrans2021; Zhang et al., Reference Zhang, Stephen Daly, Li, Tyrrell, Sun, Badenszki, Li, Zhang, Tian and Yan2021). Despite disagreement surrounding the formation time of the Three Gorges, previous studies have indicated that the opening of the Three Gorges was an important capture event that led to the birth of the modern Yangtze River (Yang et al., Reference Yang, Li and Yokoyama2006; Wang et al., Reference Wang, Li, Yang and Wang2009; Jia et al., Reference Jia, Zheng, Huang, Wu, Yang, Wang and He2010; Liu et al., Reference Liu, Chen, Maher, Zhao, Yue, Sun and Chen2018; Sun et al., Reference Sun, Li, Kuiper, Wang, Tian, Vermeesch, Zhang, Zhao and Wijbrans2018).
The formation of Three Gorges was a crucial Yangtze River drainage reorganization event. However, the entire upper Yangtze River, which extends 4504 km from the headwaters to the Three Gorges (Liu et al., Reference Liu, Wu, Manuel, Xue, Zhou, Li, Xu, Qin, Ouyang and Wu2020b), could not possibly have formed at the same time as the opening of the Three Gorges. Thus, a coherent drainage evolution pattern of the upper Yangtze River is required to describe the reorganization process of the entire upper Yangtze River.
Step-like landforms, such as planation surfaces and terraces, are well preserved in the Three Gorges region. Sediments in these landforms recorded how source areas changed through time, which also reflects the evolution history of the upper Yangtze River. Thus, we studied the heavy mineral compositions and the ages and trace element chemistry of detrital zircons collected from the lowest planation surface, two river terraces, and a modern point bar in the study area that extends from Chongqing to Fengjie to establish a chronology of source area change to acquire evidence of the westward-flowing paleo-Chuan River, constrain the formation timing of the Three Gorges, and clarify the evolution process of the Chuan River.
GEOLOGIC BACKGROUND
The study includes the area from Chongqing to Fengjie along the upper Yangtze River, from 31°3′24.5″N, 109°32′51.8″E to 29°30′37.5″N, 106°31′14.3″E. The study area is lower in the west and higher in the east, and the Sichuan and Jianghan Basins form the western and eastern boundaries, respectively. The Han River, one of the major tributaries of the Yangtze River, flows along the northern margin of the study area and empties into the Yangtze River in Wuhan city. Three planation surfaces (planation surface: a remnant surface caused by regionally different uplift after the end of planation) and five terraces can be identified in the study area. The highest planation surface is the E'xi planation surface, with elevations between 1700 and 2000 m above sea level (m asl), which cuts mainly across limestone and was the drainage divide between the main stream and major tributaries of the Yangtze River in the Three Gorges area (Shen, Reference Shen1965). The second-highest planation surface, the Shanyuan planation surface, is composed of valley and intermountain basins and uvala that are inlaid in the E'xi planation surface, with altitudes ranging from 800 to 1200 m asl. Both the E'xi and Shanyuan planation surfaces are generally believed to have formed before the Quaternary (Shen, Reference Shen1965; Tian et al., Reference Tian, Li and Luo1996). The lowest planation surface, the Yunmeng planation surface, with an elevation of approximately 600 m asl, is considered to have formed from fluvial processes during the Early Pleistocene (Tian et al., Reference Tian, Li and Luo1996; Li et al., Reference Li, Xie and Kuang2001).
There are five main terraces (e.g., T5–T1, in descending order from oldest to youngest) below the Yunmeng planation surface along the slopes of the Yangtze River Gorges. Terraces T5 and T4 are mainly pedestal terraces, whereas terraces T1–T3 are accumulation terraces (Tian et al., Reference Tian, Li and Luo1996; Xiang, Reference Xiang2004; Xiang et al., Reference Xiang, Zhu, Wang, Li and Yang2005). The detailed sedimentary characteristics of the terrace outcrops are discussed in the next section.
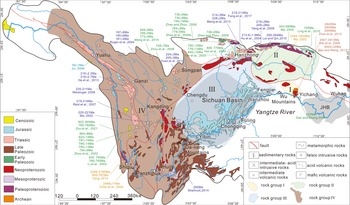
Rocks with provenance significance in the upper Yangtze River catchment are shown in Figure 2. Distinctive age distributions of exposed bedrock in four lithotectonic rock groups allow detrital zircon ages to be linked to source areas. Rock group Ⅰ is distributed in the Huangling Dome and Shennongjia terrane, which are exposed in the area of the drainage divide between the paleo-Yangtze River and paleo-Chuan River (Wang, Reference Wang1985; Zhang et al., Reference Zhang, Liu, Wang, Liu and Xue2018). In the Huangling Dome, highly metamorphosed Archean basement is the oldest rock exposed in the Yangtze Block and has yielded igneous crystallization and metamorphic zircon growth ages, apparently of 2947–2913 Ma (Qiu et al., Reference Qiu, Gao, McNaughton, Groves and Ling2000; Wei et al., Reference Wei, Wang, Wang, Shan and Guo2009; Wei and Wang, Reference Wei and Wang2012; Zhao et al., Reference Zhao, Wei and Wang2012). The Neoproterozoic Huangling granitoids yielded zircons with U-Pb ages of 837 Ma in the Huangling Dome (Gao and Zhang, Reference Gao and Zhang2009; Zhang et al., Reference Zhang, Zheng, Zhao, Wu, Yuan and Wu2009).
Sketch showing the zircon U-Pb ages and distribution of igneous rocks and metamorphic rocks in the upper Yangtze River (after Jia et al., Reference Jia, Zheng, Huang, Wu, Yang, Wang and He2010; Wang and Fan, Reference Wang and Fan2013; Huang et al., Reference Huang, Cawood, Hou, Yang, Ni, Du and Zhao2016; Li et al., Reference Li, He, Li, Lu, Fan, Sun and Huang2018). Ⅰ, Huangling Dome and Shennongjia terrane; Ⅱ, South Qinling Belt and Wudangshan terrane; Ⅲ, Sichuan Basin and adjacent region; Ⅳ, Qamdo Block, Yidun terrane, Songpan-Ganzi terrane, and Kangdian Rift. Ma, Reference Ma2002; Zhou et al., Reference Zhou, Yan, Kennedy, Li and Ding2002, Reference Zhou, Yan, Wang, Qi and Kennedy2006; Li et al., Reference Li, Li, Kinny, Wang, Zhang and Zhou2003; Yan et al., Reference Yan, Wang, Hanson, Druschke, Yan, Liu and Jian2003, Reference Yan, Hanson, Wang, Druschke, Yan, Wang and Liu2004; Chen et al., Reference Chen, Luo, Zhao, Li, Zhang and Song2004; Hu et al., Reference Hu, Cui, Meng and Zhao2004; Roger et al., Reference Roger, Malavieille, Leloup, Calassou and Xu2004; Jin, Reference Jin2006; Zhao et al., Reference Zhao, Zhao, Zuo, Li and Xue2006b, Reference Zhao, Wei and Wang2012; Reid et al., Reference Reid, Wilson, Shun, Pearson and Belousova2007; Weislogel, Reference Weislogel2008; Zhao and Zhou, Reference Zhao and Zhou2008, Reference Zhao and Zhou2009; Gao and Zhang, Reference Gao and Zhang2009; Wei et al., Reference Wei, Wang, Wang, Shan and Guo2009; Yang et al., Reference Yang, Liu, Li, Wang, Han, Wu and Zhang2009; Lai and Qin, Reference Lai and Qin2010; Ling et al., Reference Ling, Duan, Liu, Cheng, Mao, Peng, Liu, Yang and Ren2010; Yuan et al., Reference Yuan, Zhou, Sun, Zhao, Wilde, Long and Yan2010; Wei and Wang, Reference Wei and Wang2012; He et al., Reference He, Zhu, Zhong, Ren, Bai and Fan2013; Meng et al., Reference Meng, Wang, Ke, Li, Yang and Lü2013, Reference Meng, Liu, Du, Liu and Liu2015; Shellnutt, Reference Shellnutt2014; Yang, Reference Yang2014; Fang et al., Reference Fang, Zhang, Ye, Wang and Chen2017; Zou et al., Reference Zou, Li, Bagas, Wang, Chen and Li2021.

Rock group Ⅱ is distributed in the South Qinling Belt and Wudangshan terrane, which are separated from the Yangtze Block by the Mianlue suture zone and belong to the Han River catchment (Fig. 2). Neoproterozoic granite with ages of 943–689 Ma (Ma, Reference Ma2002), island arc igneous rock with ages of 295–264 Ma (Lai and Qin, Reference Lai and Qin2010), and Indosinian collisional granite with ages of 220–189 Ma (Hu et al., Reference Hu, Cui, Meng and Zhao2004; Yang et al., Reference Yang, Liu, Li, Wang, Han, Wu and Zhang2009; Meng et al., Reference Meng, Wang, Ke, Li, Yang and Lü2013; Fang et al., Reference Fang, Zhang, Ye, Wang and Chen2017) are exposed in the South Qinling Belt. Additionally, Paleoproterozoic gneiss outcrops in the South Qinling Belt have yielded zircons with U-Pb ages of 2284–1853 Ma (Ma, Reference Ma2002; Zhang et al., Reference Zhang, Zhang and Tang2002). The Neoproterozoic igneous rock in the Wudangshan terrane yielded ages that are tightly clustered at 755 Ma (Ling et al., Reference Ling, Duan, Liu, Cheng, Mao, Peng, Liu, Yang and Ren2010).
Rock group Ⅲ is distributed in the Sichuan Basin and Hannan Massif to the west of the Three Gorges and is exposed in the Chuan River catchment (Fig. 2). An abundance of Mesozoic clastic sediments is exposed in the Sichuan Basin, among which the Middle Jurassic red continental clastic rocks, the Shaximiao Formation, are widely distributed in the southern part of the Sichuan Basin. The Shaximiao Formation contains grayish-purple fine-grained quartz sandstone, arkosic sandstone, purple-red siltstone, and mudstone and reaches more than 2000 m in maximum thickness (BGMRSP, 1991). Paleoproterozoic intermediate-felsic rocks and mafic rocks are widespread in the Hannan Massif and are dated between 780 Ma and 689 Ma (Yan et al., Reference Yan, Wang, Hanson, Druschke, Yan, Liu and Jian2003, Reference Yan, Hanson, Wang, Druschke, Yan, Wang and Liu2004; Zhao et al., Reference Zhao, Zhao, Zuo, Li and Xue2006b; Zhao and Zhou, Reference Zhao and Zhou2008, Reference Zhao and Zhou2009; Wang et al., Reference Wang, Yu, Griffin and O'Reilly2012).
Rock group Ⅳ is distributed in the Qamdo Block, Yidun terrane, Songpan-Ganzi terrane, and Kangdian Rift and is exposed in the Jinsha River catchment (Fig. 2). Cenozoic intermediate to felsic igneous rocks crop out in the Qamdo Block (55–40 Ma; Jin, Reference Jin2006). The Yidun terrane consists of a flysch-volcanic succession, the Triassic Yidun Group (BGMRSP, 1991), and arc-related granitoid plutons with predominant ages of 225–202 Ma (Reid et al., Reference Reid, Wilson, Shun, Pearson and Belousova2007; Weislogel, Reference Weislogel2008; He et al., Reference He, Zhu, Zhong, Ren, Bai and Fan2013). The detrital zircon ages of the Yidun Group are characterized by major age populations of 240–220 Ma, 480–400 Ma, 1000–720 Ma, 1900–1700 Ma, and 2500–2400 Ma (Wang et al., Reference Wang, Wang, Chen, Gao, Zhao, Yan and Zhou2013a). The Paleoproterozoic metamorphic units of the Shigu Group, which are located along the Jinshajiang suture zone, are a medium- to low-grade metamorphic series and yield zircon crystallization ages of 805–767 Ma and 2298–2185 Ma (Yang, Reference Yang2014). The Songpan-Ganzi terrane is characterized by a 5- to 10-km-thick Late Triassic flysch (Zhou and Graham, Reference Zhou and Graham1996) and by the intrusion of Mesozoic granitoids with ages of 195–153 Ma and 225–205 Ma (Roger et al., Reference Roger, Malavieille, Leloup, Calassou and Xu2004; Yuan et al., Reference Yuan, Zhou, Sun, Zhao, Wilde, Long and Yan2010). Neoproterozoic mafic to felsic igneous rocks are widely exposed in the Kangdian Rift, with ages of 860–750 Ma (Zhou et al., Reference Zhou, Yan, Kennedy, Li and Ding2002; Li et al., Reference Li, Li, Kinny, Wang, Zhang and Zhou2003; Zhang, Reference Zhang2020; Zou et al., Reference Zou, Li, Bagas, Wang, Chen and Li2021). Triassic granitoids are exposed in the Kangdian Rift, with ages of 225–221 Ma (Ma, Reference Ma2002). Paleoproterozoic metamorphic complexes, which are known as the basement of the Yangtze Block, are exposed in the Kangdian Rift, with an oldest age of 2468 Ma (Chen et al., Reference Chen, Luo, Zhao, Li, Zhang and Song2004). In addition, Neoproterozoic intermediate and felsic plutonic rocks are exposed in the Longmenshan thrust belt and are dated to between 859 Ma and 699 Ma (Ma et al., Reference Ma, Wang and Hu1996; Zhou et al., Reference Zhou, Yan, Wang, Qi and Kennedy2006; Meng et al., Reference Meng, Liu, Du, Liu and Liu2015). The late Permian Emeishan Large igneous province (ELIP) on the western margin of the Yangtze Block yielded ages tightly clustered at 260 Ma (Li, Reference Li2012; Shellnutt, Reference Shellnutt2014; Huang et al., Reference Huang, Cawood, Hou, Yang, Ni, Du and Zhao2016).
OUTCROP SEDIMENTARY CHARACTERISTICS AND SAMPLE LOCATIONS
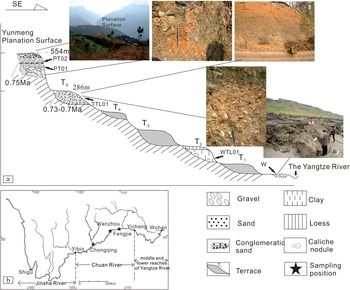
The outcrop of the Yunmeng planation surface is located in the Fengjie area (31°03′24.5″N, 109°32′51.8″E, 554 ± 7 m asl). Located below an overlying slide-related gravel layer, the fluvial deposits have the following characteristics: (1) the lower segment consists of 8- to15-cm-thick yellow-brown sandy clay, from which sample PT01 was collected (Fig. 3). (2) The middle segment consists of 1- to 3-cm-thick gray clay. (3) The upper segment consists of a 30- to 80-cm-thick gravel layer that is intercalated with brownish-red sandy clay, in which are found subspherical 1.5- to 4-cm-long pebbles composed of flint, siliceous limestone, quartz sandstone, and other components and having a preferred orientation. Sample PT02 was collected from sandy interstitial materials (Fig. 3). The electron spin resonance (ESR) age of the quartz grains from the sand interstitial material in the upper gravel layer is 0.75 Ma, which is comparable with the planation surface age of 0.8–0.75 Ma in the Yichang area (ESR age from Xiang et al. [Reference Xiang, Zhu, Wang, Li and Yang2005]).
Sampling location and profile. (a) Composite profile of fluvial sediments and sampling points. (b) Sampling location. Insets show distant prospective and profiles of the Yunmeng planation surface and terraces.

Terrace T5 of the Yangtze River is represented by an outcrop (29°30′37.5″N, 106°31′14.3″E, 286 ± 12 m asl) in the Chongqing area, which consists of a gravel layer mixed with brownish-yellow sand that is in unconformable contact with the bedrock under a fluvial swash surface. The compositions of the clasts in the ca. 10-m-thick gravel layers are quartzite and quartz sandstone along with some severely weathered granite, basalt, andesite, and porphyry. The gravels form an imbricated structure with the maximum flat surface trending to the southwest (210°–230°) (Fig. 3). The ESR age of the gravel layer is between 0.73 and 0.7 Ma (Xiang et al., Reference Xiang, Zhu, Wang, Li and Yang2005, Reference Xiang, Huang, Ogg, Zhu and Kang2020). Sample TTL01 was collected from brownish-yellow interstitial sand materials (Fig. 3).
Terrace T2 of the Yangtze River is represented by an outcrop (31°49′53.9″N, 108°26′54.7″E, 160 ± 7 m asl) in the Wanzhou area and is an accumulation terrace composed of a 15-m-thick khaki-colored sandy clay layer with caliche nodules. Sample WTL01 was collected from the lower part of the outcrop (Fig. 3). The results of the previous 14C dating of calcareous nodules and ESR dating (Tian et al., Reference Tian, Li and Luo1996; Li et al., Reference Li, Xie and Kuang2001) showed that the age of terrace T2 is between 0.05 and 0.03 Ma.
Sample W was taken from the sandy sediments in a modern point bar in the Wanzhou area (30°49′53.9″N, 108°26′54.7″E). Because suitable sampling outcrops of terraces T4, T3, and T1 were not found in our fieldwork, we constrained the earliest capture event of the upper Yangtze River using the provenance information of lowest planation surface and terrace T5, and constrained the formation age of the modern upper Yangtze River using terrace T2 and the modern point bar. Information about the sample locations is given in Supplementary Table S1.
ANALYTICAL METHODS
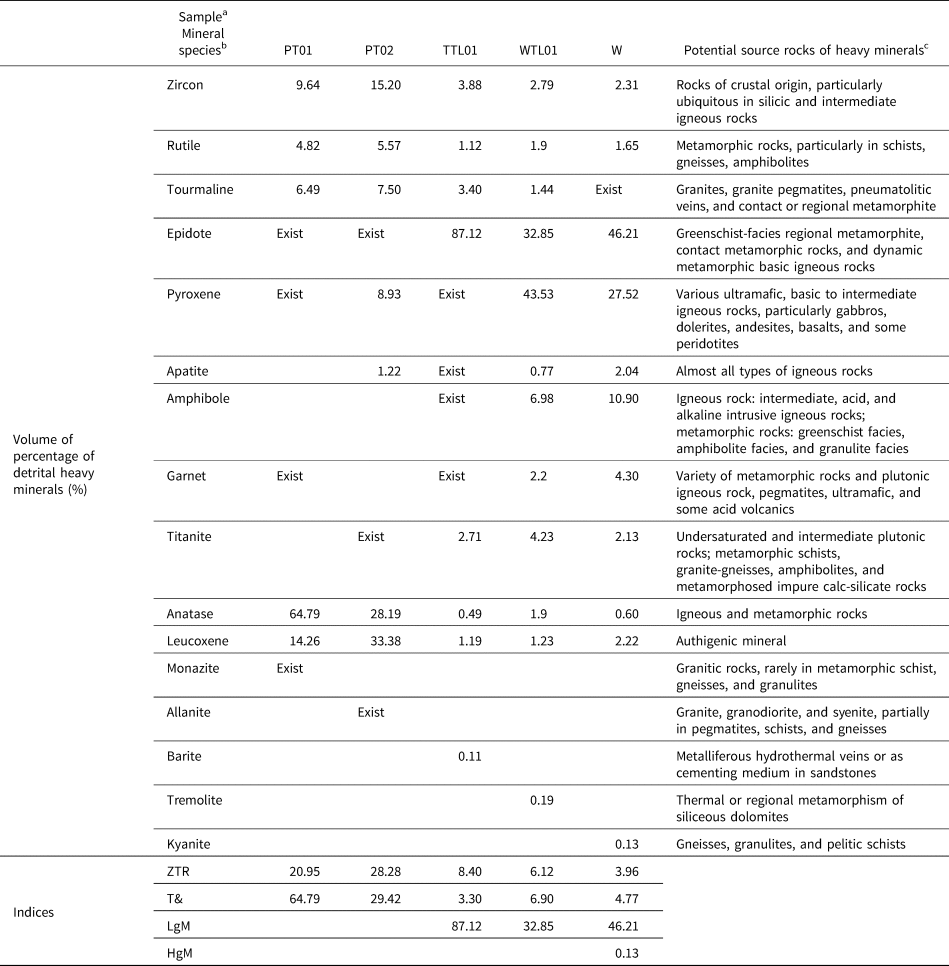
The transparent heavy minerals (see Table 1) were disaggregated and separated from sediments by standard heavy liquid methods, using the 4–2 ϕ (63–250 μm) size fraction (Thompson, Reference Thompson and Pimm1974; Garzanti et al., Reference Garzanti, Andò and Giovanni2009). For each sample, 200 points were counted in grain mounts at suitable regular spacing under the petrographic microscope to determine the relative abundance of heavy minerals (Galehouse, Reference Galehouse and Carver1971; Mange and Maurer, Reference Mange and Maurer1992). The ZTR, T&, LgM and HgM indices were calculated to quantitatively express the heavy mineral concentration in each sample. The ZTR index, reflecting the chemical durability of sedimentary rock, is the sum of volume percentages of zircon, tourmaline, and rutile over total transparent heavy minerals (Hubert, Reference Hubert1962). The T& index is the volume percentage of relatively stable heavy minerals in total transparent heavy minerals, including the titanium-containing minerals sphene, anatase, and brookite, as well as monazite, xenotime, apatite, and barite. LgM and HgM indices (LgM, including epidote, clinozoisite, zoisite, allanite, piemontite, prehnite, pumpellyite, carpholite, lawsonite chloritoid; HgM, including staurolite, andalusite, kyanite, and sillimanite) can be used to judge low- and high-grade metamorphic source rocks (Garzanti and Andò, Reference Garzanti, Andò, Mange and Wright2007a, Reference Garzanti, Andò, Mange and Wright2007b).
Statistics of transparent heavy mineral content in samples and their potential source rocks.

a “Exist” indicates the mineral was found by accident in a quantity too small to weigh.
b ZTR = total volume percentage of ultrastable minerals (zircon, tourmaline, and rutile); T& = total volume percentage of titanium minerals (sphene, anatase, and brookite) and others (e.g., apatite, monazite, and barite); LgM = total volume percentage of low-grade metamorphic minerals (e.g., epidote group, chloritoid, carpholite, and lawsonite); HgM = total volume percentage of high-metamorphic minerals (staurolite, andalusite, kyanite, and sillimanite).
c Potential provenance refers to: Marmo, Reference Marmo1971; Force, Reference Force1980; Mange and Maurer, Reference Mange and Maurer1992; Ma et al., Reference Ma, Li, Ying, Zhang, Li, Dai and Fan2019.
To avoid overlooking particles present in small amounts, all types of zircons were selected and separated from each sample by hand-picking under a binocular microscope according to their color, size, degree of roundness, and crystal morphology; cracked crystals were excluded. The systematic classification scheme of zircon morphology from Piper et al. (Reference Piper, Piper, Tubrett, Triantafyllidis and Strathdee2012) was adopted in the sample analysis process.
High-spatial-resolution U-Th-Pb data and trace element composition were analyzed on the same target spots of each zircon at the State Key Laboratory of Geological Processes and Mineral Resources, China University of Geosciences, using an Agilent HP7500a inductively coupled plasma–mass spectrometer equipped with a 213 nm laser ablation device (Geo Las 2005). Helium was used as the carrier for the ablation material. The experimental data were processed using ICPMS Data Cal software (Liu et al., Reference Liu, Hu, Gao, Günther, Xu, Gao and Chen2008, Reference Liu, Hu, Zong, Gao, Gao, Xu and Chen2010) with GJ and 91500 as external standards by applying Anderson's normal lead correction procedure (Andersen, Reference Andersen2002), and were filtered using a ±10% discordance cutoff. The 206Pb/238U ratio was used for grains with ages younger than 1000 Ma, and the 207Pb/206Pb ratio was used for grains older than 1000 Ma (Sircombe, Reference Sircombe1999; Cawood and Nemchin, Reference Cawood and Nemchin2000). The kernel density estimate (KDE) plots and multidimensional scaling (MDS) plots were obtained using Provenance, a software package within the R statistical programming environment (Vermeesch, Reference Vermeesch2012; Vermeesch et al., Reference Vermeesch, Resentini and Garzanti2016).
RESULTS
Type and content of heavy minerals
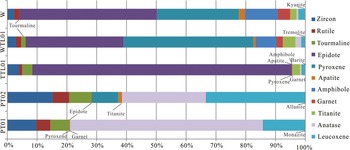
The detailed statistics on heavy minerals from every sample are shown in Table 1 and Figure 4. Notably, apatite and pyroxene exist in each sample. Because these minerals are the most prone to chemical weathering in superficial deposits (Bateman and Catt, Reference Bateman and Catt1985, Reference Bateman, Catt, Mange and Wright2007), their appearance indicates that sediments on the Yunmeng planation surface and terraces have not suffered severe subaerial weathering, so the initial provenance information of heavy minerals that are more resistant than apatite and pyroxene is trustworthy.
Heavy mineral abundances of all samples plotted as volume percentages.

Every sample contains zircon, rutile, and tourmaline, which are the most strongly resistant to both mechanical and chemical weathering. However, the amount of epidote, amphibole, garnet, titanite, anatase, and pyroxene varies in each sample. The content of apatite in samples PT02, WTL01, and W is more than that in sample TTL01, but it is zero in sample PT01. Additionally, some minerals only appear in a certain sample: monazite only appears in sample PT01, allanite only appears in sample PT02, barite only appears in sample TTL01, tremolite only appears in sample WTL01, and kyanite only appears in sample W.
ZTR and T& indices are higher than 20 in samples PT01 and PT02, but are lower than 10 in samples TTL01, WTL01, and W. The LgM index indicates that detritus from low-grade metamorphic source rocks is absent in samples PT01 and PT02, but abundant in samples TTL01, WTL01, and W. The HgM index reveals that some high-grade metamorphic rocks exposed in the Yangtze River catchment may have become the source rock for sample W.
In addition, sample WTL01 bears much resemblance to sample W in both heavy mineral species and contents, which implies lack of significant differences of source materials between these two samples. In other words, the river system underwent little change during the depositional period of terrace T2 and modern point bar; thus, sample WTL01, collected from terrace T2, was not selected for further analysis.
Morphology, zoning, and Th/U ratio of detrital zircons
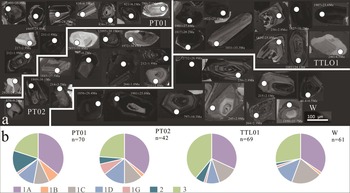
To describe the difference of each zircon assemblage in each sample, the zircon morphology and zoning classification scheme was adopted (Triantafyllidis et al., Reference Triantafyllidis, Pe-Piper, Yang and Hillier2008; Piper et al., Reference Piper, Piper, Tubrett, Triantafyllidis and Strathdee2012). Based on the sample classification scheme, type 1 zircons represent igneous first-cycle zircons, which have sharp edges and planar faces and generally contain inclusions and faces with resorption. Type 2 is identified as metamorphic zircon grains, which are ordinarily rounded to subrounded and anhedral, lack regular, parallel oscillatory zoning, and display some resorbed, pitted, or subhedral features. Type 3 contains recycled grains, which are rounded or irregular and pitted, with igneous zoning crosscut by the broken or abraded grain edge. Type 1 zircons could also be divided into five subgroups: type 1A, with complete oscillatory zoning; type 1B, with an internal corrosion surface; type 1C, containing inclusions and with zoning; type 1D, lacking inclusions but with zoning and resorbed faces; and type 1G, having almost no visible zoning but with euhedral to subhedral crystals (Piper et al., Reference Piper, Piper, Tubrett, Triantafyllidis and Strathdee2012).
The cathode luminescence (CL) images and morphologic variability in different zircon types of the four samples were systemically researched (Fig. 5). From the Yunmeng planation surface to terrace T5 and modern point bar, the abundance of types 1A, 1C, and 1D of igneous zircon is stable, but the abundance of metamorphic zircons progressively decreases. Sample PT01 from the lower segment of the Yunmeng planation surface has more metamorphic grains than sample PT02 from the upper segment. The zircon type in terrace T5 in the Fengjie area is different from that in other samples. The zircon assemblage is dominated by the igneous type 1A and type 3: 32% of type 1A and 39% of type 3.
Cathodoluminescence images (a) and relative abundance (b) of different zoning types in zircon grains from the four samples. n = number of grains.

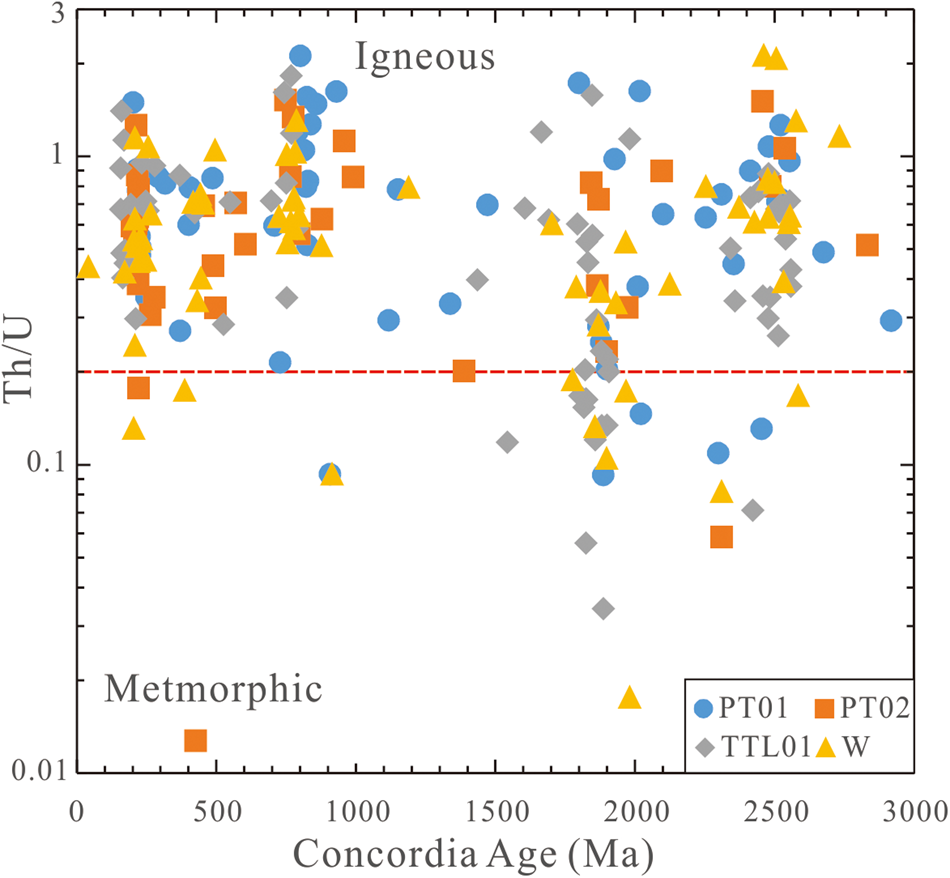
Th/U ratio as a source indicator was taken into consideration when estimating provenance of detrital zircons (Maas et al., Reference Maas, Kinny, Williams, Froude and Compston1992). Combined with CL images, the Th/U values can be used to reflect parent rock characteristics and distinguish igneous from metamorphic zircons (Schulz et al., Reference Schulz, Klemd and Braetz2006; Harley et al., Reference Harley, Kelly and Möller2007). According to the Th/U values, zircons derived from igneous rocks account for more than 87.6% of whole zircon grains in all samples analyzed (Fig. 6). Among these, igneous zircons account for 91.4% in sample PT01, 92.9% in sample PT02, 84.1% in sample TTL01, and 83.6% in sample W.
Th/U ratios plotted against concordant U-Pb ages for all analyzed detrital zircon grains from the four samples.

U-Pb age of detrital zircons
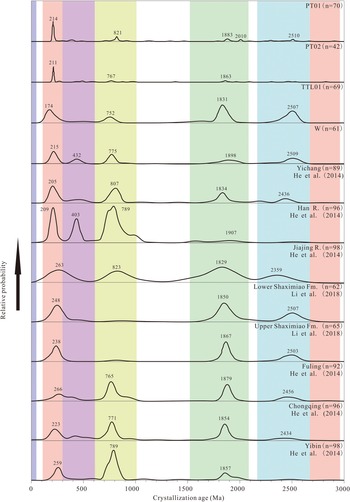
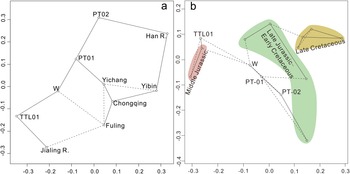
Taking into consideration the variability of large fluvial systems such as the Yangtze River, the KDE (Fig. 7) and MDS (Fig. 8a) plots are used to show the range of zircon ages in this study by comparing them with zircon U-Pb ages of channel sand from the main stream and major tributaries in the Sichuan and Jianghan Basins, as well as the Mesozoic clastic rocks in the Sichuan Basin (He et al., Reference He, Zheng, Bookhagen and Clift2014; Li et al., Reference Li, He, Li, Lu, Fan, Sun and Huang2018).The data with the greatest relevance would be closest within the MDS plot. Specific ages and concordant diagrams of all zircon grains analyzed in this work can be found in Supplementary Table S2 and Supplementary Figure S1.
Kernel density estimate (KDE) plots of the detrital zircon U-Pb ages. n = total amount of zircons in each sample. He et al., Reference He, Zheng, Bookhagen and Clift2014; Li et al., Reference Li, He, Li, Lu, Fan, Sun and Huang2018.

Multidimensional scaling (MDS) plot of the four samples’ detrital zircon data as well as the Middle Jurassic to Late Cretaceous detrital zircon data, generated using methods outlined by Vermeesch et al. (Reference Vermeesch, Resentini and Garzanti2016). Solid and dashed lines mark the nearest and the second nearest neighbors, respectively. Age data of the Mesozoic clastic rocks in southern Sichuan Basin are from Li et al. (Reference Li, He, Li, Lu, Fan, Sun and Huang2018); strata with different ages are highlighted by different colors.

The zircon age spectra of samples PT01 and PT02, collected from the Yunmeng planation surface, show certain similarity with channel sand from the main stream of the Yangtze River in Yichang and the Han River, in that the abundance of the Mesozoic (300–100 Ma) and Neoproterozoic (1000–600 Ma) zircon grains is greater than those of the Paleo-Mesoproterozoic (2100–1500 Ma) and Paleoproterozoic (2600–2200 Ma; Figs. 7 and 8a). The sediments from the Yunmeng planation surface also contain several Archean zircon grains (older than 2600 Ma).
The zircon populations of sample TTL01, collected from terrace T5, show a significant similarity with that of the Jialing River (Fig. 8a) with respect to the abundance of Mesozoic, Neoproterozoic, Paleo-Mesoproterozoic, and Paleoproterozoic zircon grains.
Sample W shows a multisource with a number of distinctive zircon populations, such as Paleozoic zircon grains (600–300 Ma) and a single Paleogene grain (40 Ma), similar to main stream channel sand of the Yangtze River in the Fuling area (Figs. 7 and 8a).
Trace element character of detrital zircons
The contents of trace elements of detrital zircons from four samples are shown in Supplementary Table S3. The geochemical composition of zircons shows an overall decrease in U, Gd, and Ce content from samples PT-01 and PT-02 (62.3–2155.3, 3–322, and 1–173ppm, respectively) to samples TTL01 and W (34–1505, 2–96, and 0–83 ppm, respectively). Their Yb contents range from 6 to 1554 ppm in four samples.
DISCUSSION
Implications of zircon geochemistry
The geochemistry of zircons is a sensitive indicator of their parental magma compositions and accessory minerals. Thus, the identification of accessory minerals by elemental information from a single crystal offers a powerful approach to determine the provenance (Grimes et al., Reference Grimes, Wooden, Cheadle and John2015).
The zircon's affinity for U, Yb, and other heavy earth elements (HREEs) permits these elements to be incorporated into zircon crystals so that the U/Yb ratio of zircon will reflect that of the parental melt when it crystallized. Differences in the U/Yb ratio value can be used to discriminate between ocean crust zircon and continental zircon (Grimes et al., Reference Grimes, John, Kelemen, Mazdab, Wooden, Cheadle and Hanghøj2007). A U/Yb ratio <0.1 is generally characteristic of zircons from the normal mid-ocean ridge basalt and other similar mantle sources. Continental arc zircon has U/Yb mostly between 0.1 and 4, and Grimes et al. (Reference Grimes, Wooden, Cheadle and John2015) attributed this higher value to greater influence from mature, large-ion lithophile–enriched crust during formation of the parental melts. Meanwhile, accessory minerals have an obvious effect on the trace elemental ratios in zircon (Kirkland et al., Reference Kirkland, Smithies, Taylor, Evans and McDonald2015), so this influence should be taken into consideration when fingerprinting a zircon source.
When crystallized, a previously formed zircon has a lower U/Yb ratio than a later-formed zircon. The relatively high concentration of HREE in titanite and apatite also results in increased U/Yb in the melt (Grimes et al., Reference Grimes, Wooden, Cheadle and John2015), and element fractionation in zircon with apatite will increase Nb/Yb of the melt with increasing U/Yb, and these influence for melt would be recorded in later-formed zircons. Crystallization of titanite or ilmenite will decrease Nb/Yb but increase U/Yb of zircon (Grimes et al., Reference Grimes, Wooden, Cheadle and John2015; Figs. 9 and 10). Higher Gd/Yb is a good proxy for enrichment of middle REE relative to heavy REE, and a higher value is an indicator of garnet growth with or before growth of magmatic or metamorphic zircon (Grimes et al., Reference Grimes, Wooden, Cheadle and John2015). A higher Ce/Yb ratio of zircon reflects the enrichment of light REE relative to heavy REE. Because titanite (with apatite) and monazite preferentially incorporate light and middle rare earth elements from the melt, rather than heavy rare earth elements, their presence will result in a decrease in Gd/Yb and Ce/Yb ratios in co-crystallizing zircon. Compared with the Gd/Yb and Ce/Yb ratios in most of the mid-ocean ridge suite, the decrease in Gd/Yb ratio and increase in Ce/Yb ratio of zircon can be ascribed to the influence of melt cooling and zircon crystallization (Bea, Reference Bea1996; Grimes et al., Reference Grimes, Wooden, Cheadle and John2015; Figs. 9 and 10).
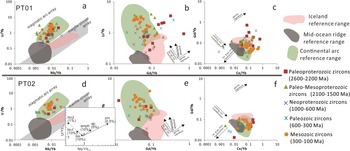
Petrogenetic interpretation diagram of zircons in samples PT01 and PT02. Mid-ocean ridge basalt data are from Lehnert et al. (Reference Lehnert, Su, Langmuir, Sarbas and Nohl2000). Iceland lava composition is from Carley et al. (Reference Carley, Miller, Wooden, Bindeman and Barth2011, Reference Carley, Miller, Wooden, Padilla, Schmitt, Economos, Bindeman and Jordan2014). The continental arc lava data are from Carley et al. (Reference Carley, Miller, Wooden, Padilla, Schmitt, Economos, Bindeman and Jordan2014). The upper boundaries in a and d are placed at the Nb/Yb (0.004, 0.02) and U/Yb endpoints (1, 10). The inset in d shows the effect of open-system (Rayleigh) fractionation of select minerals on U/Yb and Nb/Yb ratios of the remaining melt (and later-formed zircons) relative to initial ratios = 1. Vectors are shown to scale for the extent of fractional removal (of that mineral only) indicated by the percentages listed. The distribution coefficients used are from Grimes et al. (Reference Grimes, Wooden, Cheadle and John2015). amph, amphibole; ap, apatite; ilm, ilmenite; mnz, monazite; ttn, titanite; zrn, zircon.

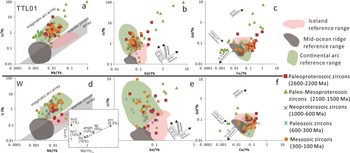
Petrogenetic interpretation diagram of zircons in samples TTL01 and W. amph, amphibole; ap, apatite; ilm, ilmenite; mnz, monazite; ttn, titanite; zrn, zircon.

All zircon grains analyzed show high U/Yb ratios (>0.1) and are determined to be from continental settings (Grimes et al., Reference Grimes, John, Kelemen, Mazdab, Wooden, Cheadle and Hanghøj2007, Reference Grimes, Wooden, Cheadle and John2015). The Archean zircon populations in samples PT01 and PT02 and Paleogene grains in sample W have only single grains without a fractionation trend and are not included here. On the Yunmeng planation surface (samples PT01 and PT02), the Paleoproterozoic zircon population has relatively increasing and decreasing Gd/Yb ratios along with increasing U/Yb ratio and is inferred to have formed with accessory garnet and titanite. The Paleo-Mesoproterozoic zircon grains have relatively low Gd/Yb and Ce/Yb ratios and exhibit the characteristics of co-crystallization with titanite (with apatite). The Neoproterozoic and Mesozoic populations have increasing Nb/Yb ratios along with increasing U/Yb ratios relative to the continental arc reference range, resulting in the trajectory shown in Figure 9a, which would be approximately parallel to the mantle-zircon array, implying the enrichment of zircons. The Paleozoic zircon grains have increasing and decreasing Ce/Yb ratios along with decreasing Gd/Yb ratios, as shown in Figure 9c and f, which indicates the influence of titanite, monazite, and zircon crystallization.
In sample TTL01, which was collected from terrace T5, the Paleoproterozoic zircons show two trajectories of increasing Gd/Yb ratios along with the U/Yb ratios and constant Gd/Yb ratios with increasing U/Yb ratios, as shown in Figure 10b, which indicate garnet-abundant and amphibole-abundant fractionation trends, respectively. The Paleo-Mesoproterozoic zircon grains show two trajectories that are subparallel and orthogonal to the mantle-zircon array, as shown in Figure 10a, and indicate two fractionation trends of garnet and titanite (with apatite), as shown in Figure 10b and c. The Neoproterozoic zircons are skewed at a high angle to the mantle-zircon array, as shown in Figure 10a, and exhibit constant Gd/Yb ratios and increasing U/Yb ratios, as shown in Figure 10b, which indicate the fractionation trend of accessory amphibole. The Paleozoic zircon grains have a trajectory that is orthogonal to the mantle-zircon array, as shown in Figure 10a, and decreasing Gd/Yb ratios with increasing U/Yb ratios, as shown in Figure 10b, while the Mesozoic zircon grains exhibit decreasing Gd/Yb ratios along with decreasing Ce/Yb ratios, as shown in Figure 10c, all of which show the influence of titanite co-crystallization.
In sample W, which was collected from the modern point bar, the Paleoproterozoic, Neoproterozoic, and Paleozoic zircon populations are orthogonal and skewed with low angles to the mantle-zircon array, as shown in Figure 10d, and show two fractionation trends in which the Gd/Yb ratios remain stable and decrease with increasing U/Yb ratios, as shown in Figure 10e, which indicate the presence of titanite, apatite, and amphibolite during the crystallization process. The Paleo-Mesoproterozoic zircons show two trends in which the Gd/Yb ratios decrease or increase with increasing U/Yb ratios (Fig. 10e), which implies the influence of titanite, apatite, and garnet crystallization. The Mesozoic zircons are subparallel to the mantle-zircon array, as shown in Figure 10d, and exhibit a trend for which the U/Yb and Ce/Yb ratios increase with decreasing Gd/Yb ratios, as shown in Figure 10e and f, which could be influenced by prior zircon crystallization.
In general, the zircon populations on the Yunmeng planation surface exhibit the geochemical characteristics of co-crystallizing with felsic igneous minerals such as zircon and monazite, whereas the zircons in the terrace and modern point bar crystallized with mafic igneous minerals, such as amphibole. This distinction can also be found in the provenances indicated by heavy mineral composition.
Provenance evidence from heavy minerals and detrital zircons in sediments
Provenance of sediments on the Yunmeng planation surface
The relatively high ZTR and T& indices in samples PT01 and PT02 indicate chemical durability. The Archean, Paleoproterozoic, and Paleo-Mesoproterozoic zircon populations from the Yunmeng planation surface show rounded to subrounded morphologies with absent or indistinct oscillatory zoning under CL, belonging mainly to type 2 zircons. The zircon trace element characteristics indicate the Archean, Paleoproterozoic, and Paleo-Mesoproterozoic zircon populations co-crystallized with titanite and garnet. In fact, Archean rock in the Yangtze River catchment is exposed only in the Huangling Dome of rock group Ⅰ (Wang and Fan, Reference Wang and Fan2013; Fig. 2), which underwent multistage magmatic (3000–2900 Ma, 2700–2600 Ma, and 1870–1850 Ma) and metamorphic events (2600–2500 Ma and 2050–1900 Ma). The Archean rock yielded abundant titanites, garnets and zircons with type 2 morphology (Zhao et al., Reference Zhao, Zhao, Zuo and Li2006a; Wei et al., Reference Wei, Wei, Wang and Wang2020). Thus, the Archean, Paleoproterozoic, and Paleo-Mesoproterozoic zircon populations from the Yunmeng planation surface can only be derived from rock group Ⅰ. Meanwhile, this also indicates the existence of a paleoriver flowing from the Huangling Dome to the Fengjie area that deposited sediments on the Yunmeng planation surface.
The Neoproterozoic zircon grains are observed to have prismatic and short prismatic shapes with complete oscillatory zoning and inclusions, with features of types 1A and 1C. The trace elements of the Neoproterozoic zircon group show characteristics of co-crystallization of zircon and monazite, indicating these zircons were derived from felsic rock. The Huangling granitoids in rock group Ⅰ were intruded into the Huangling Dome in the Neoproterozoic. The Huangling granitoids yielded abundant tremolites, monazites, and zircons, among which zircon grains show short prismatic shapes with oscillatory zoning and a peak age of 837 Ma and partial zircon grains contained inclusions (Ma, Reference Ma2002; Gao and Zhang, Reference Gao and Zhang2009). Thus, the Huangling granitoids in rock group Ⅰ are most likely source rocks of tremolites, monazites, and the Neoproterozoic zircon grains.
Mesozoic zircons with the trace element characteristics of felsic igneous zircons display complete oscillatory zoning and long and prismatic shapes, belonging mainly to type 1A. However, few Triassic rocks are exposed around the study area, except for rock group Ⅱ to the north of the study area (Fig. 2). The Triassic granites in rock group Ⅱ yielded plenty of zircons with an age range of 219–213 Ma and type 1 A, 1C, and 1D morphologies (Hu et al., Reference Hu, Cui, Meng and Zhao2004; Yang et al., Reference Yang, Liu, Li, Wang, Han, Wu and Zhang2009; Meng et al., Reference Meng, Wang, Ke, Li, Yang and Lü2013; Fang et al., Reference Fang, Zhang, Ye, Wang and Chen2017). Thus, we believe that the high density of Mesozoic zircons is likely the input result of rock group Ⅱ to the north of the study area, which is also supported by the similarity of sediments from the Yunmeng planation surface to the channel sand of the Han River (Fig. 8a).
Provenance of sediments in terrace T5
The heavy mineral assemblage in sample TTL01 is dominated by epidotes with a high LgM index and contains a few barites and garnets. The Paleoproterozoic and Paleo-Mesoproterozoic zircon populations are dominated by recycled grains with type 3 morphology (rounded or irregular shapes, broken or abraded grain edge, and weak and dark oscillatory zoning). All of these features indicate the provenance characteristics of clastic sediments in the tectonic setting of an “undissected Craton subprovenance” (Garzanti and Andò, Reference Garzanti, Andò, Mange and Wright2007b). Considering the similarity of the zircon age spectra of terrace T5 and the Jialing River (Fig. 7) and the large volumes of Mesozoic clastic rocks in the Sichuan Basin of rock group Ⅲ, we assessed the contribution of Mesozoic clastic rocks in the Sichuan Basin to the sediments in terrace T5. The detrital zircon age data from all samples and the available published Middle Jurassic to Late Cretaceous sediments plot in the MDS plot (Vermeesch et al., Reference Vermeesch, Resentini and Garzanti2016; Fig. 8b).
Sample TTL01 shows significant affinity with the Middle Jurassic Shaximiao Formation of rock group Ⅲ located in the southern Sichuan Basin as a potential sediment source (Figs. 2 and 8b), but without affinity to Late Jurassic or Cretaceous sedimentary rocks. Despite the affinity of the zircon age distributions between sample TTL01 and the Middle Jurassic Shaximiao Formation, the lack of a Neoproterozoic zircon population in the Shaximiao Formation and the difference in peak age values of the Mesozoic zircon population in sample TTL01 (174 Ma), the Shaximiao Formation (248 and 238 Ma; Li et al., Reference Li, He, Li, Lu, Fan, Sun and Huang2018), and the Jialing River channel sand (263 Ma; He et al., Reference He, Zheng, Bookhagen and Clift2014) suggest the existence of additional Neoproterozoic and Mesozoic sources for the sediments of terrace T5. Numerous felsic-intermediate and mafic intrusions occur in the Hannan Massif of rock group Ⅲ. These intrusions yield abundant amphiboles and zircons, from which zircons with crystallization ages of 780–689 Ma are euhedral and oscillatory zoned, tallying with type 1A morphology (Zhao et al., Reference Zhao, Zhao, Zuo, Li and Xue2006b; Zhao and Zhou, Reference Zhao and Zhou2008, Reference Zhao and Zhou2009). The Neoproterozoic zircons (789–696 Ma) in sample TTL01 are euhedral prismatic shapes with complete oscillatory zoning, and some grains have inclusions, belonging mainly to type 1A and 1C morphologies. Zircon trace elements instruct that these zircons crystallized concurrently with amphibole. Thus, amphiboles and the Neoproterozoic zircons appear to be derived from the Hannan Massif of rock group Ⅲ.
The Mesozoic zircon population with a peak age of 174 Ma has long and short prismatic shapes with complete oscillatory zoning, belonging to the morphologic features of types 1A and 1C. These zircons show the zircon trace element characteristic of co-crystallization with titanite. Many granitic plutons in the Songpan-Ganzi terrane of rock group Ⅳ were considered to be Mesozoic intrusions, which yielded abundant zircon, titanite, and apatite (Roger et al., Reference Roger, Malavieille, Leloup, Calassou and Xu2004; Fig. 2). These zircons yielded from granitic plutons show long prismatic and columnar shapes and complete but relatively dark oscillatory zoning with a peak age of 181 Ma and are influenced by co-crystallization with titanite (Roger et al., Reference Roger, Malavieille, Leloup, Calassou and Xu2004; Wu et al., Reference Wu, Ji, Cao, Dong and Chen2021). Thus, titanite, apatite, and the Mesozoic zircons in sample TTL01 were likely transported from granitic plutons in the Songpan-Ganzi terrane of rock group Ⅳ by drainage in the western Sichuan Basin, such as the Min River.
Provenance of sediments in the modern point bar
Considering that Cenozoic rocks are exposed only in the Qamdo Block of rock group Ⅳ in the Yangtze River catchment (Fig. 2), the only Paleogene zircon from the modern point bar was surely derived from there. The Mesozoic zircons with a peak age of 215 Ma, are fine, long, and prismatic and have complete oscillatory zoning; grains belonging to types 1A, 1C, and 1D have inclusions and resorbed faces. The Mesozoic zircons are identified as felsic igneous zircons according to the trace element characteristics (Fig. 10d). The granitoid plutons of the Yidun terrane of rock group Ⅳ yielded a number of zircons with an age range of 245–216 Ma and type 1A and 1D morphologies (Reid et al., Reference Reid, Wilson, Shun, Pearson and Belousova2007; Fig. 2). The Mesozoic zircons were likely derived from the granitoid plutons of the Yidun terrane.
The Paleozoic zircon population shows complete oscillatory zoning, and some granules have inclusions and rounded shapes with morphologic features of types 1A, 1C, and 3. However, early Paleozoic strata are exposed in the Qinling orogeny and the Cathaysia Block (Dong et al., Reference Dong, Zhang, Hauzenberger, Neubauer, Yang and Liu2011, Reference Dong, Liu, Neubauer, Zhang, Tao, Zhang, Zhang and Li2013; Wang and Fan, Reference Wang and Fan2013; Zhang et al., Reference Zhang, Guo, Wang, Li, Dong, Liu and He2013), and it was not possible for these to be deposited in the study area. The Yidun Group of the Yidun terrane in rock group Ⅳ with a detrital age population of 480–400 Ma was most likely the source of these Paleozoic zircons (Wang et al., Reference Wang, Wang, Chen, Gao, Zhao, Yan and Zhou2013a).
The Neoproterozoic zircons have oscillatory zoning. The majority of these grains have inclusions and partly irregular shapes, suggesting type 1C, 1A, and 3 morphologies, with a peak age of 775 Ma; trace elements indicate their co-crystallization with titanite, apatite, and amphibole. The Shigu Group yielded abundant titanites and zircons, with zircons having broken prismatic shapes with oscillatory zoning and a weighting average age of 805±18 Ma (Yang, Reference Yang2014). The Neoproterozoic rocks of the Longmenshan thrust belt contain plenty of amphibole and apatite. Zircons in these Neoproterozoic rocks have short prismatic shapes with complete oscillatory zoning and have age peaks at 740 Ma, 748 Ma, and 770 Ma (Ma et al., Reference Ma, Wang and Hu1996; Zhou et al., Reference Zhou, Yan, Wang, Qi and Kennedy2006; Meng et al., Reference Meng, Liu, Du, Liu and Liu2015; Zou et al., Reference Zou, Bagas, Li, Liu, Jiang and Li2020). The Neoproterozoic granites in the Kangdian Rift yielded abundant zircons with an age range of 773–721 Ma, short prismatic shapes, and oscillatory zoning with inclusions (Zhou et al., Reference Zhou, Yan, Kennedy, Li and Ding2002; Chen et al., Reference Chen, Luo, Zhao, Li, Zhang and Song2004). Thus, titanite, apatite, amphibole, and Neoproterozoic zircons in sample W were possibly derived from these Neoproterozoic rocks in rock group Ⅳ.
The Paleo-Mesoproterozoic zircons show co-crystallization characteristic with titanite, apatite, and garnet under the instruction of zircon trace elements and have complete oscillatory zoning and equiaxed, short prismatic, or partially rounded–subrounded shapes similar to the morphologic features of types 1A and 3. There is garnet–mica schist in the southern Huili area, which yielded zircons with ages of 2026–1825 Ma, and garnet grains, among which zircons are short prismatic and oscillatory zoned with partially resorbed faces (Guan et al., Reference Guan, Zheng, Liu, Sun and Cheng2011). In addition, the Yidun Group is also characterized by detrital zircon ages of 1900–1700 Ma (Wang et al., Reference Wang, Wang, Chen, Gao, Zhao, Yan and Zhou2013a). These titanite, apatite, garnet, and Paleo-Mesoproterozoic zircon grains were likely derived from schist in Huili area and rocks in the Yidun Group.
The Paleoproterozoic zircons show short prismatic, broken, irregular shapes with oscillatory zoning, and some grains have inclusions belonging to type 1A, 1C, and 3 morphologies. The trace element characteristic of the Paleoproterozoic zircon population indicates influence of co-crystallization with titanite, apatite, and amphibole. However, the oldest zircons on the western margin of the Yangtze Block consist of the metamorphic zircons of the Shigu Group (2298–2185 Ma; Yang, Reference Yang2014), detrital zircons of the Yidun Group (2500–2400 Ma; Wang et al., Reference Wang, Wang, Chen, Gao, Zhao, Yan and Zhou2013a) and zircons in the Paleoproterozoic rocks of the Kangdian Rift in rock group Ⅳ (Ma, Reference Ma2002). Therefore, titanite, apatite, amphibole, and the Paleoproterozoic zircon grains were possibly derived from these rocks.
In addition, the heavy mineral composition of sample W contains abundant pyroxene and amphibole and is associated with the widespread late Permian ELIP of rock group Ⅳ. However, the mantle sources of the ELIP yield low- zircon abundances, which result in the lack of correlative zircon records in sample W (Li, Reference Li2012; Shellnutt, Reference Shellnutt2014).
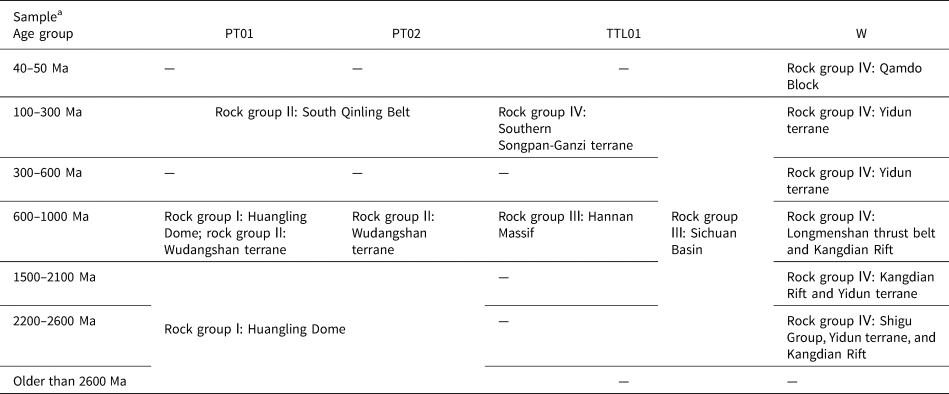
The potential sources of all zircon samples are shown in Table 2.
Potential sources of every age group in four samples.

a A dash (—) indicates that there is no source information for this age group in samples.
Evolution of the upper Yangtze River
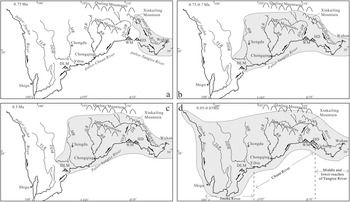
Wang (Reference Wang1985) and Zhang et al. (Reference Zhang, Liu, Wang, Liu and Xue2018) proposed that the paleo-Yangtze River system consisted of three segments before they were connected into one large river. The first segment, the paleo-Jinsha River, extended from the headwaters to Shigu and flowed southward (Fig. 11). The second segment, the paleo-Chuan River, flowed westward from the Huangling Dome to Shigu and then turned southward to the paleo-Red River (Clift et al., Reference Clift, Blusztajn and Nguyen2006, Reference Clift, Long, Hinton, Ellam, Hannigan, Tan, Blusztajn and Duc2008; Zheng, Reference Zheng2015; Gourbet et al., Reference Gourbet, Leloup, Paquette, Sorrel, Maheo, Wang and Xu2017; Fig. 1b). The third segment, called the paleo-Yangtze River, extended from the Huangling Dome to the East China Sea and flowed eastward.
The evolution model for the upper Yangtze River. (a) The Huangling Dome was the drainage divide between the paleo-Yangtze River and the paleo-Chuan River at 0.75 Ma. (b) The paleo-Yangtze River captured the paleo-Chuan River, and the drainage divide retreated to the Daliang Mountains at 0.73–0.7 Ma. (c) The Daning–Du River was divided into two rivers, and the modern Han River formed at 0.5 Ma. (d) The modern Yangtze River formed before 0.05 Ma. BR, Ba River; DDR, Dadu River; DLM, Daliang Mountains; DN-DR, Daning–Du River; HD, Huangling Dome; JLR, Jialing River; MR, Min River; WM, Wu Mountain; YLR, Yalong River.

Among the sediments, the clast compositions of the gravel layer on the Yunmeng planation surface consist mainly of quartzite, flint, siliceous limestone, and sandstone, but those in terrace T5 consist of basalt, andesite, and porphyry. Combined with the characteristics of the heavy mineral assemblages and zircon trace elements, the sediments on the surface of the Yunmeng planation are derived from felsic rocks of rock groups Ⅰ and Ⅱ (Fig. 2). However, the sediments in terrace T5 are derived from the sedimentary and mafic rocks of rock groups Ⅲ and Ⅳ (Fig. 2). The pronounced distinction between the source rocks of the Yunmeng planation surface and those of terrace T5 supports the occurrence of a large-scale drainage reversal in the Three Gorges area when the Yunmeng planation surface disintegrated and sediments began to be deposited on terrace T5. The ESR ages of the sediments on the Yunmeng planation surface and terrace T5 are ca. 0.75 Ma and 0.73–0.7 Ma, respectively (Xiang et al., Reference Xiang, Zhu, Wang, Li and Yang2005, Reference Xiang, Huang, Ogg, Zhu and Kang2020), so we believe that the paleo-Chuan River flowed westward before 0.75 Ma and reversed to flow eastward between 0.75 Ma and 0.73 Ma (Fig. 11a and b). At the same time, the reversal time of the paleo-Chuan River should coincide with the opening time of the Three Gorges, and this reversal process is thought to be the result of the paleo-Chuan River being captured by the paleo-Yangtze River (Tian et al., Reference Tian, Li and Luo1996; Clark et al., Reference Clark, Schoenbohm, Royden, Whipple, Burchfiel, Zhang and Tang2004)
The potential eastern provenance of the Yunmeng planation surface is the Huangling Dome, which implies that the drainage divide between the paleo-Chuan River and paleo-Yangtze River was located in the Huangling Dome at that time (Fig. 11a). There are abundant clasts from rock group Ⅱ on the Yunmeng planation surface that could not have been deposited in the Fengjie area by the paleo-Han River with a modern drainage shape. An ancient river channel in the Huangling Dome area should have existed to connect the South Qinling Belt area with the Fengjie area when these clasts were being deposited (i.e., 0.75 Ma). In the eastern Daba Mountains area, the valleys of the Daning and Du Rivers, as tributaries of the Yangtze River and Han River, respectively, are now separated by a drainage divide in the Daba Mountains area that is located to the west of the Huangling Dome (Fig. 11d). It is possible that the Daning and Du Rivers are remnants of the paleoriver channel that connected the South Qinling Belt and Fengjie area. The paleoriver channel divided into the Daning River and Du River as a result of Cenozoic tectonic activity and episodic uplift that started at 0.5 Ma in the Daba Mountains area (Fu et al., Reference Fu, Kan, Xiao, Hu, Xiang, Zhang and Li2014; Zhang et al., Reference Zhang, Li, Liu, Zhu, Zhu, Wang and Zhao2014; Fig. 11b and c).
The sediments in terrace T5 are mainly derived from rock group Ⅲ, which indicates that the paleo-Yangtze River captured the Jialing River. Most of sediments in terrace T5 are from the Shaximiao Formation in the Sichuan Basin of rock group Ⅲ, the proportion of which is even higher than in the modern point bar. This is possibly because the formation of the Three Gorges would lower the base level of erosion in the Sichuan Basin and further intensify regional denudation and would also simultaneously provide an outlet for erosional detritus (Richardson et al., Reference Richardson, Densmore, Seward, Wipf and Li2010). Thus, the erosional detritus that is widely distributed in the southern Sichuan Basin was deposited near the Yangtze River valley in the Chongqing area when sediments were deposited in terrace T5. Meanwhile, the scarcity of mafic igneous minerals such as pyroxene indicates that the detritus from the main body of the ELIP of rock group Ⅳ was not carried into the paleo-Yangtze River catchment at that time. These rocks are widespread in the western Yibin region (Fig. 2). Thus, the drainage divide between the paleo-Yangtze River and paleo-Chuan River would migrate to the Daliang Mountains in western Yibin (Fig. 11b). The sediments in the modern point bar are derived from the Shigu Group, Yidun terrane, Kangdian Rift, and Qamdo Block of rock group Ⅳ and indicate the formation of the modern Yangtze River. Despite the lack of zircon age data in terrace T2 in the Wanzhou area, the heavy mineral assemblage of sample WTL01 is similar to that in the modern point bar, with abundant mafic igneous minerals such as amphiboles and pyroxenes, especially tremolites from the Shigu Group of rock group Ⅳ. Therefore, the modern Yangtze River should date back to a time before sediments were deposited in terrace T2 (0.05–0.03 Ma; Fig. 11d).
Accordingly, we propose the following evolution model for the Chuan River: at 0.75 Ma, the drainage divide between the paleo-Yangtze River and paleo-Chuan River was located in the Huangling Dome. At 0.75–0.73 Ma, the Three Gorges was cut through, the paleo-Chuan River was captured by the paleo-Yangtze River, and the drainage had migrated to the Daliang Mountains. At 0.7–0.05 Ma, the paleo-Yangtze River captured the paleo-Jinsha River, and a uniform large river system—the Yangtze River—formed.
Cenozoic regional uplift and the evolution of the upper Yangtze River
Fluvial incision can be a response to tectonic activity, climate change, and sea-level fluctuation (Hartshorn et al., Reference Hartshorn, Hovius, Dade and Slingerland2002; Pratt et al., Reference Pratt, Burbank, Heimsath and Ojha2002; Dortch et al., Reference Dortch, Owen, Caffee and Kamp2011b). However, due to the long distance from the study area to shore, the influence of sea level might be negligible. On long-term (104–105 years) timescales, fluvial incision rates always maintain consistency with rates of surface uplift in a tectonically active region (Hartshorn et al., Reference Hartshorn, Hovius, Dade and Slingerland2002; Dortch et al., Reference Dortch, Dietsch, Owen, Caffee and Ruppert2011a). Thus, the reconstruction of the Yangtze River caused by river system capture in the Pleistocene can be associated with stepwise Cenozoic uplift of the SE margin of the Tibetan Plateau.
Since India collided with Asia (~55 Ma), the rise of the Tibetan Plateau tandem with north-south shortening and east-west extension has affected on the surrounding regions, especially the southeast margin of the Tibetan Plateau (Tapponnier et al., Reference Tapponnier, Xu, Roger, Meyer, Arnaud, Wittlinger and Yang2001; Zhang et al., Reference Zhang, Shen, Wang, Gan, Burgmann and Molnar2004). Under the influence of the east-west extension and eastward extrusion of Tibet (Schellart et al., Reference Schellart, Chen, Strak, Duarte and Rosas2019), the eastward compression stress was resisted by the stable Yangtze Block on the eastern side of the Tibetan Plateau (Clark and Royden, Reference Clark and Royden2000) and resulted in the formation of several large-scale sinistral strike-slip active fault zones (Wang et al., Reference Wang, Burchfiel, Royden, Chen, Chen, Li and Chen1998a, Reference Wang, Lo, Lee, Chung, Lan and Yen1998b, Reference Wang, Lo, Chung, Lee, Lan and Thang2000; Wang and Burchfiel, Reference Wang and Burchfiel2000; Leloup et al., Reference Leloup, Arnaud, Lacassin, Kienast, Harrison, Phan Trong, Replumaz and Tapponnier2001; Tapponnier et al., Reference Tapponnier, Xu, Roger, Meyer, Arnaud, Wittlinger and Yang2001; Burchfiel and Wang, Reference Burchfiel and Wang2003; Li et al., Reference Li, Sun and Zhang2022). Thus, under such a tectonic stress background, the plateau margin of NW Yunnan had achieved its present elevation (2.6–3.3 km) as early as the late Eocene (~40 Ma) as a result of the movement of rigid crustal blocks along large strike-slip faults (Hoke et al., Reference Hoke, Jing, Hren, Wissink and Garzione2014; Li et al., Reference Li, Currie, Rowley and Ingalls2015; Wu et al., Reference Wu, Zhang, Xu, Wang, Garzione, Eiler, Leloup, Sorrel and Mahéo2018). However, the tectonic model of NE Yunnan and western Sichuan is different. Liu et al. (Reference Liu, Hilst, Li, Yao, Chen, Guo, Qi, Wang, Huang and Li2014) identified zones of viscous crustal rocks in the deep crust that thicken eastward toward the Yangtze Block by clearly imaging the structure of the eastern Tibetan Plateau using about 300 seismographs; these were interpreted as crustal flow channels. Driven by the eastward flow of viscous rock in the deep crust since the late Miocene (beginning before ~14 Ma; Coleman and Hodges, Reference Coleman and Hodges1995; Zhang et al., Reference Zhang, Shen, Wang, Gan, Burgmann and Molnar2004; Royden et al., Reference Royden, Burchfiel and Hilst2008; Zhang and Li, Reference Zhang and Li2016), a rapid surface uplift of the western Sichuan began at ca. 13 Ma (Clark et al., Reference Clark, House, Royden, Whipple, Burchfiel, Zhang and Tang2005), and NE Yunnan reached its present elevation (~1.6 km) by the same time (Li et al., Reference Li, Currie, Rowley and Ingalls2015; Wang et al., Reference Wang, Zhang, Schoenbohm, Zhang, Zhou, Hou and Ai2016). Meanwhile, the farther eastern plateau margin of Guizhou had attained elevations comparable to today before the late Pliocene (Liu et al., Reference Liu, Wang, Xu, Fabel, Stuart and Rodés2022b), also possibly driven by the lower crustal flow.
Based on this plateau deformation pattern, if the viscous crust rocks in the deep crust had flowed further eastward, the compression stress originating from eastward expansion of the plateau through the Sichuan Basin, which is a mechanically strong unit (Liu, Reference Liu2006; Royden et al., Reference Royden, Burchfiel and Hilst2008; Xiang et al., Reference Xiang, Li, Wang, Zhu and Liu2009), could have prompted deformation and surface uplift in the Huangling Dome and the Daba Mountains region, relatively weak rock between the Sichuan and Jianghan Basins, at some time after the late Pliocene. Based on the indicator from apatite fission track data in the Huangling Dome, the uplift rate in the Huangling Dome increased from 9–13 m/Ma to 293–387 m/Ma between 7 and 0.73 Ma, and further increased from 58 m/Ma to 1033 m/Ma from 0.73 Ma to 0.01 Ma (Xiang et al., Reference Xiang, Li, Wang, Zhu and Liu2009). Thus, the rapid increase of surface uplift of the Huangling Dome since 0.73 Ma could be the result of the lower crust flow eastward and could also be the immediate cause of the formation of the Three Gorges and the onset of a series capture events of the paleo-Yangtze River.
Li et al. (Reference Li, Fang, Song, Pan, Ma and Yan2014) demonstrated that the rapid persistent rise of the Tibetan Plateau began at 8 ± 1 Ma and was followed by stepwise accelerated rises at ~3.6 Ma, 2.6 Ma, 1.8–1.7 Ma, 1.2–0.6 Ma, and 0.15 Ma based on the dating of late Cenozoic basin sediments and the tectonic geomorphology of the NE Tibetan Plateau. The cumulative effect of rise in the eastern Tibetan Plateau caused the birth of the modern Yellow River in 1.2–0.6 Ma (e.g., 0.8 Ma from Zhang et al. [Reference Zhang, Wan, Clift, Huang, Yu, Zhang and Mei2019]; 0.88 Ma from Yao et al. [Reference Yao, Shi, Qiao, Liu, Kandasamy, Liu and Liu2017] and Liu et al. [Reference Liu, Zhang, Miao, Xu and Wang2020a]; 1.0 and 1.2 Ma from Hu et al. [Reference Hu, Pan, Bridgland, Vandenberghe, Guo, Fan and Westaway2017 and Reference Hu, Li, Dong, Guo, Bridgland, Pan, Li and Liu2019, respectively]; 1 Ma from Liu et al. [Reference Liu, Chen, Shi, Chen, Zhang, Hu, Dong and Tingdong Li2019, Reference Liu, Wang, Chen, Shi, Song and Hu2022a]; 1.165 Ma from Pan et al. [Reference Pan, Wang, Gao, Guan, Wang, Su, Li and Li2005b]; 1.25 Ma from Wang et al. [Reference Wang, Hu, Saito, Ni, Hu, Yu and Chen2022]). Thus, severe headward erosion, the onset of river capture events of the paleo-Yangtze River, and the formation of the Three Gorges during the period of 1.2–0.6 Ma suggest that the cumulative effect was also reflected in the evolution history of the Yangtze River. In other words, there was an intrinsic connection between the drainage evolution of the Yangtze River in SE Tibet and of the Yellow River in NE Tibet, and the evolutions of the two rivers were caused by the late Cenozoic stepwise-accelerated uplift in the eastern plateau margin (Ding et al., Reference Ding, Zhong, Pan, Huang and Wang1995; Ren et al., Reference Ren, Lin and Rao2010; Li et al., Reference Li, Fang, Song, Pan, Ma and Yan2014; Zhang et al., Reference Zhang, Li and Li2016) driven by the eastward expansion of the Tibetan Plateau. On the other hand, due to the effect on regional drainage evolution due to the stepwise uplift of the Tibetan Plateau, it should be reliable and effective to study the environmental effect of the Tibetan Plateau through drainage evolution.
CONCLUSIONS
The heavy mineral composition, U-Pb geochronology, and trace element composition of detrital zircons in the sediments from the Yunmeng planation surface, one river terrace, and a modern point bar in the study area have provided key information regarding the provenance changes in Quaternary fluvial deposits from Chongqing to Fengjie and the evolution of the upper Yangtze River.
First, the sediments from the Yunmeng planation surface were derived from felsic source rocks in the Huangling Dome, Wudangshan terrane, and South Qinling Belt to the east of the Three Gorges. The sediments from terrace T5 in Chongqing primarily consist of erosional detritus from the Sichuan Basin and its peripheral areas to the west of the Three Gorges. The sediments of terrace T2 and the modern point bar in Wanzhou consist of mafic detritus that was derived from the Shigu Group, Yidun terrane, Kangdian Rift, and Qamdo Block to the west of the Three Gorges.
Second, the provenance switch in the Quaternary fluvial deposits from Chongqing to Fengjie indicates that there was no connecting Yangtze River when the Yunmeng planation surface disintegrated at 0.75 Ma, and two rivers, the westward-flowing paleo-Chuan River and eastward-flowing paleo-Yangtze River, appeared to the west and east of the Huangling Dome, respectively. At 0.75–0.73 Ma, the paleo-Yangtze River cut through the Three Gorges and captured the paleo-Chuan River, and the Daliang Mountains became the new drainage divide between the paleo-Yangtze River and paleo-Chuan River. Finally, the paleo-Yangtze River progressively captured the paleo-Jinsha River, and a uniform large river system formed before 0.05 Ma.
Third, the reversal of flow direction of the river system of the paleo-Chuan River and formation of the modern Yangtze River reflect the influence of the eastward expansion and stepwise-accelerated uplift of the Tibetan Plateau on the southeastern plateau margin, which was similar on the northeastern margin.
Acknowledgments
The authors would like to thank AJE (www.aje.com) for language modification. The authors also thank Zhongyuan Chen and Hao Zou for their instructive discussions and advice.
Funding Statement
This study was supported by the Project of the National Natural Science Foundation of China (grant nos. 41972101, 41572093, 41072083).
Supplementary Material
The supplementary material for this article can be found at https://doi.org/10.1017/qua.2022.58