1. INTRODUCTION
In the last decade, nanostructured surfaces have been extensively studied, due to the predicted and in part observed unusual transport (electronic, optical), magnetic, and chemical properties that characterize matter when its typical sizes are pushed to the nanometer scale (Jarrold, Reference Jarrold1994). Much research activity was focused on noble metal nanoparticles (NPs), exploiting their optical properties of interest in surface enhanced spectroscopes and plasmonic, while their catalytic behavior finds application in the growth of nanotubes and nanorods (Bailini et al., Reference Bailini and Ossi2006; Bertoni et al., Reference Bertoni, Cepek, Romanato, Casari, Li Bassi, Bottani and Sancrotti2004). Among physical vapor deposition (PVD) techniques, that have been modified to produce nanostructured materials, in particular thin films, pulsed laser deposition (PLD) in a buffer gas is a promising approach to deposit nanoparticles of different materials over wide intervals of process conditions (Wang et al., Reference Wang, Xu, Zhou, Chu and Fu2007; Wolowski et al., Reference Wolowsky, Badziak, Czarnecka, Parys, Pisarek, Rosinski, Turan and Yerci2007; Gamaly et al., Reference Gamaly, Rode and Luther-Davies2000). In exemplary PLD depositions, including Au/glass (Irissou et al., Reference Irissou, Le Drogoff, Chaker and Guay2003), Au/HOPG (Zenkevich et al., Reference Zenkevich, Pushkin, Tronin, Troyan, Nevolin, Maximov, Filatov and Laegsgaard2002), Ag/Si (Seal et al., Reference Seal, Nelson, Ying, Genov, Sarychev and Shalaev2003), Pt/HOPG (Dolbec et al., Reference Dolbec, Irissou, Chaker, Guay, Rosei and El Khakani2004) on the nucleation and coalescence of NPs on the substrate was reported. The synthesis of C nanoclusters in plumes propagating through He and Ar atmospheres at pressures up to 1 kPa was reported and modeled (Bolgiaghi et al., Reference Bolgiaghi, Miotello, Mosaner, Ossi and Radnoczi2005), keeping into account the relevant role of ionization phenomena occurring in the interface region between the shock wave front and the buffer gas (Bailini et al., Reference Bailini and Ossi2006a, 2006b). Recently, cluster-assembled W films were deposited in different atmospheres and pressure ranges (Di Fonzo et al., Reference Di Fonzo, Bailini, Russo, Baserga, Cattaneo, Beghi, Ossi, Casari, Li Bassi and Bottani2006; Baserga et al., Reference Baserga, Russo, Di Fonzo, Bailini, Cattaneo, Casari, Li Bassi and Bottani2007); the surface morphology, bond coordination, and oxidation path of the films, both when exposed to the ambient atmosphere after deposition, and when synthesized in dry air were systematically studied and complemented a detailed high resolution transmission electron microscopy (HREM) analysis of structure, size, and morphology of the deposited NPs (Ossi et al., Reference Ossi, Bailini, Geszti and Radnoczi2008a, Reference Ossi and Bailini2008b), whose sizes agree with those predicted by a model of cluster growth in a plume expanding through a buffer gas (Bailini & Ossi, Reference Bailini and Ossi2007b).
In this work, we investigate the synthesis and deposition of Ag NPs produced by PLD in a controlled inert gas (Ar) atmosphere. The films were prepared on polished <100> Si substrates; also samples on ad hoc amorphous-C supported TEM grids were deposited for direct observation. The morphologies of the films prepared at different Ar pressures are discussed and the measured NP average sizes are compared to those predicted by the mixed-propagation model (Bailini et al., Reference Bailini, Ossi and Rivolta2007a, Reference Bailini and Ossi2007b) of cluster growth in a propagating ablation plume. The plasma expansion dynamics was investigated by means of fast photography imaging. Fast photography and plasma spectroscopy have been widely used to gain information about physical quantities that characterize the plasma and to detect the presence of atomic and/or molecular species in the plasma (Thareja & Sharma, Reference Thareja and Sharma2006; Trusso et al., Reference Trusso, Barletta, Barreca, Fazio and Neri2005; Schade et al., Reference Schade, Bohling, Hohmann and Scheel2006; Rafique et al., Reference Rafique, Khaleeq-Ur-Rahman, Riaz, Jalil and Farid2008; Hafeez et al., Reference Hafeez, Shaikh and Baig2008). In this study, data on physical quantities such as the initial expansion velocity, the mass, the temperature, and the emission intensity as recorded from time resolved fast photography imaging of the expanding plume were used to obtain realistic parameters for the mixed-propagation model.
2. EXPERIMENT
The films were deposited in a high vacuum chamber with a residual pressure lower than 1.0 × 10⁻⁴ Pa. A KrF excimer laser (wavelength 248 nm, pulse duration 25 ns, repetition rate 10 Hz) was used to ablate the Ag targets mounted on a rotating holder to guarantee the process repeatability. The laser beam was focused onto the target surface with a quartz lens at an incident angle of 45°. Laser energy density (fluence F), target to the substrate distance (T), and number of laser shots were kept fixed at 2.0 Jcm−2, 35 mm, and 10000, respectively. The deposition process was performed in a controlled atmosphere of Ar gas fed into the chamber through a mass flow controller at the Ar pressure values of 10, 40, 70, and 100 Pa. Such values guarantee that nanostructure silver films are deposited with our system (Fazio et al., Reference Fazio, Trusso, Fazio, Neri, Ossi and Santo2008). As substrates were used c-Si, Corning 5049 glass substrates, and TEM grids. TEM imaging was performed using a Zeiss Leo 912AB microscope working at 80 kV. Imaging of the light emission from the expanding plasma was performed using an intensified charge coupled device (iCCD) camera Andor iStar (DH-702) with an active area of 1024 × 256 pixels. Time delays from the laser pulse were varied in the range between 10 and 60000 ns. The gate and intensification values were chosen as a function of the experimental conditions in order to maximize the signal to noise ratio. Each picture was obtained summing up the signal over 10 successive laser shots. Light emission from the plasma was not filtered, thus the images consist of the luminous emission from all excited species in the plasma. The acquisition procedure was synchronized with the arriving time of the laser pulse using a fast photodiode that collected a small portion of the laser beam, the generated electrical pulse from the photodiode was then TTL shaped and used to trigger the iCCD acquisitions. Time delays from the laser pulse were set using the internal delay generator of the iCCD. The minimum experimentally accessible delay was 10 ns. The ablation rate was determined measuring the crater profiles with a Tencor Alpha-Step 500 stylus Profilometer. In order to evaluate the ablated mass per single shot (i.e., the mass of the expanding plasma), at the laser fluence of 2.0 Jcm−2, a Ag target was irradiated with 10, 50, 100, and 200 laser shots at different positions on its surface. The resulting crater profiles of the four craters were measured using a stylus profilometer and the removed mass was evaluated from the Ag density (10.49 gcm−3). The ablated mass per single shot was obtained from a linear regression on the removed mass versus the number of laser shots. The estimated mass removed from the target by a single laser shot (M 0) amounted to 56.2 × 10⁻⁹ g corresponding to 3.14 × 10¹⁴ evaporated Ag atoms.
3. PLASMA EXPANSION
After the laser pulse energy has been absorbed by a target material, the expansion of the laser generated plasma through a background gas is a complex process which involves several phenomena. All of these processes involve a strong variation of temperature and pressure in a short time interval; therefore, a complete description of the process is still lacking. Basically, when a high-energy laser pulse hits the surface of a material, a plasma ball develops and begins to expand, driven by its high internal pressure. In vacuum, a free expansion is observed; free expansion occurs also in the presence of an ambient gas, over a limited time interval just after the arrival of the laser pulse, afterward the collisions between the plasma species and the ambient gas lead to a departure from the free expansion. Collisions give rise to enhanced light emission and can lead to the development of a shock wave. At longer time delays thermalization and even stopping of the plasma occur. In order to describe the plasma expansion behavior, the drag (Geohegan et al., Reference Geohegan1992, Reference Geohegan, Crisey and Hubler1994), the shock wave (SW) (Zel'dovich & Raizer, Reference Zel'dovich and Raizer1966), and the diffusion (Rode et al., Reference Rode, Gamaly and Luther-Davies2000) models are widely adopted. The drag model is able to describe the early expansion regime at relatively low buffer gas pressure (Dyer et al., Reference Dyer, Issa and Key1990; Gonzalo et al., Reference Gonzalo, Afonso and Madariaga1997). In this model, the expanding plasma is considered as an ensemble of particles, which experience a viscous force proportional to the plasma velocity V, so that:

V 0 being the initial plasma velocity, and b is the slowing down coefficient; the position x(t) of the plasma front at the time t is given by:
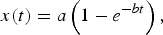
where a is the stopping distance, i.e., the farthest distance from the target reached by the plasma. Fitting experimental data to Eq. (2) the a and b values are obtained. A delayed drag model has also used (Gonzalo et al., Reference Gonzalo, Afonso and Madariaga1997) introducing in Eq. (2) an additional parameter x 0 which takes into account the delay required for the emission to begin at x = 0. The model describes the initial expansion stage, but the calculated values of stopping distance a are shorter than those observed in experiments.
At larger distance from the target surface and if the gas background pressure is high enough, the shock wave model describes the plasma expansion better. In this model, the plasma acts as a piston compressing and pushing the gas molecules ahead of the contact surface with the plasma at supersonic velocity, leading to the formation of a shock wave at the contact surface between the plasma and the gas. The position of the propagating shock wave as a function of time is given by:
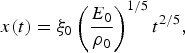
where ξ0 is the geometrical factor, ρ0 is the density of the unperturbed buffer gas, and E 0 is the plasma energy. A modified version of the model (delayed shock wave model) (Gonzalo et al., Reference Gonzalo, Afonso and Madariaga1997) is:

where x 0 has the same meaning as in the delayed drag model, and t s is a time delay. The shock wave develops as soon as the mass of the ablated material becomes small compared to the mass of the gas surrounding the shock wave, a condition that is verified at increasing distances from the target as the pressure of the buffer gas is lowered. At some distance from the target surface, the pressure driving the plasma motion becomes comparable to the buffer gas pressure and Eq. (3) is no longer valid (Zel'dovich & Raizer, Reference Zel'dovich and Raizer1966). These conditions limit the spatial region where the shock wave can be observed:
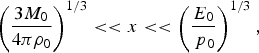
here M 0 is the mass of the expanding plasma, and p 0 is the unperturbed gas pressure ahead of the shock wave front.
As soon as the shock wave develops the kinetic energy of the plasma is converted through collisions in thermal energy, with the consequent sharp rise of both luminous emission and temperature at the contact surface between the plasma and the buffer gas. In the SW model, an estimate of the temperature T s of the shocked region is (Zel'dovich & Raizer, Reference Zel'dovich and Raizer1966):

γ is the ratio of the specific heats of the gas, M is the Mach number (i.e., the ratio of the velocity of the expanding plasma to the sound velocity), and T 0 is the temperature of the undisturbed gas.
If a classical diffusion transport mechanism is assumed to be effective, the position of the plasma front as a function of time will be given by:

D is the diffusion coefficient which is equal to D = (λν)/3, λ = (n gσ)−1 is the mean free path; n g is the gas density, ν is the relative velocity of the colliding particles, and σ is the scattering cross section. The above diffusion model underestimates distances traveled by the plasma front. It is worth mentioning that none of the above models is able to give an accurate description for all of the experimentally observed temporal stages of the plasma expansion through a buffer gas.
Recently, a two-step analytical mixed-propagation model was successfully employed to describe the expansion of C and Ag laser generated plasmas in N2 and O2 under similar experimental conditions (Bailini et al., Reference Bailini and Ossi2006b). In the mixed-propagation model, the expansion is described combining a modified drag model and a modified diffusion model. In the modified diffusion model, the diffusion coefficient D is expressed as D = Kv 0(nσ)−1 (Bailini et al., Reference Bailini and Ossi2007b) where v 0 is the initial velocity, and K is an integer number that depends on the atomic mass of the target. Taking this into account the stopping distance a in Eq. (2) is expressed as a = ν0Dµ−1 and the parameter b as µD −1. The modified drag model, then, gives a description of plasma expansion as a diffusive motion in presence of viscosity, whose effect is embodied in the coefficient µ.
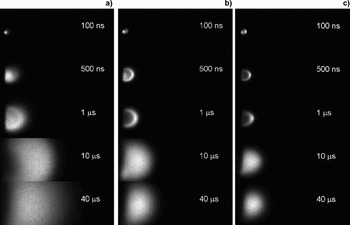
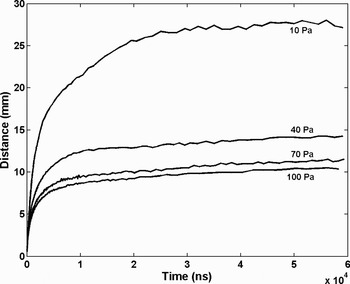
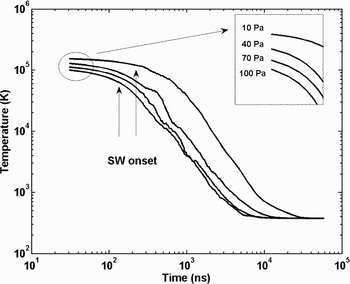
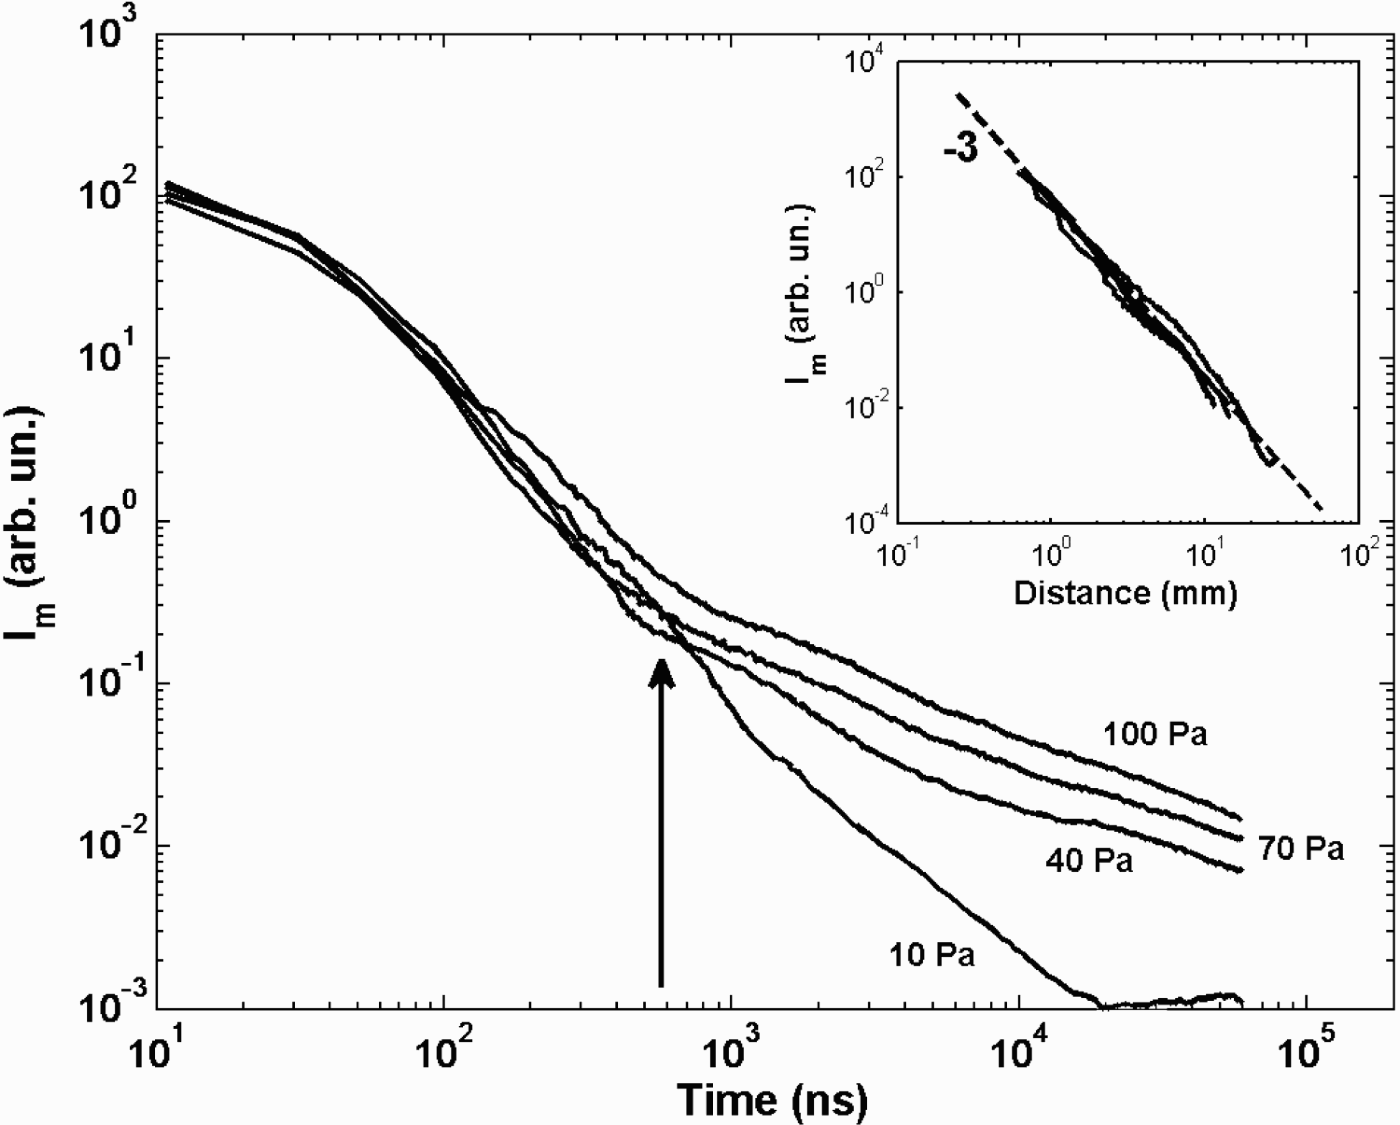
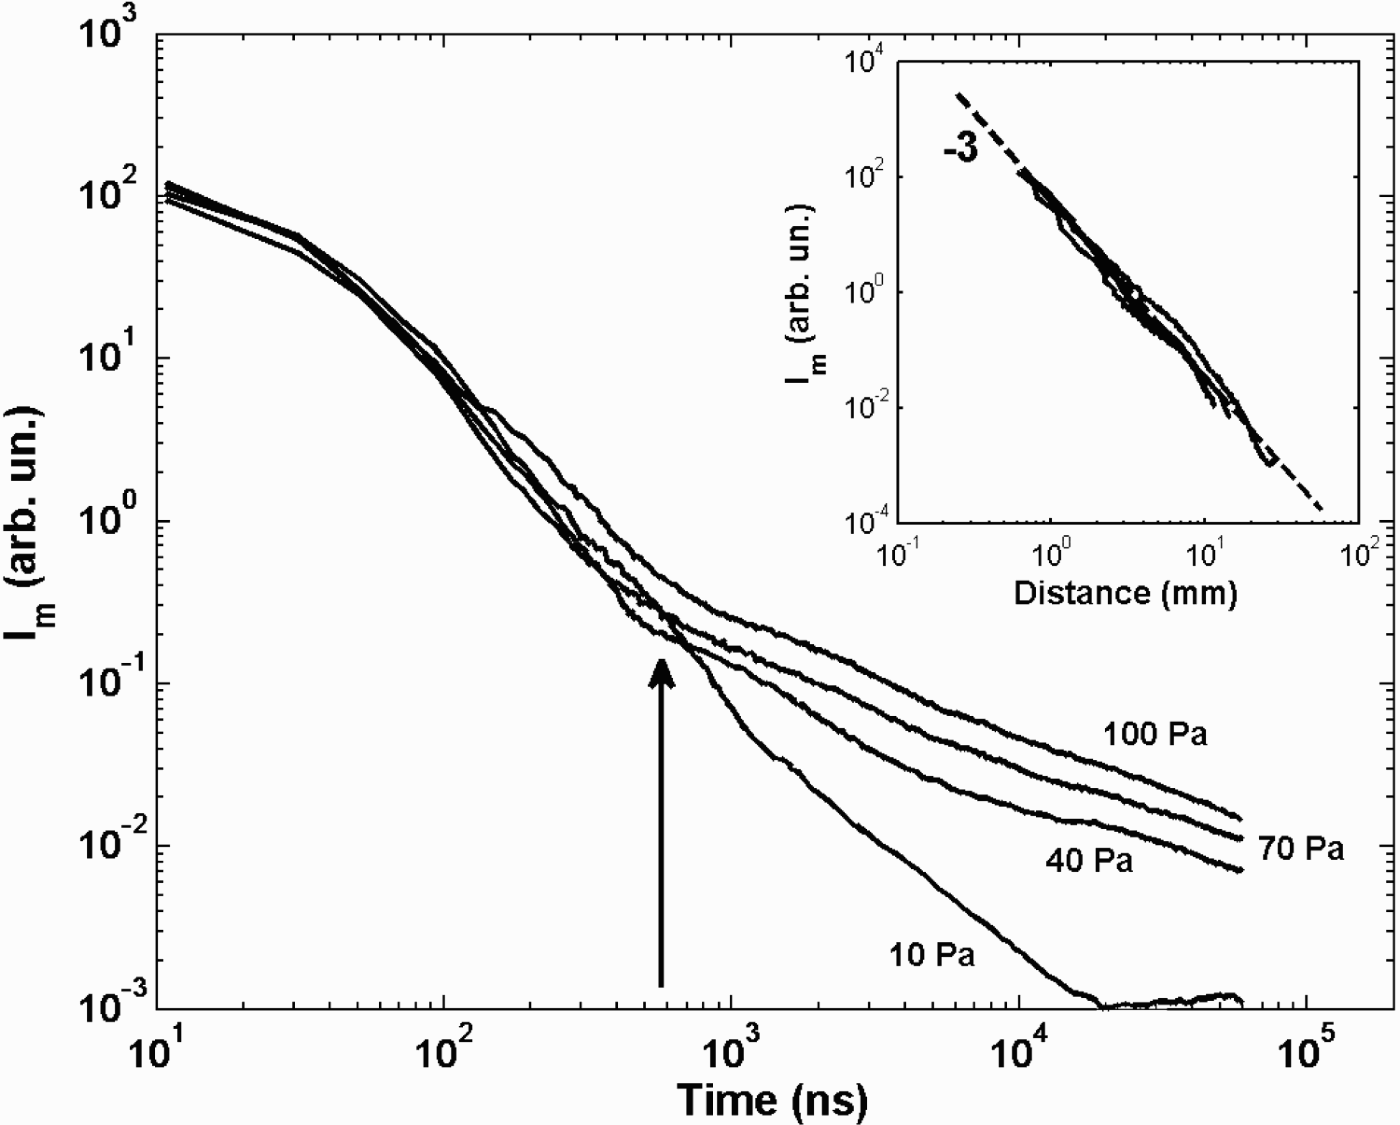
In Figure 1, there are shown fast photography pictures of the laser generated Ag plasma at selected time delays for different Ar pressures, each image being normalized to its own maximum intensity. At 10 Pa (Fig. 1a), at a delay of 100 ns, the plasma appears as a small ball near the target surface. Looking at the images acquired at larger delays, the slowing down of a nearly spherical expansion can be observed. After a time delay of 40 µs, the plasma front edge is observed at about 25 mm from the target surface. In Figure 1b, images of the plasma expanding in an Ar atmosphere at 40 Pa are shown. The time delays are the same as in Figure 1a. At this pressure value in correspondence to the contact surface between the plasma and the ambient gas, a bright edge due to light emission from collisionally excited atoms can be observed, and indicates the development of a shock wave. The presence of such a bright edge can be envisaged starting from time delays of few ns and becomes clearly visible after a delay of 100 ns. Increasing the ambient pressure plasma confinement becomes more and more evident as can be seen from the images shown in Figure 1c where the plasma expands through argon at 100 Pa. Useful data can be extracted from the images. The plasma front edge position as a function of time, for the different ambient gas pressure values, is reported in Figure 2. In the first stage of the plasma expansion, a linear behavior is observed, followed by a slowing down due to interaction with ambient gas at rest, while in the final expansion stage the plasma stops, or moves very slowly. In the initial stage of the expansion, as reported above, a linear behavior can be envisaged. The temporal extent for which a linear behavior can be observed is a function of the buffer gas pressure. As the gas pressure is raised, the interaction with the buffer gas becomes evident at shorter times leading to a deviation from the free expansion behavior. Fitting the x-t data in the very initial stage, where a linear expansion behavior is observed, the values of the initial velocity v 0 at each Ar pressure were obtained. The values are reported in Table 1 and they decrease from 1.1 × 10⁴ ms−1 at 10 Pa down to 8.3 × 10³ ms−1 at 100 Pa. Such a decrease indicates that, even if a linear expansion is observed, the influence of the buffer gas pressure is effective in this stage also. By adopting the modified drag model (Bailini et al., 2007b), the v 0 can also be evaluated by fitting the experimental data to Eq. (2). The modified drag model reproduces well the behavior in the initial stage of the expansion, but it gives shorter distance values than the experimentally observed ones both at the intermediate and the final stages of the expansion. Nonetheless the obtained v 0 values were in good agreement with the ones obtained from the linear fit in the early stage of the expansion. As discussed above, the appearance of a bright edge at the contact surface between the expanding plasma and the buffer gas indicates that a shock wave developed. Also in this case Eq. (4) is unable to reproduce the sequence of experimental data along all the time evolution of the expansion; nevertheless a limited time interval can be identified where Eq. (4) well reproduces the experimental data (Trusso et al., Reference Trusso, Barletta, Barreca and Neri2004). Over this time range, the temperature of the shocked region can be estimated using Eq. (6). The Mach number M is obtained from the ratio of the plasma velocity, estimated from the x-t data, to the speed of sound in the undisturbed gas. A plot of the estimated temperature values versus the time delay with respect to the arrival of the laser pulse is reported in Figure 3. The arrows indicate the limit of validity of Eq. (6) estimated using the relations in Eq. (5). The temperature values show a decrease from about 105 K in the initial stage of the expansion down to few hundred K in the final one. As reported above, the luminous emission from the plasma is a consequence of collisions that most likely result in excited neutral or ionized species. Their relaxation occurs via emission of light. In the initial stage of expansion, when the densities of free electrons and of emitting species are high, excitation takes place through collisions among these species, but, as soon as the plasma expands, such densities drop and so does the probability of a given species to get excited. Thus the plasma luminous emission can be taken as a measure of the collisional rate among plasma constituents, regardless of the excitation mechanism by which an excited species has been produced. In Figure 4, we report the maximum emission intensity value as measured for each time delay along the target to the substrate direction. Taking into account that each image was acquired using different integration times and iCCD amplification factors, the intensity values were normalized with respect to these two parameters. It can be seen that the emission intensity is maximum for all of the Ar pressures at time t = 0 and rapidly decreases as the plasma expands. From Figure 4 it could be noted that the trend of the intensity emission as a function of time for the expansion at 10 Pa is at variance with respect to the trends observed at higher gas pressures. The plasma emission intensity in fact steadily decreases for the experiment at 10 Pa of Ar, while in the intensity curves for experiments performed at higher pressure values, a slope change is clearly observable at about 580 ns after the arriving time of the laser pulse. We tentatively interpret such a slope change as due to an emission intensity revival associated to the arrival of the slow component of the plasma at the interface between the plasma and the gas with the consequent increase of the collision number. It is worth noticing that in coincidence with the slope change, the absolute emission intensities have decreased by about three orders of magnitude from the initial values, for all ambient gas pressures. In the inset of Figure 4, we report the intensity emission data versus the distance from the target surface. Intensity data acquired at the different investigated Ar pressures lie on the same curve with slope -3 which clearly states the linear dependence of the collisional rate on the plasma volume.
Spots of the Ag plasma expanding in (a) 10 Pa, (b) 40 Pa, and (c) 100 Pa of Ar at different time delays with respect to the arrival of laser pulse. Each image is normalized to its own maximum intensity.

Position of the plasma front edge as a function of the time for different Ar pressures.


Intensity emission measured at the front edge of the plasma as a function of time. The arrow indicates the slope change observed in the intensity emission decrease for the Ar pressure values of 40, 70, and 100 Pa. In the inset the same data are plotted as a function of the distance from the target surface. All the data for the different Ar pressures lie on the same curve with slope-3.
Experimental parameters (p g, n g,n a, σa-g, σa-a ) and plasma expansion analysis results (v 0, <v> , t f, x aggr) used to calculate the cluster

4. TEM IMAGING
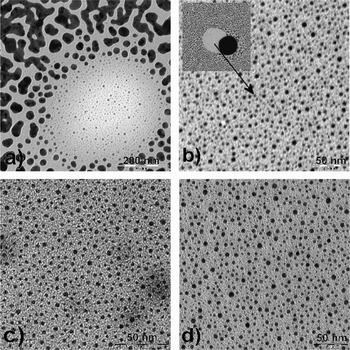
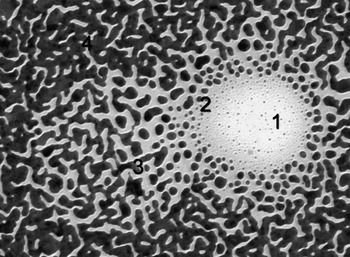
In Figure 5, pictures of the samples deposited at the different Ar pressure are shown. They are representative for all the images acquired, for each sample, at various points on the surface. The samples grown at 70 and 100 Pa (Fig. 5c and Fig. 5d) consist of nanoparticles, most of them having dimensions, evaluated at first by visual inspection, in the range between 2 and 4 nm. Some clusters composed by two or more spherical particles can also be observed. The scenario is different for the samples grown at lower Ar pressure values (i.e., 10 and 40 Pa in Fig. 5a and Fig. 5b). In this case, structures resulting from a coalescence process can be observed, even if substrate coverage (a-C covered Cu TEM grid) is still incomplete after 10000 shots. To analyze the likely presence of spherical and isolated particles at 10 and 40 Pa, we focused to specific areas of the samples where isolated nanoparticles (with the smallest size visible to the naked eye) are evident. The spatial density of the latter is low, probably due to the shadowing effect of a big spherical droplet that masked a portion of the substrate during the deposition process (this point will be explained successively looking at the TEM image of the sample grown at 10 Pa of Ar in Fig. 6).
TEM images of samples grown at (a) 10 Pa, (b) 40 Pa, (c) 70, and (d) 100 Pa of Ar.

TEM image of sample grown at 10 Pa of Ar. The film formation mechanism at different times can be observed thanks to the occurrence of two spherical droplets that masked a portion of the substrate leaving then the surface at different times during the deposition process. The circular area (1) is characterized by small isolated particles with dimensions in the range 1-3 nm. At the border of this area larger particle, but still isolated, can be observed, area (2). Such particles then start to coalesce as can be seen in area (3). The region (4) is characterized by a percolated Ag network that covers in a nearly complete way the substrate.

In the films deposited at lower Ar pressure values, the number of deposited laser pulses here adopted results in a particle density on the substrate surface large enough that aggregation of small particles occurs, giving rise to coalescence into the observed big particles besides the smaller spherical ones.
On the contrary, at 70 and 100 Pa, we suppose that, after landing on the substrate, the deposited nanoparticles undergo no meaningful changes, since they invariably constitute a “carpet” of mutually separated NPs with virtually unchanged spherical shape. In these samples film, growth is arrested at an earlier stage with respect to the samples deposited at lower Ar pressures. In the latter the coexistence of spherical, elongated and large, coarsened particles indicates that film formation progressed. Yet, it is likely that the (minority) fraction of spherical particles with small size found also in the films deposited at low ambient gas pressure can be considered “as deposited”; thus no meaningful size and shape changes due to the kinetics on the substrate affected the growth of these smaller NPs. A similar growth mechanism was observed for Ag films deposited in He atmosphere at somewhat higher pressure values and for longer deposition times (Fazio et al., Reference Fazio, Trusso, Fazio, Neri, Ossi and Santo2008). A clear understanding of the film growth mechanism is gained from Figure 6. A common drawback of pulsed laser deposition is the presence of micrometric or submicrometric particulate onto the surface of the deposited films. The particulate can be originated by several different mechanisms, but in the case of metals, usually they take origin from liquid droplets ejected from the target surface by pressure recoils, or by the subsurface superheated layer (Cheung, Reference Cheung, Crisey and Hubler1994). In Figure 6, four regions characterized by a different morphology can clearly be identified. A low-density circular area is clearly recognizable and can be identified as the location where a liquid droplet landed during deposition. Its presence affected the flux of Ag atoms impinging onto the substrates at its location and in the nearby region, due to severe shadowing that becomes progressively less relevant when moving away from the center of the normally projected particle shadow. The observed morphology differences are due to the different Ag atom flux that each region experienced during the deposition process owing to the presence of the droplet. During the deposition, the particle was removed from the substrate surface where, as usual, it adhered weakly and, as can be inferred by the presence of small particles at the droplet position, the deposition process restarted. Taking this into account the morphologies observed in Figure 6 can be considered as snapshots of different stages of film growth at different times. In the early stage of deposition on the substrate, isolated naneter-sized particles are present; with increasing deposition time particle size increases until they start to coalesce giving rise to larger islands that lose spherical symmetry, until lastly a percolated structure results.
5. MODELLING
The peculiar morphologies and the scaling of average NP size shown by electron microscopy among films synthesized at different Ar pressures suggest some considerations.
In particular, the average sizes of the constituent units observed in films grown under different conditions are compared to the predictions of a recent model (Bailini et al., 2007; Ossi et al., Reference Ossi, Bailini, Geszti and Radnoczi2008a Ossi & Bailini Reference Ossi and Bailini2008b) to estimate in the ideal gas approximation the average asymptotic number N of atoms contained in a cluster grown up to its steady size during plume flight. As shown by the pictures in Figures 3, the plume undergoes different pressure regimes (both external and internal) during its expansion and is spatially inhomogeneous, so that clusters in different regions of the plume grow at different rates. Yet, averages over times as long as microseconds are considered, during which the expansion is completed. When the target to substrate distance x T-S is greater than the distance x aggr traveled by the plume during cluster growth,

x aggr is obtained by optical emission spectroscopy data, recording the signal from the relevant species in the plume as a function of the distance traveled by the plume itself; alternatively its upper limit value is deduced from its observed dependence on buffer gas pressure, namely x aggr = 6 p g−1/5 (Rivolta, Reference Rivolta2006). The choice of x aggr is a critical one. From an analysis of fast photography pictures of the propagating plumes (see Section 3); x aggr was identified as the distance corresponding to a decay of absolute plasma luminosity by three orders of magnitude with respect to the initial value. It was assumed that at such a point, any collisional plume behavior relevant to cluster growth actually came to an end. Afterward, the propagating plume consists of steady-size NPs. The plasma temperature dropped from ~1.2 × 10⁵ K in the initial expansion stage to around 104 K at x aggr, the distance x aggr being traveled in about 580 ns. On the emission intensity-time plot (see Fig. 4), such an instant corresponds to an inflection point, where the slope of the emission profile changes significantly, in coincidence with a likely change of the plume propagation regime. Adopting this value of x aggr, based on a more physically sound estimate, average diameter values for isolated sphere-like Ag NPs in excellent agreement with the sizes directly measured by TEM observations are obtained (see below).
The cluster formation time t f is the time during which the plume travels the distance x aggr. <n a> is the average number density of ablated atoms; it is calculated from the average number of ablated atoms per pulse, as obtained from the crater volume measurements, and the average plume volume, deduced from plume pictures taken near the target and at a distance from the target around x aggr. When <n a> increases the collision frequency between ablated atoms increases too. n g is the number density of buffer gas atoms; progressively larger n g values result in enhanced plume confinement. Both mechanisms favor in-plume cluster formation and growth. σa-a and σa-g are the geometric cross sections for ablated particle-ablated particle and for ablated particle-gas atom binary collisions, respectively. A unit sticking coefficient is taken. Even if velocity distributions should be used, the average velocity νg and the velocity ν0 for the fastest plume constituent (Ossi & Bailini, Reference Ossi and Bailini2008b) are chosen for gas atoms and for ablated particles respectively. The impact velocity in a binary collision between a fast plume particle and a slow buffer gas atom

is assumed to be the average velocity <v> of plume particles. Thus the fastest group of ablated particles plays a leading role in cluster formation (Ossi & Bailing, 2008). When <v> increases, the time interval between two subsequent collisions decreases, and the rate of cluster growth is enhanced.
In Eq. (8), the term (<n a> × σa-a × <v> × t f) provides cluster growth and is proportional to the scattering probability between ablated particles. In turn, the term (n g × σa-g·<v>·t f), which is proportional to the scattering probability between ablated particles and gas atoms, depicts the slowing down and confinement of the plume. In the first stages of plume expansion cluster growth by progressive, atom aggregation is the leading process; after the plume has traveled the distance x aggr, cluster growth is balanced by cluster cooling via atom evaporation besides atomic collisions; the clusters with asymptotic size ultimately land on the substrate as solid particles. It is worth mentioning that film growth involves the subsequent stages of surface diffusion and mutual aggregation of the clusters on the substrate that are governed by thermodynamics and kinetics. Thus film growth depends on the temperature, morphology, chemical state of the substrate, as well as on the kinetic energy, cohesive energy, and chemical state of the cluster.
In Table 1, deposition conditions and values of model parameters deduced from experiments for the considered Ag thin films are collected. With Eq. (8) the number of atoms per cluster is N 10 = 15, N 40 = 158, N 70 = 716, N 100 = 2.34 × 10³, where the subscripts refer to the Ar pressure values at which the depositions were performed. For sphere-like clusters, taking a packing efficiency η = 0.67, typical of close packed non-crystalline structures, the corresponding average cluster diameters are d 10 = 0.7 nm, d 40 = 1.7 nm, d 70 = 2.8 nm, d 100 = 4.1 nm. Such values are in good agreement with the average NP diameters estimated from representative TEM pictures of the considered films, that range from 0.9 to 1.7 nm at p Ar = 10 Pa, from 1.8 to 2.2 nm at p Ar = 40 Pa, from 1.5 to 4.5 nm at pAr = 70 Pa, from 4 to 7 nm at p Ar = 100 Pa.
Notice that in the films deposited at higher pressure values the shape of nearly all of the NPs is sphere-like. For the films deposited at lower pressures, where particle coalescence dominates, only a minor fraction of spherical particles was identified; the above reported sizes refer to such particles.
In these films, most likely clusters of size near the calculated one constitute the building blocks from which kinetics and, to a lower extent; thermodynamics drive extended film formation, as shown by the discussed morphology. The above model that is based on the kinetic gas theory does not include the kinetic evolution of mutually interacting clusters on the substrate. However, some observations are possible. In particular, the adsorption energy of Ag on most substrates is low, so that also the initial sticking probability is low (Henry, 1998); this means that most probably Ag films grow according to the Volmer-Weber scheme, forming three-dimensional islands. The sequence of pictures in Figure 5 shows that coalescence occurs in the films deposited at low Ar pressure. This is reasonable because, at fixed number of laser pulses (10000), the number of Ag clusters impinging on the substrate increases with lowering Ar pressure. This is supported by the progressively increasing area density of Ag NPs whereas their number density decreases.
6. CONCLUSIONS
The average sizes of Ag NPs synthesized in ablation plumes propagating through Ar at pressures ranging from 10 to 100 Pa have been measured by TEM. From plasma imaging plume properties including plume velocity versus time, the onset position of the shock wave, the absolute intensity of the luminous plasma emission versus time, the plasma temperature were obtained. These data, together with the measured ablated mass per pulse were used as input parameters of an atomistic model to estimate the average size of NPs grown in the expanding plume. The reduced dispersion of particle size over rather narrow size ranges indicates that a fine-tuning of deposition conditions allows tailoring NP size. This is of major interest, for example, for the development of surface enhanced Raman scattering (SERS) active substrates (Nie et al & Emory, Reference Nie and Emory1997; Kneipp et al., Reference Kneipp, Wang, Kneipp, Perelman, Itzkan, Dasari and Feld1997), whose optical properties strongly depend on dimensions, shape and structure of the NPs (Compagnini et al., Reference Compagnini, Pignataro and Pelligra1997; Jin et al., Reference Jin, Cao, Mirkin, Kelly, Schatz and Zheng2001). It is thus possible to control the size-dependent properties of films made of an assembly of isolated NPs deposited by PLD in a suitable buffer gas. In turn, the success of the model to deduce NP size indicates that it has an predictive ability.