Heavy metal pollution, particularly Pb2+ contamination in water, threatens ecological safety and human health due to its high toxicity, persistence and bioaccumulation (Cui et al., Reference Cui, Zhou, Cheng, Fang, Wang and Chen2025; Yusuf et al., Reference Yusuf, Aliyu, Azeez, Taialla, Lateef and Sulaimon2025; Zhang et al., Reference Zhang, Liu, Tan, Xu, Pei and Tang2025a). Adsorption is widely used for heavy metal removal because of its operational simplicity, low energy consumption and environmental compatibility (Su et al., Reference Su, Wang, Zhang, Li, Jiao and Su2025; Teng et al., Reference Teng, Zhang, Guo, Li and Xu2025; Zhu et al., Reference Zhu, Jin, Zhou, Hossain, Luo and Zhou2025). Among various adsorbents, natural clay minerals are attractive candidates for this purpose due to their large reserves, non-toxicity, low cost and chemical stability (Yang et al., Reference Yang, Zhou, Hu, Zheng, Zhao, Lv and Liao2024; Abdel-Azim et al., Reference Abdel-Azim, Aboul-Gheit, Younis and Ahmed2025; Luo et al., Reference Luo, Cai, Yu, Huang and Yan2025).
Attapulgite, a 2:1 chain-layered hydrous magnesium aluminosilicate, has drawn considerable attention in the area of heavy metal adsorption. Its unique nanochannel structure, high specific surface area, abundant surface active sites (e.g. Si–OH, Mg–OH, Al–OH) and favourable cation-exchange capacity (CEC) make it particularly promising for this purpose (Zhang et al., Reference Zhang, Fan, Liu, He, Zhao and Han2023, Reference Zhang, Tang and Lang2025b; Tang et al., Reference Tang, Zhang and Lang2025). Previous studies have shown that attapulgite adsorbs various heavy metal ions (Pb2+, Cd2+, Cu2+ and Co2+) through ion exchange, surface complexation, electrostatic attraction and precipitation (He et al., Reference He, Zhu, Yang, Han and Zhang2011; Sun et al., Reference Sun, Zhang, Zou, Wang, Zhou, Ye and Zhao2021). However, most existing research has focused on purifying or chemically modifying clay minerals – via acid, alkali, thermal, or organic treatments – to further improve adsorption performance (Wang et al., Reference Wang, Tian, Zhang and Wang2016; Hu et al., Reference Hu, Teng, Yin, Wang, He and Zhu2025; Zhang et al., Reference Zhang, Zhao, Pu, Bao, Qie and Tan2025c).
In nature, high-grade attapulgite deposits are limited. The vast majority of such reserves are predominantly low-grade mixed-dimensional intergrowths containing attapulgite along with calcite, quartz, chlorite and illite (Zhang et al., Reference Zhang, He, Zhao, Guo, Han and Wang2021a, Reference Zhang, Yuan, Zhao, Yin, Yan, Zhang and Geng2024). Because these mineral phases have similar physicochemical properties and are difficult to separate, such low-grade intergrowths have long been considered low-value resources, but their potential as functional materials has been underestimated (Diop et al., Reference Diop, Molez, Bouguerra, Diouf and Grutzeck2014; Shi et al., Reference Shi, Liu, Zhang, Lan, Zhao, Zhao and Wang2022).
From a materials perspective, this feature of these resources creates a dual complexity. First, the composition is mixed: active components (attapulgite, calcite) coexist with inert ones (quartz), diluting overall performance. Second, the physical aggregation state is tight: mineral particles are interwoven and severely agglomerated, thereby burying active surfaces (Han et al., Reference Han, Wang, Zhao, Zhang, Guo, Wang and Wang2022; Lu et al., Reference Lu, Mu, Kang, Gao and Wang2025; Liu et al., Reference Liu, Zhang, Mao, Shan, Wang and Wang2026). This ‘dilution’ and ‘site burial’ effect is the structural origin of the poor adsorption performance of these intergrowths and a key challenge facing their high-value utilization.
Various activation methods have been developed to improve the adsorption capability of such minerals (Wang & Wang, Reference Wang and Wang2016; Zhang et al., Reference Zhang, Wang, Zhao, Bai, Wen and Kang2021b; Lu & Wang, Reference Lu and Wang2022). Physical activation (grinding, ultrasonication, water washing) disrupts agglomeration and increases surface area but does not alter the intrinsic mineral structure. Chemical activation (acid, alkali or salt treatment) etches surfaces and increases active sites but introduces reagents that raise costs and the environmental burden, and may also damage the crystal structure. Thermal activation removes channel and structural water and activates lattice defects, but it cannot resolve component dilution or agglomeration burial (Bal et al., Reference Bao, Damtie, Wang, Chen, Tao and Wei2024). Moreover, existing modification studies have largely treated ‘activation’ as an individual process, attributing improvements vaguely to ‘increased surface area’ or ‘more active sites’ while overlooking how inert components affect the final activation effect.
Interestingly, the complexity of intergrowths carries distinct value implications across various fields. In traditional high-value applications (e.g. catalytic supports, functional fillers), multi-mineral intergrowth is a problem because obtaining high-purity single phases is difficult from such sources. For environmental adsorption, however, this complexity could become an advantage: different mineral phases provide diverse active sites (e.g. silanol groups on attapulgite, carbonate groups on calcite), and spatially interwoven phases may create ‘spatially superimposed’ adsorption sites where target ions interact with multiple mineral surfaces simultaneously, achieving stronger binding than any single phase. This suggests that for low-grade mixed-clay intergrowths, preserving and leveraging multi-mineral synergy rather than pursuing purification may unlock their adsorption potential.
Based on these considerations, a component-structural multi-scale regulation strategy was applied to activate low-grade mixed attapulgite clay intergrowths. This strategy proceeds progressively from composition to aggregation state, then to structure and surface chemistry. Sieving and water washing first remove inert components such as quartz. High-speed shearing and ultrasonic treatment then break soft agglomerates and expose active surfaces (Huang et al., Reference Huang, Zhu, Yang, Meng, Zhang, Wang and Hu2026). Finally, controlled thermal treatment removes channel water from attapulgite, activates exchange sites on silicate surfaces and increases surface negative charge (Wang et al., Reference Wang, Liu, Zhang, Hu, Liu and Fu2025a).
Systematic characterization – covering composition, aggregation state, crystal structure and surface chemistry at each stage – along with quantitative Pb2+ adsorption evaluation, serves three purposes: (1) to elucidate the structural evolution of low-grade mixed-clay intergrowths during multi-scale regulation; (2) to clarify the synergistic Pb2+ adsorption mechanism on the activated material; and (3) to demonstrate a sustainable route to obtaining high-performance adsorbents. The raw materials are natural and abundant, requiring no purification. The production process uses no chemicals, emits no chemical waste and consumes only electricity – increasingly from renewable sources. The process also lends itself to high automation, low equipment wear and batch continuous production. Abundant low-grade intergrown clay resources thus find a theoretical basis for environmental remediation. The multi-scale regulation approach may extend to other low-grade intergrown minerals. The observed calcite-dominated ion exchange also suggests a new way to exploit the adsorption potential of associated carbonate minerals in low-grade clay resources.
Experimental
Materials and reagents
Natural mixed-dimensional attapulgite clay (NC) with a particle size ≤75 μm was obtained from Ordos City, Inner Mongolia, China. Lead nitrate (Pb(NO3)2, ≥99%), nitric acid (HNO3, guaranteed reagent (GR), 65–68%), hydrofluoric acid (HF, 40%), sodium hydroxide (NaOH, GR), sodium chloride (NaCl, analytical reagent (AR)), potassium chloride (KCl, AR), anhydrous calcium chloride (CaCl2, AR) and magnesium chloride (MgCl2, AR) were purchased from Shanghai Aladdin Biochemical Technology Co., Ltd (China). Deionized water (DW) was produced using a Milli-Q® Integral 10 laboratory water purification system. A lead single-element standard solution (1000 μg mL–1) was obtained from the National Analysis and Testing Center for Nonferrous Metals and Electronic Materials (China).
Surface water samples were collected from the Yangtze River in Nanjing, Jiangsu (marked as YRW), the Yellow River in Baotou, Inner Mongolia (HRW) and seawater from Tianjin (SW). Tap water (TW) was collected in Hohhot, Inner Mongolia. A small volume of high-concentration Pb2+ solution was added to each water sample to achieve a nominal Pb2+ concentration of ∼1000 μg L–1 (exact concentrations determined by measurement). The samples were then shaken and filtered through 0.45 μm filter membranes to obtain artificially contaminated surface water samples. The physicochemical parameters of these water samples were measured as follows: pH and total dissolved solids (TDS) were determined using electrode methods (pH meter FE28 and conductivity meter FE38, METTLER TOLEDO, Switzerland); and metal element concentrations were measured by inductively coupled plasma optical emission spectrometry (ICP-OES; Avio 200, PerkinElmer, USA). The results are presented in Table S1.
Preparation of activated mineral adsorbents
Mechanical activation (compositional and aggregation state regulation)
NC was mixed with DW at a mass ratio of 15:85 and stirred for 10 min to form a slurry. The slurry was passed through a 300 mesh sieve (≈ 48 μm). The retained fraction, mainly inert components such as quartz sand, was discarded. Approximately 500 g of the sieved slurry was then stirred at 10 000 rpm for 10 min using a high-speed mixer, followed by ultrasonication for 10 min (JY98-IIIDN, ultrasonic homogenizer, Shanghai Huxi Industry Co., Ltd, China; horn diameter: 20 mm; working power: 960 W; operating in 5 s on/5 s off cycles). The treated slurry was separated by centrifugation. The solid was dried, crushed and sieved through a 200 mesh sieve (≈ 75 μm). The resulting mechanically activated sample was designated as FNC.
Thermal activation (structural and surface chemical regulation)
FNC was transferred to a muffle furnace, heated to 600°C at 10°C min–1, held for 2 h and then naturally cooled to room temperature. The product was passed through a 200 mesh sieve (≈ 75 μm) and designated as FTNC. This thermal treatment removes channel water from attapulgite, activates cation-exchange sites and enhances negative surface charge. Additional characterization details are provided in the Supplementary Material.
Single-factor static adsorption experiments and model fitting
The effects of thermal activation temperature (300–900°C) and time (1–10 h) on maximum adsorption capacity were examined at a constant heating rate of 10°C min–1. A Pb2+ solution (200 mg L–1) was prepared by dissolving Pb(NO3)2 in DW and adjusted to pH 5.5. An aliquot of 20 mL of this solution was transferred to a 50 mL polypropylene centrifuge tube, and 0.01 g of adsorbent powder was added. The tube was sealed and shaken in a constant-temperature incubator at 25°C for 4 h. The Pb2+ concentration in the supernatant was then measured. Adsorption capacity (q, mg g–1) and removal efficiency (R, %) were calculated using Equations 1 & 2, respectively.
 \begin{equation}\textit{q}\text{\ =\ }\frac{\left({\textit{C}}_\text{0}\text{\ --\ }{\textit{C}}_\text{e}\right)\times\textit{V}}{\textit{m}}\end{equation}
 \begin{equation}\textit{R}\text{\ =\ }\frac{\left({\textit{C}}_\text{0}\text{\ --\ }{\textit{C}}_\text{e}\right)}{{\textit{C}}_\text{0}}\times\text{100\%}\end{equation}
where C 0 (mg L–1) is the initial Pb2+ concentration, C e (mg L–1) is the equilibrium concentration, V (mL) is the solution volume and m (g) is the adsorbent mass.
Using the same procedure, single-factor experiments were conducted to investigate the effects of initial pH, initial metal ions concentration, contact time and temperature on adsorption capacity. Adsorption isotherms were fitted with the Langmuir (Equation S1; Langmuir, Reference Langmuir1918; Abujayyab et al., Reference Abujayyab, Hasan, Arafat and Banat2025), Freundlich (Equation S2; Amor et al., Reference Amor, Messaitfa, Tabchouche, Abdeslam, Zighmi, Amor and Omar2025) and Temkin (Equation S3; Temkin & Pyzhev, Reference Temkin and Pyzhev1940; Wang et al., Reference Wang, Zhang, Fang, Li, Song and Han2025b) models. Kinetic data were analysed using pseudo-first-order (Equation S4) and pseudo-second-order (Equation S5) models. Thermodynamic parameters, including Gibbs free energy change (ΔG), enthalpy change (ΔH) and entropy change (ΔS), were calculated from the temperature-dependent adsorption data using linear fitting (Equations S6–S9). All model equations are provided in the Supplementary Material.
Adsorption efficiency evaluation experiments and adsorbate elution
For high-concentration Pb2+ adsorption, a Pb2+ solution (400 mg L–1; pH 5.5 ± 0.1, adjusted with dilute HNO3 or NaOH) was used. Various adsorbent dosages (0.5–3.0 g L–1) were added and shaken at 25°C for 4 h. Removal efficiency was calculated using Equation 2.
For low-concentration Pb2+ adsorption, a Pb2+ solution (1000 μg L–1; pH 5.5 ± 0.1) was mixed with adsorbent at 1.0 g L–1 and shaken at 25°C for 0–24 h. The residual Pb2+ concentration in the supernatant was measured.
The Pb2+-saturated adsorbent was collected, washed with DW and dried. A 0.1 g portion of the dried sample was added to 50 mL of dilute HNO3 at varying concentrations and stirred continuously for 2 h. After elution, the solid and liquid phases were separated by vacuum filtration. The solid was washed with DW, and the combined liquid fractions were diluted to 100 mL for Pb2+ concentration measurement. The solid was then completely digested using a HF–HNO3–HClO4 mixture under heating, and the Pb2+ concentration in the digestate was measured. Total Pb content was the sum of Pb in the liquid and solid fractions. Elution efficiency was calculated from the proportion of Pb remaining in the solid phase relative to total Pb, allowing identification of optimal elution conditions.
Removal of low-concentration Pb2+ from actual water samples
Water samples included DW, TW, YRW, HRW and SW. Each sample was spiked with Pb2+ to a nominal concentration of ∼1000 μg L–1, thoroughly shaken and filtered through 0.45 μm filter membranes. The three adsorbents (NC, FNC, FTNC) were then applied to these contaminated samples. Residual Pb2+ concentration in the supernatant was measured to evaluate purification performance.
Quantitative analysis
After adsorption, the mixture was filtered through a 0.45 μm syringe filter. The filtrate was diluted with 5% HNO3 as needed. Pb2+ concentration was determined by flame atomic absorption spectrometry (FAAS) for concentrations ≥1 mg L–1 (standard curve method, R 2 ≥ 0.999) or by inductively coupled plasma mass spectrometry (ICP-MS) for concentrations <1 mg L–1 (online internal standard calibration, standard curve method, R 2 ≥ 0.996). The concentrations of other soluble elements (Na, K, Mg, Ca, Si, Al and Fe) were measured by ICP-OES after solid–liquid separation and acidification.
Results and discussion
Structural regulation by combined mechanical and thermal activation
Raw low-grade attapulgite clay intergrowth (NC) shows three structural limitations: dilution of active components by inert minerals, burial of active surfaces by soft agglomerates and low specific surface area. A two-step activation – mechanical water-washing disaggregation followed by thermal treatment – was applied to progressively reconstruct the material structure.
Mechanical dispersion: removal of inert components and exposure of active surfaces
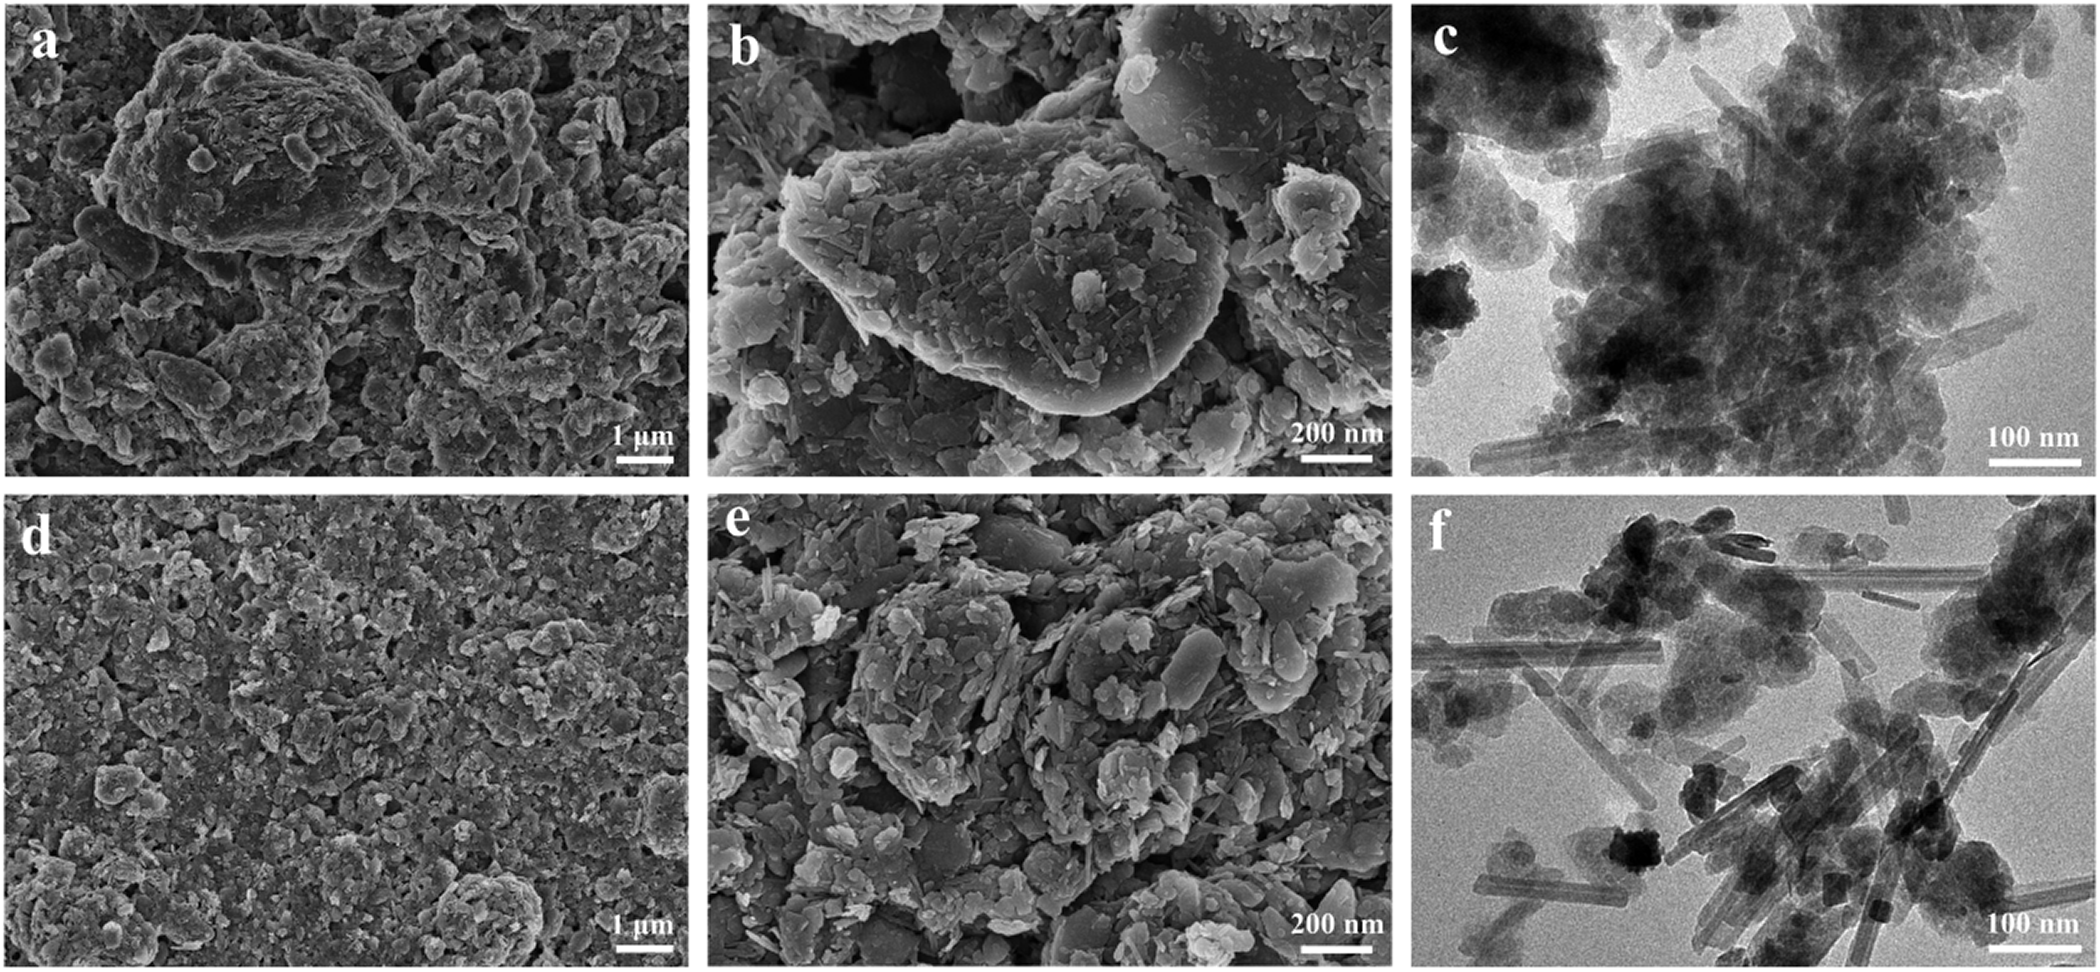
Mechanical disaggregation (water washing, high-speed stirring, ultrasonication) was first applied. Scanning electron microscopy (SEM) images of NC (Fig. 1a,b) show rod-like, flaky and blocky particles, corresponding to attapulgite, chlorite, calcite and quartz – a morphology typical of closely intergrown multi-mineral phases. Pronounced soft agglomeration and densely packed large aggregates are visible, indicating that the physical aggregation state causes functional dilution of active components (attapulgite, chlorite, calcite) by inert components (quartz) and burial of active surfaces. Transmission electron microscopy (TEM) images (Fig. 1c) further confirm the presence of rod-like crystals and their bundles, with significant particle agglomeration.
SEM images of (a,b) NC and (d,e) FNC; TEM images of (c) NC and (f) FNC.

After mechanical treatment, soluble salts were removed. The shear stress from high-speed stirring combined with ultrasonication-induced micro-vibrations partially disrupted particle agglomeration, disintegrating dense, large aggregates (Fig. 1d,e). The resulting sample was designated FNC. Comparative TEM images (Fig. 1f) show significantly improved dispersion of rod-like crystallites and their bundles in FNC, indicating that water washing and mechanical activation reduce particle agglomeration and increase mineral dispersion.
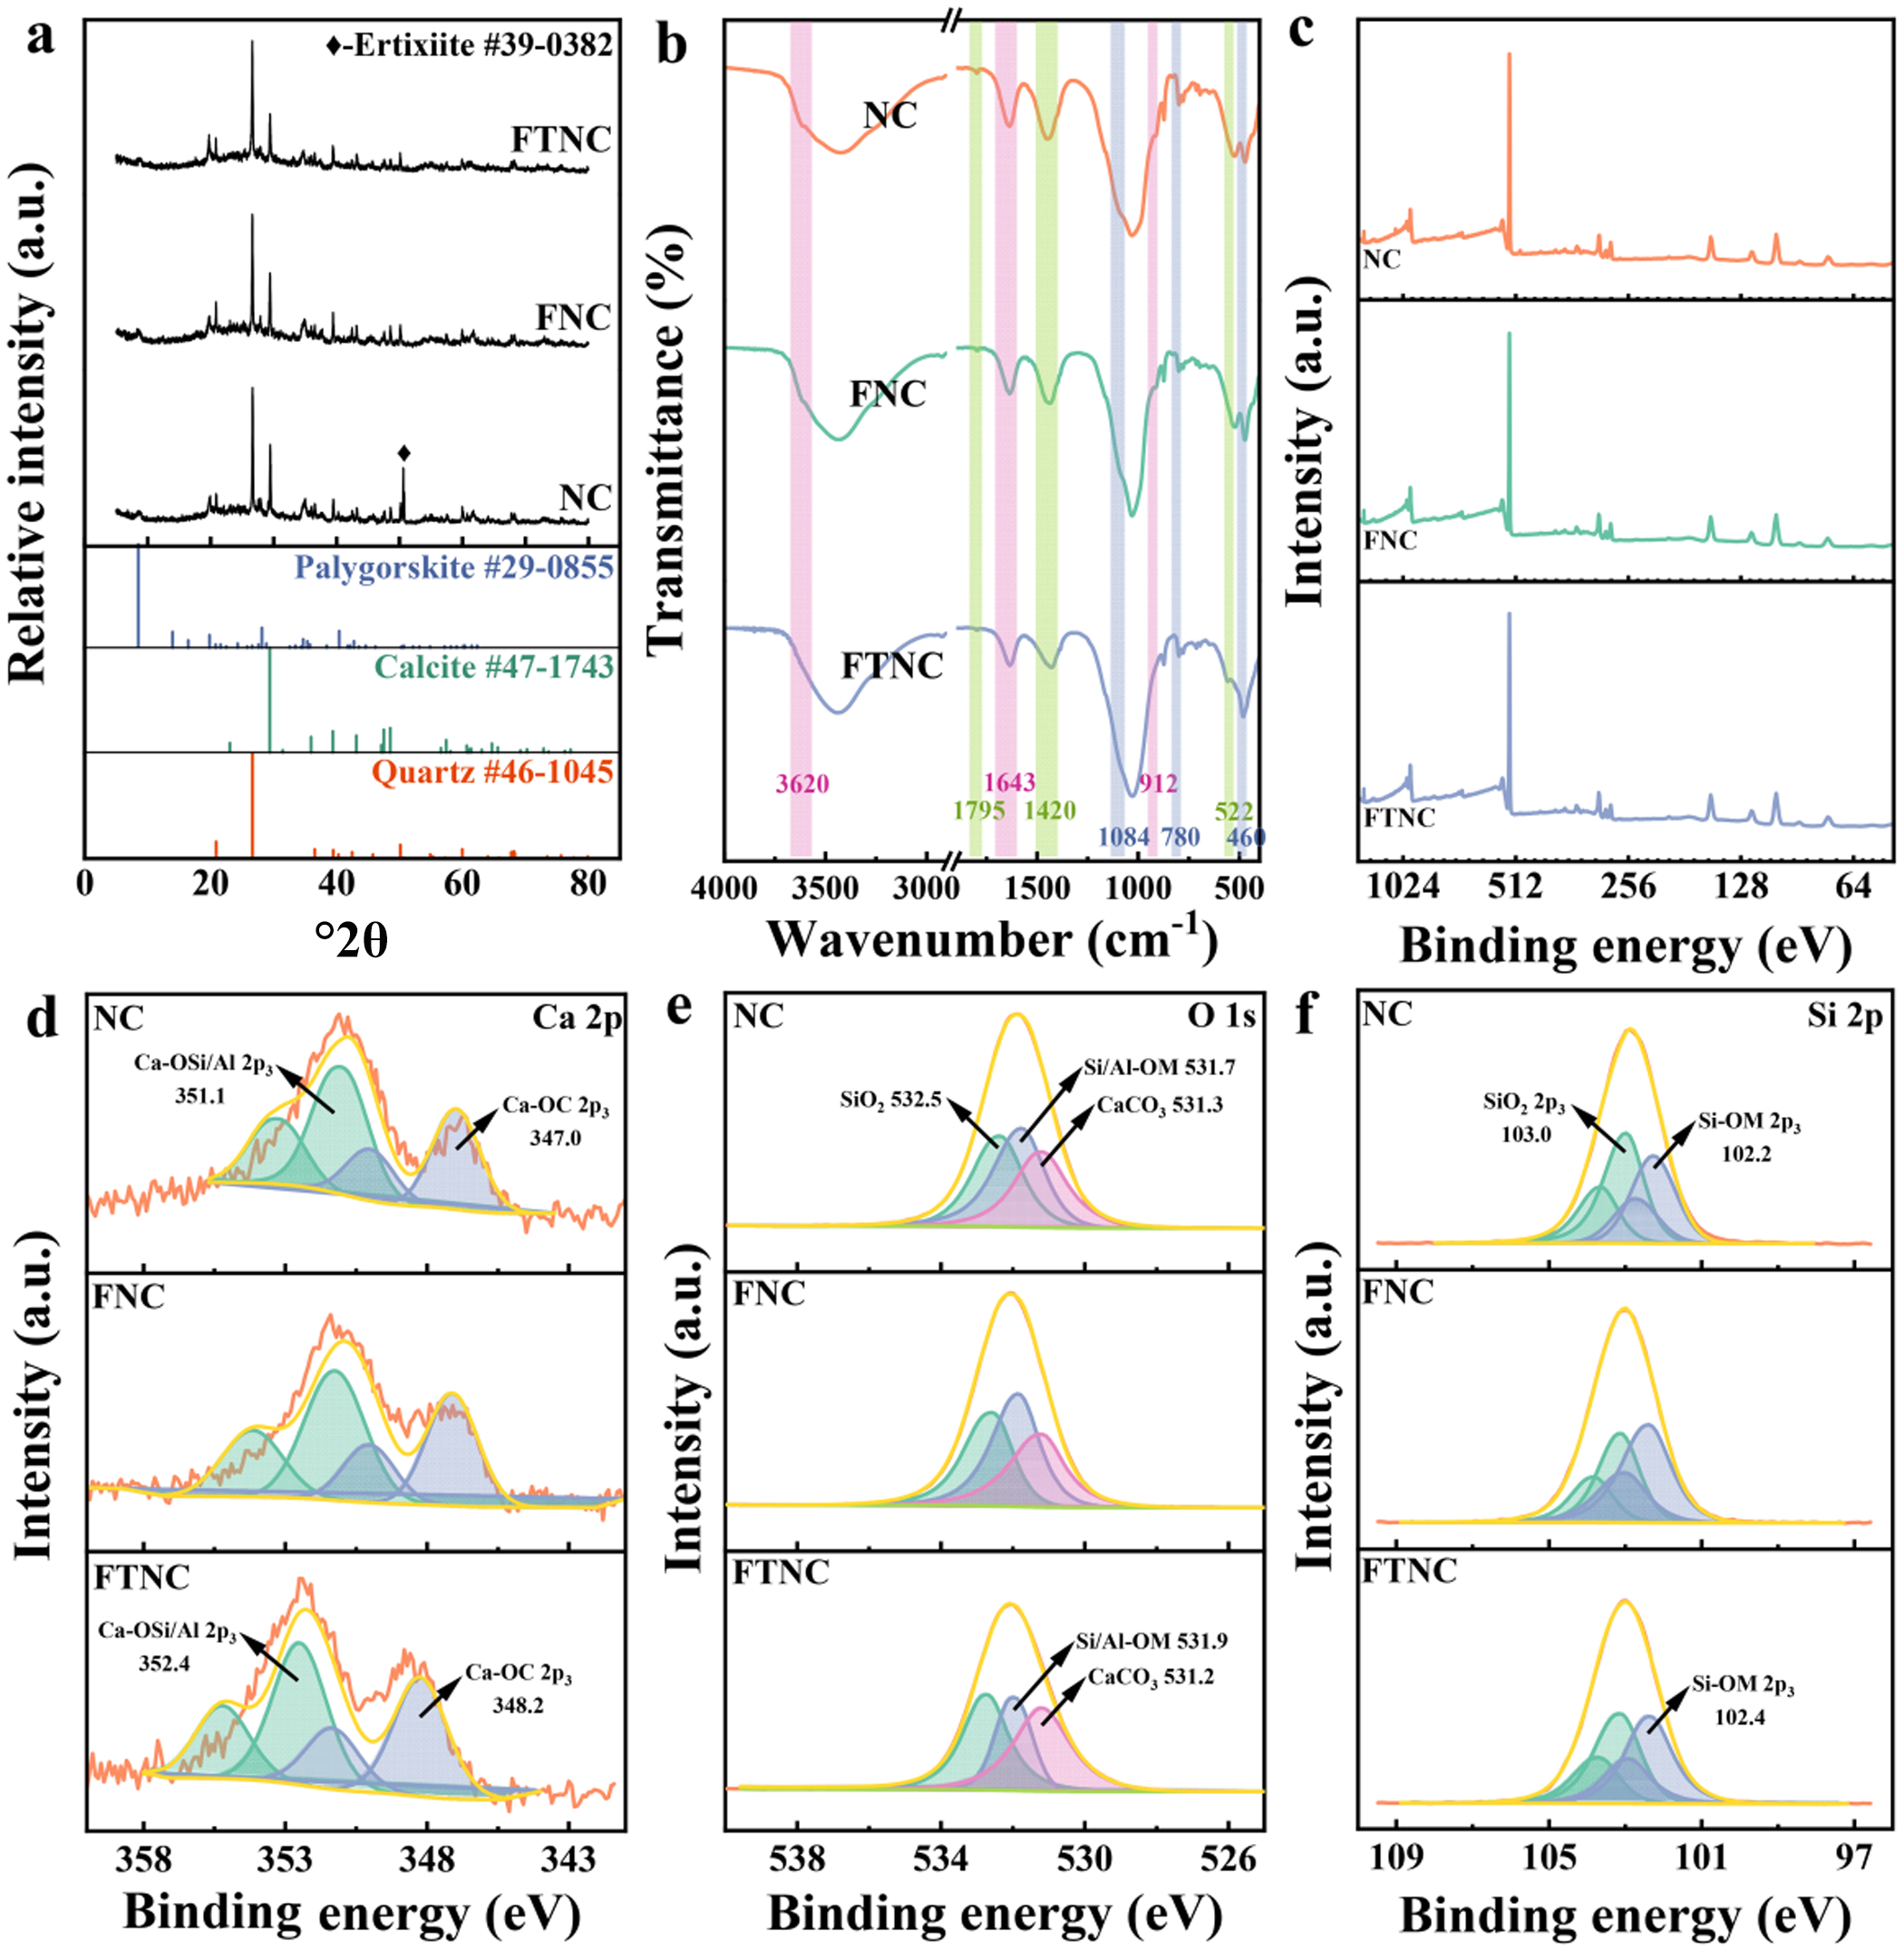
Mineral composition changes were characterized by X-ray diffraction (XRD) and X-ray fluorescence (XRF) analyses. XRD traces (Fig. 2a) confirm the multi-mineral composition of NC, with characteristic diffraction peaks matching quartz (Joint Committee on Powder Diffraction Standards (JCPDS) No. 46-1045; Fan et al., Reference Fan, Liu, Yang, Liu, Ma and Fu2025), calcite (JCPDS No. 47-1743; Ali et al., Reference Ali, Al-Meer, Nasser and Hussein2025), illite (Kadir et al., Reference Kadir, Erkoyun, Külah, Eren, Helvacı and Demiral2025) and attapulgite (JCPDS No. 29-0855; Chen et al., Reference Chen, Jin, Wu and Yan2025). After high-speed stirring, the quartz peak intensity at 26.6°2θ decreased in FNC, indicating partial removal of quartz impurities. A strong diffraction peak near 50.6°2θ in NC disappeared after treatment, probably due to removal of soluble sodium silicates. XRF quantitative analysis (Table S1) shows that Na2O content decreased from 0.82% to 0.38%, confirming the removal of soluble salts. The normalized SiO2 content remained at ∼51.3% after water washing.
(a) XRD traces, (b) FTIR spectra and (c) XPS survey spectra of NC, FNC and FTNC. Fine XPS spectra of (d) Ca 2p, (e) O 1s and (f) Si 2p for the same samples.

Figure 2 Long description
The image A showing three stacked line traces labeled FTNC, FNC and NC. The x-axis is labeled 2 theta, ranging from 0 to 80 with tick marks at 0, 20, 40, 60 and 80. The y-axis is labeled Relative intensity in a.u. Three reference stick patterns appear below the traces with labels Palygorskite number 29-0855, Calcite number 47-1747 and Quartz number 46-1045. The NC trace shows multiple sharp peaks across the range, including a tall peak near 20 and additional peaks near the mid and higher angles. The FNC trace shows sharp peaks with a prominent peak near 20 and fewer visible peaks than NC. The FTNC trace shows smaller peaks with a prominent peak near 20 and additional smaller peaks at higher angles. The image B showing three stacked spectra labeled NC, FNC and FTNC. The x-axis is labeled Wavenumber in centimeter superscript minus 1, ranging from 4000 at the left to 500 at the right, with labeled ticks at 4000, 3500, 3000, 2500, 2000, 1500, 1000 and 500. The y-axis is labeled Transmittance in percent. Each spectrum contains multiple downward bands. Numeric labels visible near bands include 3620, 1643, 1795, 1420, 1087, 780, 694 and 522. The image C showing three stacked line spectra labeled NC, FNC and FTNC. The x-axis is labeled Binding energy in electron volt, ranging from 1024 at the left to 64 at the right, with labeled ticks at 1024, 512, 256, 128 and 64. The y-axis is labeled Intensity in a.u. The NC spectrum shows a strong peak near the left side and several smaller peaks toward the right. The FNC spectrum shows a tall narrow peak near the left side and smaller peaks at higher binding energy positions. The FTNC spectrum shows a tall narrow peak near the left side and additional smaller peaks toward the right. The image D showing three stacked fitted spectra labeled NC, FNC and FTNC with the region label Ca 2p. The x-axis is labeled Binding energy in electron volt, ranging from 358 at the left to 343 at the right, with labeled ticks at 358, 353, 348 and 343. The y-axis is labeled Intensity in a.u. Each row shows an orange measured curve over multiple filled component peaks and a smooth fitted envelope. Text labels visible include Ca-O-Si 2p 351.7 and Ca-O-C 2p 347.0 in the NC row and Ca-O-Si 2p 352.4 and Ca-O-C 2p 348.2 in the FTNC row. The image E showing three stacked fitted spectra labeled NC, FNC and FTNC with the region label O 1s. The x-axis is labeled Binding energy in electron volt, ranging from 538 at the left to 526 at the right, with labeled ticks at 538, 534, 530 and 526. The y-axis is labeled Intensity in a.u. Each row shows an orange measured curve over filled component peaks and a smooth fitted envelope. Text labels visible include SiO2 532.5, Si-Al-OH 531.7 and CaCO3 531.3 in the NC row and Si-Al-OH 531.9 and CaCO3 531.2 in the FTNC row. The image F showing three stacked fitted spectra labeled NC, FNC and FTNC with the region label Si 2p. The x-axis is labeled Binding energy in electron volt, ranging from 109 at the left to 97 at the right, with labeled ticks at 109, 105, 101 and 97. The y-axis is labeled Intensity in a.u. Each row shows an orange measured curve over filled component peaks and a smooth fitted envelope. Text labels visible include SiO2 2p 103.0 and Si-O-M 2p 102.2 in the NC row and Si-O-M 2p 102.4 in the FTNC row.
Fourier-transform infrared (FTIR) spectra (Fig. 2b) further confirmed these compositional changes. The FTIR spectrum of NC show an O–H stretching vibration near 3620 cm–1 (internal water or hydroxyl groups in silicates), a Si–O stretching vibration at 1084 cm–1 (SiO4 tetrahedra; Zhou et al., Reference Zhou, Zhang, Pang, Zhang, Zhou and Ma2025) and C=O stretching near 1795 cm–1. Carbonate-related bands appeared at 1420 cm–1 (CO32– antisymmetric stretching) and 522 cm–1 (out-of-plane rocking; Peng et al., Reference Peng, Chen, Wu, Chen and Wang2025). Quartz gives Si–O–Si symmetric stretching bands at 798 and 779 cm–1 and a characteristic band at 460 cm–1. After treatment, the quartz-related bands (798, 779 and 522 cm–1) were weakened in FNC, consistent with the XRD results.
X-ray photoelectron spectroscopy (XPS) survey spectra (Fig. 2c) show no significant differences among the three samples, as expected for physical activation. In NC, the C 1s core-level spectrum (Fig. S1) shows a peak at 289.4 eV. Ca exists in two chemical forms: carbonate (calcite) and calcium in silicate/aluminosilicate minerals. The Ca 2p spectrum (Fig. 2d) resolves two components: Ca–OC at 347.0 and 350.1 eV (Sosulnikov & Teterin, Reference Sosulnikov and Teterin1991) and Ca–O(Si/Al) at 351.1 and 353.4 eV (Seyama & Soma, Reference Seyama and Soma1984). The O 1s spectrum (Fig. 2e) show three oxygen species: Si–O–Si in quartz at 532.5 eV, Si/Al-OM (M = Mg, Fe, Ca, Na) in silicate or aluminosilicate at 531.6 eV and carbonate oxygen at 531.2 eV (Wang et al., Reference Wang, Zhao, Zhang, Xu, Zong, Kang and Wang2021). The Si 2p spectrum (Fig. 2f) shows peaks at 103.0 eV (Si–O bonds in quartz) and 102.2 eV (Si–O–M bonds in silicates). After treatment, the O 1s peak at 532.5 eV decreases in FNC (Fig. 2e), and the Si 2p peaks at 103.0 eV (Si 2p) and 103.7 eV (Si 2p) also decrease (Fig. 2f), indicating removal of larger quartz particles.
Mechanical disaggregation thus partially removes inert quartz and soluble salts, increasing the relative content of active phases (attapulgite, chlorite, calcite), and disrupts soft agglomerates to expose active surfaces.
Thermal activation
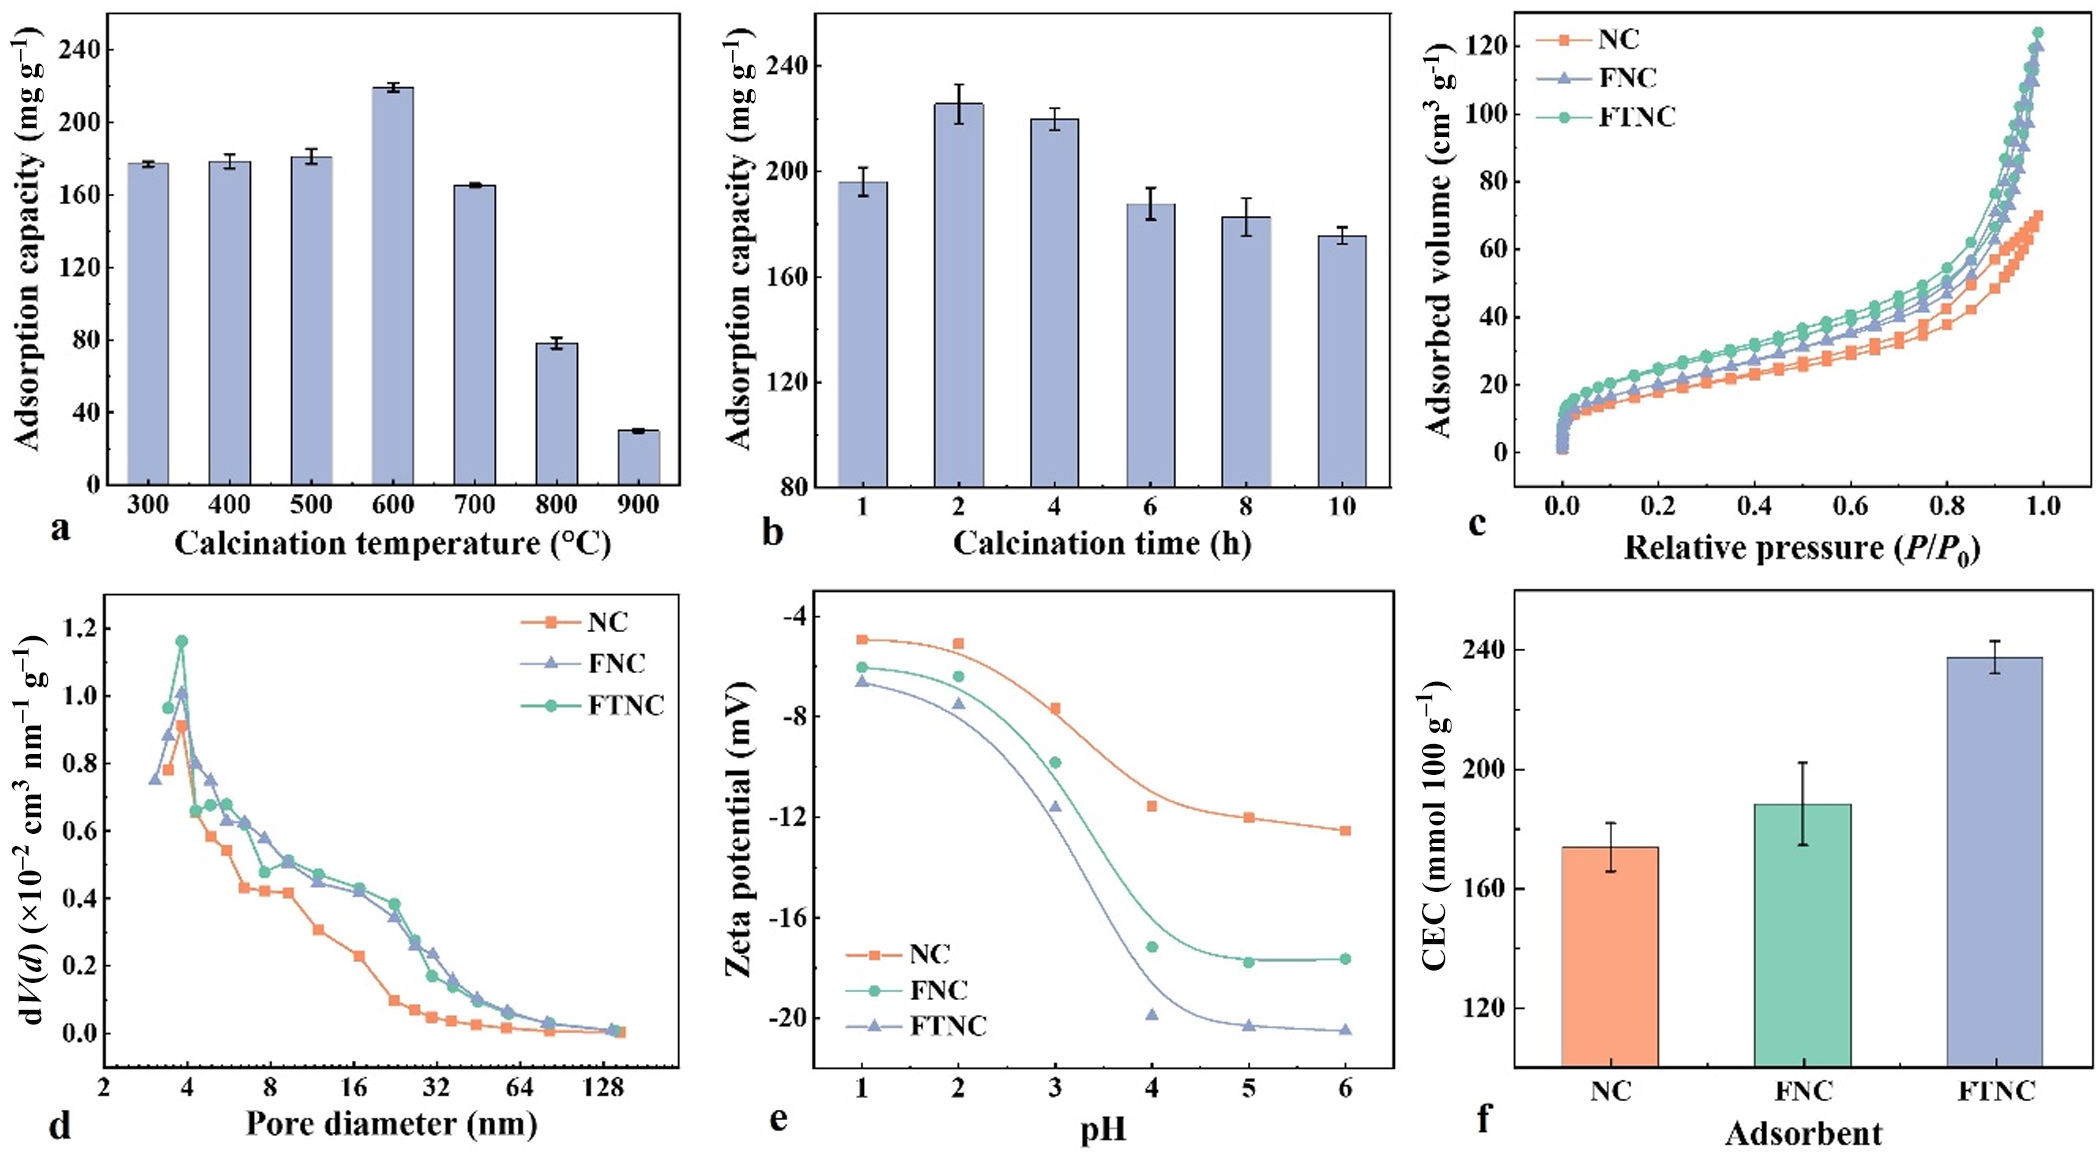
On the basis of the optimized composition and aggregation state, controlled thermal treatment was employed to regulate structure and surface. Calcination conditions were first optimized using the Pb2+ adsorption capacity of FTNC (Fig. 3a,b). At a holding time of 2 h, adsorption capacity increases with temperature from 300°C to 600°C, reaching a maximum of 219.4 mg g–1 at 600°C, then drops sharply to 30.1 mg g–1 at 900°C. At 600°C, extending the holding time from 1 to 10 h gives a maximum of 225.7 mg g–1 at 2 h. Below 600°C, removal of channel water from attapulgite and lattice distortion of calcite activate adsorption sites. Above 800°C, calcite decomposition (CaCO3 → CaO + CO2) eliminated the dominant carbonate active phase. The optimal conditions are therefore 600°C and 2 h.
(a,b) Influence of calcination temperature and time on adsorption capacity, (c) N2 adsorption–desorption isotherm, (d) pore-size distribution curve, (e) zeta potential and (f) CEC values of NC, FNC and FTNC.

Figure 3 Long description
Multiple graphs analyzing NC, FNC and FTNC. Graph A: A bar graph showing adsorption capacity in mg per g against calcination temperature in degrees Celsius, ranging from 300 to 900. Adsorption peaks at 600 with 219.4 mg per g, then drops at 900. Graph B: A bar graph showing adsorption capacity in mg per g against calcination time in hours, ranging from 1 to 10. The peak is at 2 hours with 225.7 mg per g. Graph C: A line graph showing adsorbed volume in cm cubed per g against relative pressure P divided by P0, ranging from 0.0 to 1.0. NC, FNC and FTNC lines rise steadily. Graph D: A line graph showing dV divided by d log D in cm cubed per g nm against pore diameter in nm, ranging from 4 to 128. NC, FNC and FTNC show similar trends with peaks around 32 nm. Graph E: A line graph showing zeta potential in mV against pH, ranging from 1 to 7. NC, FNC and FTNC show decreasing trends, with NC having the highest potential. Graph F: A bar graph showing CEC in cmol per kg for NC, FNC and FTNC. FTNC has the highest value, followed by FNC and NC. Each graph uses different markers to distinguish NC, FNC and FTNC datasets.
XRD traces after thermal activation (Fig. 2a) show reduced intensities of calcite (29.4°2θ) and attapulgite (8.5°2θ), but no disappearance, indicating that 600°C is insufficient to decompose CaCO3 but may cause partial amorphization (Zunino et al., Reference Zunino, Boehm-Courjault and Scrivener2020). Zeolitic and bound water in attapulgite are removed while the mineral framework is preserved (Boudriche et al., Reference Boudriche, Calvet, Hamdi and Balard2012). The normalized silicon content increased by ∼1% (Table S1), probably due to loss of other components (water, CO2) during heating rather than actual Si enrichment.
FTIR spectroscopy analysis (Fig. 2b) shows weakened silicate (1084 cm–1) and carbonate (1420 cm–1) bands in FTNC, consistent with the XRD results. XPS analysis provided evidence of lattice distortion and site activation. In the C 1s spectrum (Fig. S1), the signal at 289.4 eV decreases in FTNC. After activation, the Ca 2p binding energy shifts by +1.2 eV (Fig. 2d), which could increase Ca ion-exchange activity. In the O 1s spectrum (Fig. 2e), the Si/Al-OM peak (531.6 eV) decreases and shifts by +0.2 eV, suggesting thermal-induced lattice distortion that may generate defects and activate reactive sites. The carbonate peak at 531.2 eV shifts by –0.1 eV with little intensity change, indicating lattice distortion without decomposition. In the Si 2p spectrum (Fig. 2f), the silicate peak at 102.2 eV shifts by +0.2 eV, further confirming this lattice distortion.
Thermal activation at 600°C thus induces lattice distortion in attapulgite and calcite without phase decomposition while removing channel water to clear pores. These effects activate reactive sites while preserving the mineral framework.
Pore architecture and surface chemical properties
N2 adsorption–desorption isotherms (Fig. 3c) show that NC exhibits a Type IV isotherm with an H3 hysteresis loop, indicating heterogeneous pore structures (Sing et al., Reference Sing, Everett, Haul, Moscou, Pierotti, Rouquerol and Siemieniewska1985; Kutluay & Ece, Reference Kutluay and Ece2025). At P/P 0 ≤ 0.40, the adsorption and desorption branches coincide, indicating monolayer adsorption and the presence of micropores (Storck et al., Reference Storck, Bretinger and Maier1998). When P/P 0 exceeds 0.4, N2 adsorption increases markedly, attributed to capillary condensation in mesopores and macropores (Bakandritsos et al., Reference Bakandritsos, Steriotis and Petridis2004), suggesting the presence of slit-like, narrow meso-/macropores within the aggregated silicate particles.
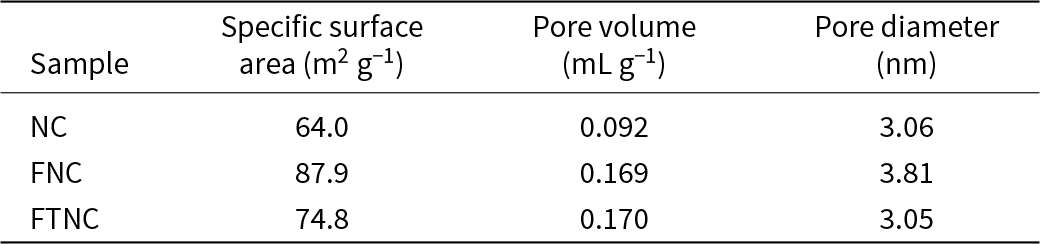
NC has a specific surface area of 64.0 m2 g–1 and a pore volume of 0.092 mL g–1 (Table 1), consistent with severe agglomeration. After mechanical disaggregation (FNC), the specific surface area increases to 87.9 m2 g–1 (increase of 37%) and the pore volume increases to 0.169 mL g–1. Pore-size distribution (Fig. 3d) shows an increased proportion of pores in the 8–50 nm range, indicating the exposure of previously buried pores. After thermal activation at 600°C (FTNC), the specific surface area (74.8 m2 g–1) is slightly lower than that of FNC (87.9 m2 g–1), but the pore volume (0.170 mL g–1) remains similar. The pore-size distribution becomes more dispersed (Fig. 3d), with more pores in the 8–50 nm range. The isotherm remains Type IV with an H3 hysteresis loop, indicating that the intrinsic pore structure is not destroyed. Some micropores collapse due to lattice distortion during heating, but pore channel clearance (removal of zeolitic and bound water) compensates for this loss.
Specific surface area and pore-structure parameters.

Zeta-potential measurements (Fig. 3e) show that at pH 5, FTNC has a zeta potential of –20.4 mV, lower than those of NC (–12.0 mV) and FNC (–17.8 mV). All three samples are negatively charged in the pH range 1–6, enabling electrostatic attraction of Pb2+. The CEC values (mmol 100 g–1) of FNC and NC are negligible compared to that of FTNC (Fig. 3f), indicating that thermal treatment activates previously dormant exchange sites (Nel et al., Reference Nel, Bruneel and Smolders2023).
Adsorption behaviour
Effect of initial pH
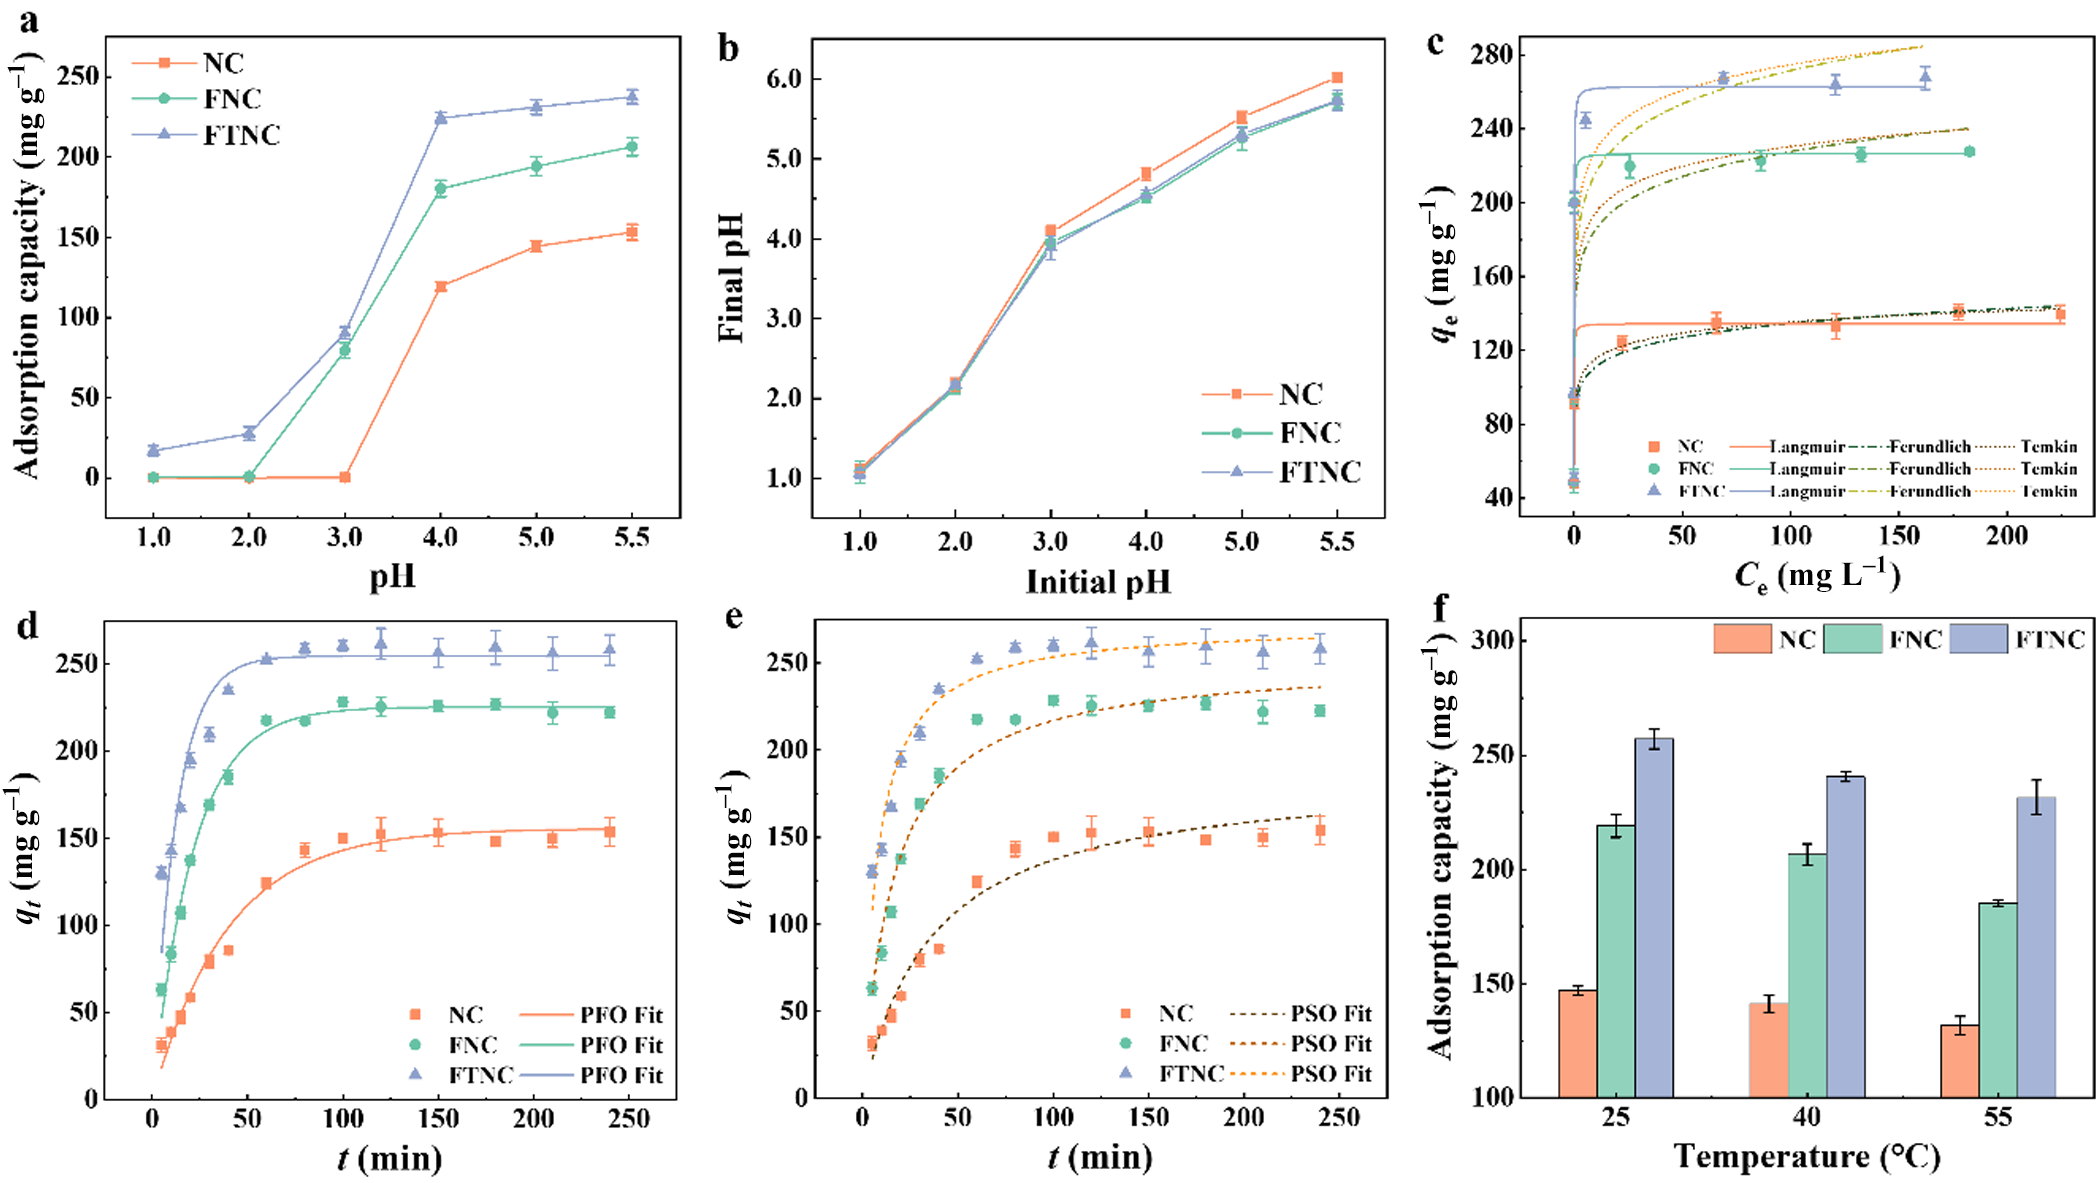
The effect of initial pH on Pb2+ adsorption (200 mg L–1 initial concentration of Pb, 25°C, 0.5 g L–1 feed ratio) is shown in Fig. 4a. For all three samples, adsorption capacity increases with pH and plateaus at higher pH. The maximum adsorption capacities at pH 5.5 are 153.1 mg g–1 (NC), 206.4 mg g–1 (FNC) and 237.5 mg g–1 (FTNC). At pH 3.0, NC shows no adsorption, whereas FNC and FTNC achieve adsorption capacities of 79.4 and 90.2 mg g–1, respectively, indicating improved pH tolerance after mechanical activation. FTNC maintains effective adsorption even at pH 1–2, demonstrating that thermal treatment activates high-affinity Pb2+ binding sites that remain effective at high H+ concentrations. FTNC reaches adsorption equilibrium at pH 4.0, while NC still shows a 28.6% increase in adsorption capacity from pH 4.0 to 5.5.
(a) Effect of initial pH on Pb2+ adsorption and (b) the corresponding final pH; (c,d) adsorption isotherms and model fits; (e) adsorption kinetics and model fits; and (f) effect of temperature on adsorption. PFO = pseudo-first-order; PSO = pseudo-second-order.

Figure 4 Long description
Six graphs detailing the adsorption characteristics of NC, FNC and FTNC samples. Graph (a) shows adsorption capacity (mg/g) on the y-axis against pH on the x-axis, ranging from 1.0 to 5.5. Adsorption capacity increases with pH, peaking at pH 5.5 for all samples. Graph (b) presents final pH on the y-axis versus initial pH on the x-axis, showing a linear increase. Graph (c) displays adsorption isotherms with q subscript e (mg/g) on the y-axis and C subscript 0 (mg/L) on the x-axis. The curves fit Langmuir and Freundlich models, with FTNC showing the highest capacity. Graph (d) illustrates adsorption kinetics with q subscript t (mg/g) on the y-axis and time (minutes) on the x-axis, fitting pseudo-first-order and pseudo-second-order models. Graph (e) also shows kinetics with q subscript t (mg/g) on the y-axis and time (minutes) on the x-axis, highlighting model fits. Graph (f) is a bar chart showing adsorption capacity (mg/g) on the y-axis against temperature (degrees Celsius) on the x-axis, with FTNC having the highest capacity at all temperatures. The graphs collectively demonstrate the influence of pH, concentration, time and temperature on adsorption, with FTNC generally outperforming NC and FNC across conditions.
Final pH values after adsorption are shown in Fig. 4b & Table S1. At initial pH ≤ 2.0, the final pH is only slightly higher. At initial pH 3.0, the final pH rises to 3.89–4.08. This increase is attributed to carbonate dissolution (consuming H+) and Pb2+ adsorption (reducing free Pb2+ and increasing OH– activity). In the initial pH range 4.0–5.5, the final pH increases only slightly, probably because the acidity is insufficient to disrupt the carbonate structure; the pH change reflects Pb2+ adsorption and the release of soluble alkaline species.
Ca release into the supernatant was measured at various initial pH values (Fig. S2). At pH ≤ 2.0, Ca concentration is highest, mainly from acid-induced dissolution of Ca-containing minerals. NC releases more Ca than FNC and FTNC, indicating that soluble Ca salts in NC are removed during washing. FNC and FTNC show similar Ca release at this stage, but only FTNC adsorbs Pb2+, suggesting that adsorption at low pH is not primarily due to Ca ion exchange. At pH 3.0, Ca dissolution decreases, although some Ca is released via ion exchange. At pH 4.0–5.5, free Ca increases slightly with pH but remains much lower than at pH ≤ 3.0, indicating that acidity no longer breaks down Ca-containing phases; most of the free Ca comes from ion exchange.
Adsorption isotherms
Adsorption isotherms were obtained at 25°C using Pb2+ solutions at pH 5.5 with initial concentrations of 25–300 mg L–1 and an adsorbent dosage of 0.5 g L–1 (Fig. 4c). Equilibrium adsorption capacities (q e) are 140.8 mg g–1 (NC), 227.9 mg g–1 (FNC) and 267.6 mg g–1 (FTNC), increasing progressively with activation. The Langmuir model gives the highest R 2 values (0.9718–0.9774) for all samples, indicating monolayer adsorption on uniform active sites. Langmuir maximum capacities (q m) are 134.5 mg g–1 (NC), 226.7 mg g–1 (FNC) and 263.2 mg g–1 (FTNC), matching the experimental values.
The Langmuir constant KL decreased with activation: from 25.42 L mg–1 (NC) to 22.77 L mg–1 (FNC) and further to 19.76 L mg–1 (FTNC), indicating that the ions adsorbed on FTNC are mainly in an adsorbed state (Balmer, Reference Balmer2011). The Temkin parameter b, related to adsorption heat, also decreased from 287.29 to 122.80 J mol–1 after activation (Table S3), indicating reduced surface energy heterogeneity. Macroscopic adsorption capacity q m can be viewed as the product of the number of adsorption sites and the probability that those sites are occupied (Ivanović et al., Reference Ivanović, Tomović, Popović, Miladinović, Arrad and Miladinović2025). Although the occupation probability (reflected by KL) decreases after activation, the total number of accessible sites increases, leading to a net increase in q m (from 134.5 to 263.2 mg g–1). This suggests that synergistic activation primarily increases site quantity rather than site affinity, shifting the energy distribution from a few high-energy sites to a large number of moderately uniform sites.
Adsorption kinetics
Adsorption kinetics were measured using 200 mg L–1 Pb2+ at pH 5.5 with 0.5 g L–1 adsorbent at 25°C (Fig. 4d,e). All three samples show rapid adsorption within the first 60 min, followed by slower uptake from 60 to 120 min, reaching equilibrium at 120 min. Equilibrium capacities (q e) are 153.9 mg g–1 (NC), 228.4 mg g–1 (FNC) and 261.6 mg g–1 (FTNC). During the 60–120 min period, NC gains 18.2% of its equilibrium capacity, whereas FNC and FTNC gain only 3.5% and 3.6%, respectively, indicating that activated samples approach equilibrium much earlier. Kinetic parameters (Table S4) show that the pseudo-first-order model yields R 2 values of 0.9796–0.9899, while the pseudo-second-order model yields values of 0.9514–0.9674. Both models fit the data reasonably well, reflecting the complexity of solid–liquid adsorption. As noted by Vareda (Reference Vareda2023), when both adsorbate and active sites are limited, the kinetics may exhibit pseudo-second-order characteristics. However, relying solely on R 2 to distinguish between kinetic models is insufficient, because diffusion and other non-ideal processes also influence the overall rate (Simonin, Reference Simonin2016). The rate constant k1 increases from 0.0252 min–1 (NC) to 0.0468 min–1 (FNC) and 0.0805 min–1 (FTNC), confirming that activation increases mass transfer efficiency by exposing more active sites and shortening diffusion pathways.
Adsorption thermodynamics
Adsorption thermodynamic experiments were conducted at 298.15, 313.15 and 328.15 K (Fig. 4f & Table S5). As temperature increased from 25°C to 55°C, equilibrium adsorption capacity (q e) decreased: from 146.95 to 131.64 mg g–1 for NC, from 219.16 to 185.22 mg g–1 for FNC and from 257.11 to 231.45 mg g–1 for FTNC, indicating an exothermic adsorption process. Thermodynamic parameters derived from ln(q e/C e) vs 1/T plots (Fig. S5) confirm exothermicity, with negative ΔH values ranging from –4.72 to –8.58 kJ mol–1, following the order FTNC > FNC > NC. Negative ΔS values (–14.29 to –21.25 J (mol K–1)–1) suggest reduced randomness at the solid–liquid interface, implying ordered arrangement of adsorbed ions. Negative ΔG values at all temperatures confirm spontaneity; |ΔG| decreases with rising temperature, reflecting diminished spontaneity at higher temperatures. The |ΔG| values for FTNC (3.28–2.81 kJ mol–1) are consistently larger than those for FNC (2.25–1.61 kJ mol–1) and NC (0.46–0.03 kJ mol–1), indicating a stronger thermodynamic driving force for Pb2+ adsorption after activation. The ΔG values fall within –20 to 0 kJ mol–1, suggesting that adsorption is primarily governed by physisorption or weak chemical interactions, with lower temperatures being thermodynamically favourable for Pb2+ removal.
Deep purification capability
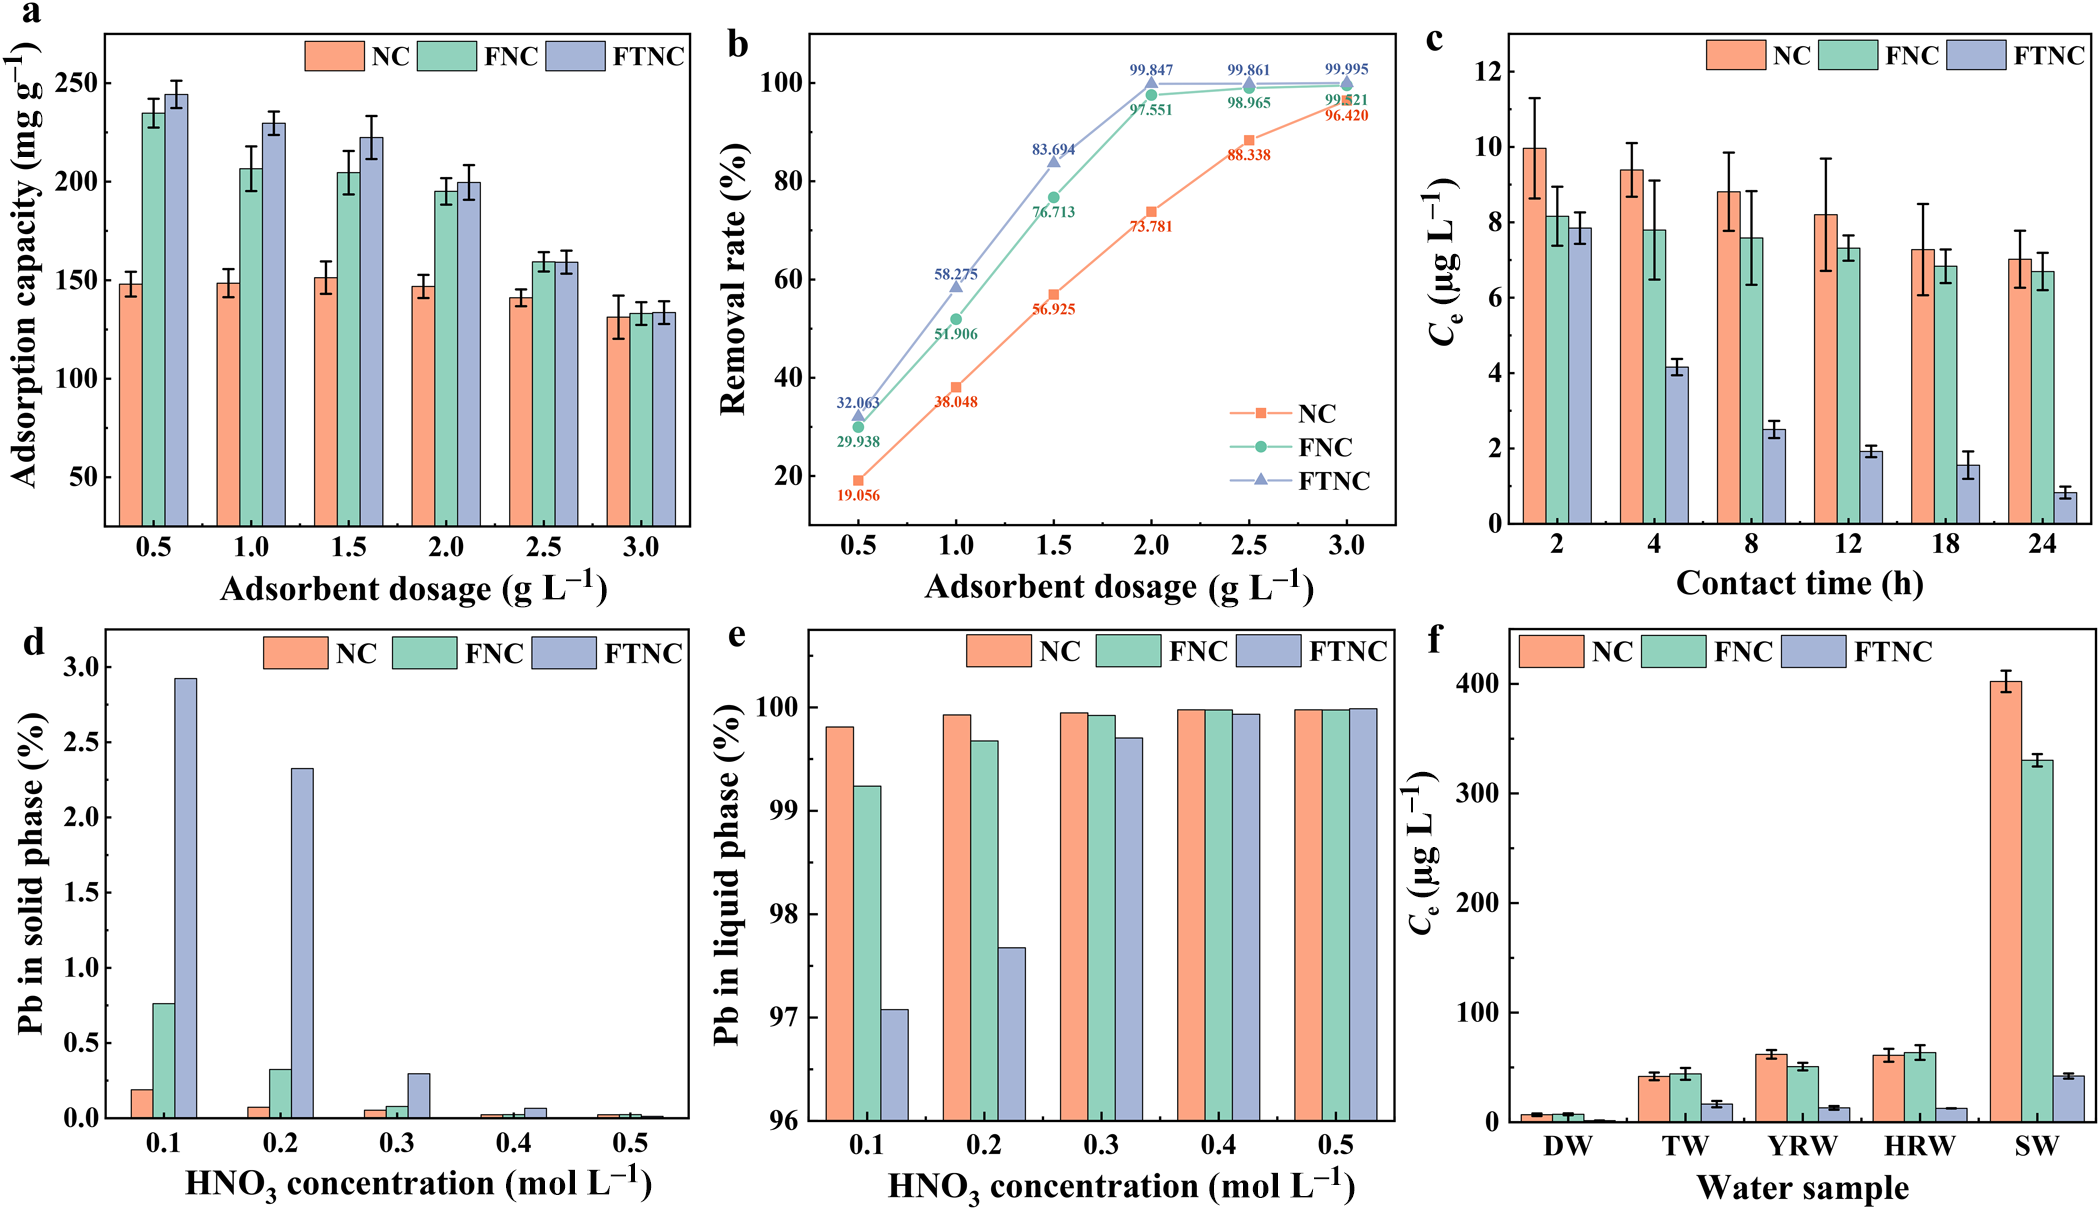
The removal performance of the adsorbents was evaluated at pH 5.5 and 25°C under high-concentration (400 mg L–1) and low-concentration (1000 μg L–1) Pb2+ conditions. For high-concentration Pb2+, adsorbent dosage was varied from 0.5 to 3.0 g L–1 (Fig. 5a,b). At 3.0 g L–1, removal efficiencies reach 96.42% (NC), 99.52% (FNC) and >99.99% (FTNC). FTNC achieves 99.85% removal at the lower dosage of 2.0 g L–1, indicating that activation improves the utilization efficiency of active sites. This enhancement results from mechanical disaggregation (exposing buried surfaces) and thermal activation (increasing accessible binding site density).
(a) Effect of adsorbent dosage on adsorption capacity; (b) effect of adsorbent dosage on removal efficiency; (c) residual Pb2+ concentration over time at low initial concentration; (d) residual Pb2+ on adsorbent after elution with various HNO3 concentrations; (e) Pb recovery rate in leachate after elution with various HNO3 concentrations; and (f) residual Pb2+ concentration in real water samples after adsorption.

Figure 5 Long description
1. Bar graph showing adsorption capacity versus adsorbent dosage (g L minus 1) from 0.5 to 3.0. Adsorption capacity increases with dosage, with FTNC showing the highest capacity. 2. Line graph showing removal rate (percent) versus adsorbent dosage (g L minus 1) from 0.5 to 3.0. Removal rate increases with dosage, with FTNC achieving over 99 percent at 3.0 g L minus 1. 3. Bar graph showing C subscript t (mg L minus 1) versus contact time (h) from 2 to 24. C subscript t decreases over time, with FTNC showing the lowest values. 4. Bar graph showing Pb in solid phase (percent) versus HNO subscript 3 concentration (mol L minus 1) from 0.1 to 0.5. FTNC retains the most Pb in the solid phase. 5. Bar graph showing Pb in liquid phase (percent) versus HNO subscript 3 concentration (mol L minus 1) from 0.1 to 0.5. FTNC shows the least Pb in the liquid phase. 6. Bar graph showing C subscript t (microgram L minus 1) versus water sample types (DW, TW, YRW, HRW, SW). FTNC consistently shows the lowest C subscript t across samples. NC, FNC and FTNC are distinguished by different bar styles and line markers.
For the low-concentration Pb2+ solution (1000 μg L–1) with an adsorbent dosage of 1.0 g L–1 (Fig. 5c), all three materials reduced the Pb2+ concentration to below the World Health Organization (WHO) drinking water guideline of 10 μg L–1 within 2 h, confirming their baseline capability for deep purification. After 24 h, however, the residual Pb2+ concentration with FTNC was 0.83 μg L–1, markedly lower than those with NC (7.02 μg L–1) and FNC (6.69 μg L–1). This difference points to a key mechanistic distinction: while both FNC and FTNC possess sufficient active sites for rapid initial uptake, FTNC’s thermally activated structure appears to offer not only more sites but also stronger binding affinity for trace-level Pb2+, allowing effective capture even under an extremely low concentration gradient. By contrast, the slower kinetics and weaker binding of NC and FNC prevent them from driving the concentrations down to sub-μg L–1 levels within the same timeframe.
Elution of Pb2+ and purification of contaminated water samples
Elution of the adsorbed Pb2+ was tested using dilute HNO3 (0.1–0.5 mol L–1; Fig. 5d,e). At 0.5 mol L–1 HNO3, Pb2+ was almost completely transferred to the liquid phase, indicating reversible adsorption under acidic conditions. The optimal elution conditions were therefore set as: 0.5 mol L–1 HNO3, solid-to-liquid ratio of 2.0 g L–1 and stirring at 25°C for 2 h.
Evaluating adsorbent performance in DW alone is insufficient because real water matrices are far more complex. Even artificially prepared simulated surface water cannot fully capture the complexity of natural organic and inorganic components. Simply adding inorganic cations and anions does not reflect real-world conditions (Akhter et al., Reference Akhter, Soni, Jamali, Zoppas and Ibrahim2023). We therefore collected actual water samples from multiple sources: the Yangtze River (YRW, Nanjing, Jiangsu, China), the Yellow River (HRW, Baotou, Inner Mongolia, China) and seawater (SW, Tianjin, China). DW (Milli-Q® Integral 10 laboratory pure water system) and TW (Hohhot, Inner Mongolia, China) were also used. A small volume of concentrated Pb2+ solution was spiked into each water sample to reach a nominal Pb2+ concentration of ∼1000 μg L–1. After thorough mixing, the samples were filtered through a 0.45 μm membrane to obtain the artificially contaminated water samples. Figure 5f shows the purification results for low-concentration Pb2+ in these water matrices using the three adsorbents. All three materials reduced Pb2+ to varying extents, even under complex conditions. For freshwater samples, the Pb2+ concentration in the supernatant dropped from 1000 μg L–1 to below 80 μg L–1. In the high-salinity seawater samples, NC and FNC achieved 60–70% removal. Notably, FTNC reduced the Pb2+ concentration in seawater from 1000 μg L–1 to below 50 μg L–1. This excellent anti-interference performance opens up multiple possibilities for practical applications.
Synergistic adsorption mechanism of multi-mineral intergrowth
The Pb2+-saturated samples were characterized to understand how activation increases adsorption on NC, FNC and FTNC.
Phase analysis of Pb-saturated samples
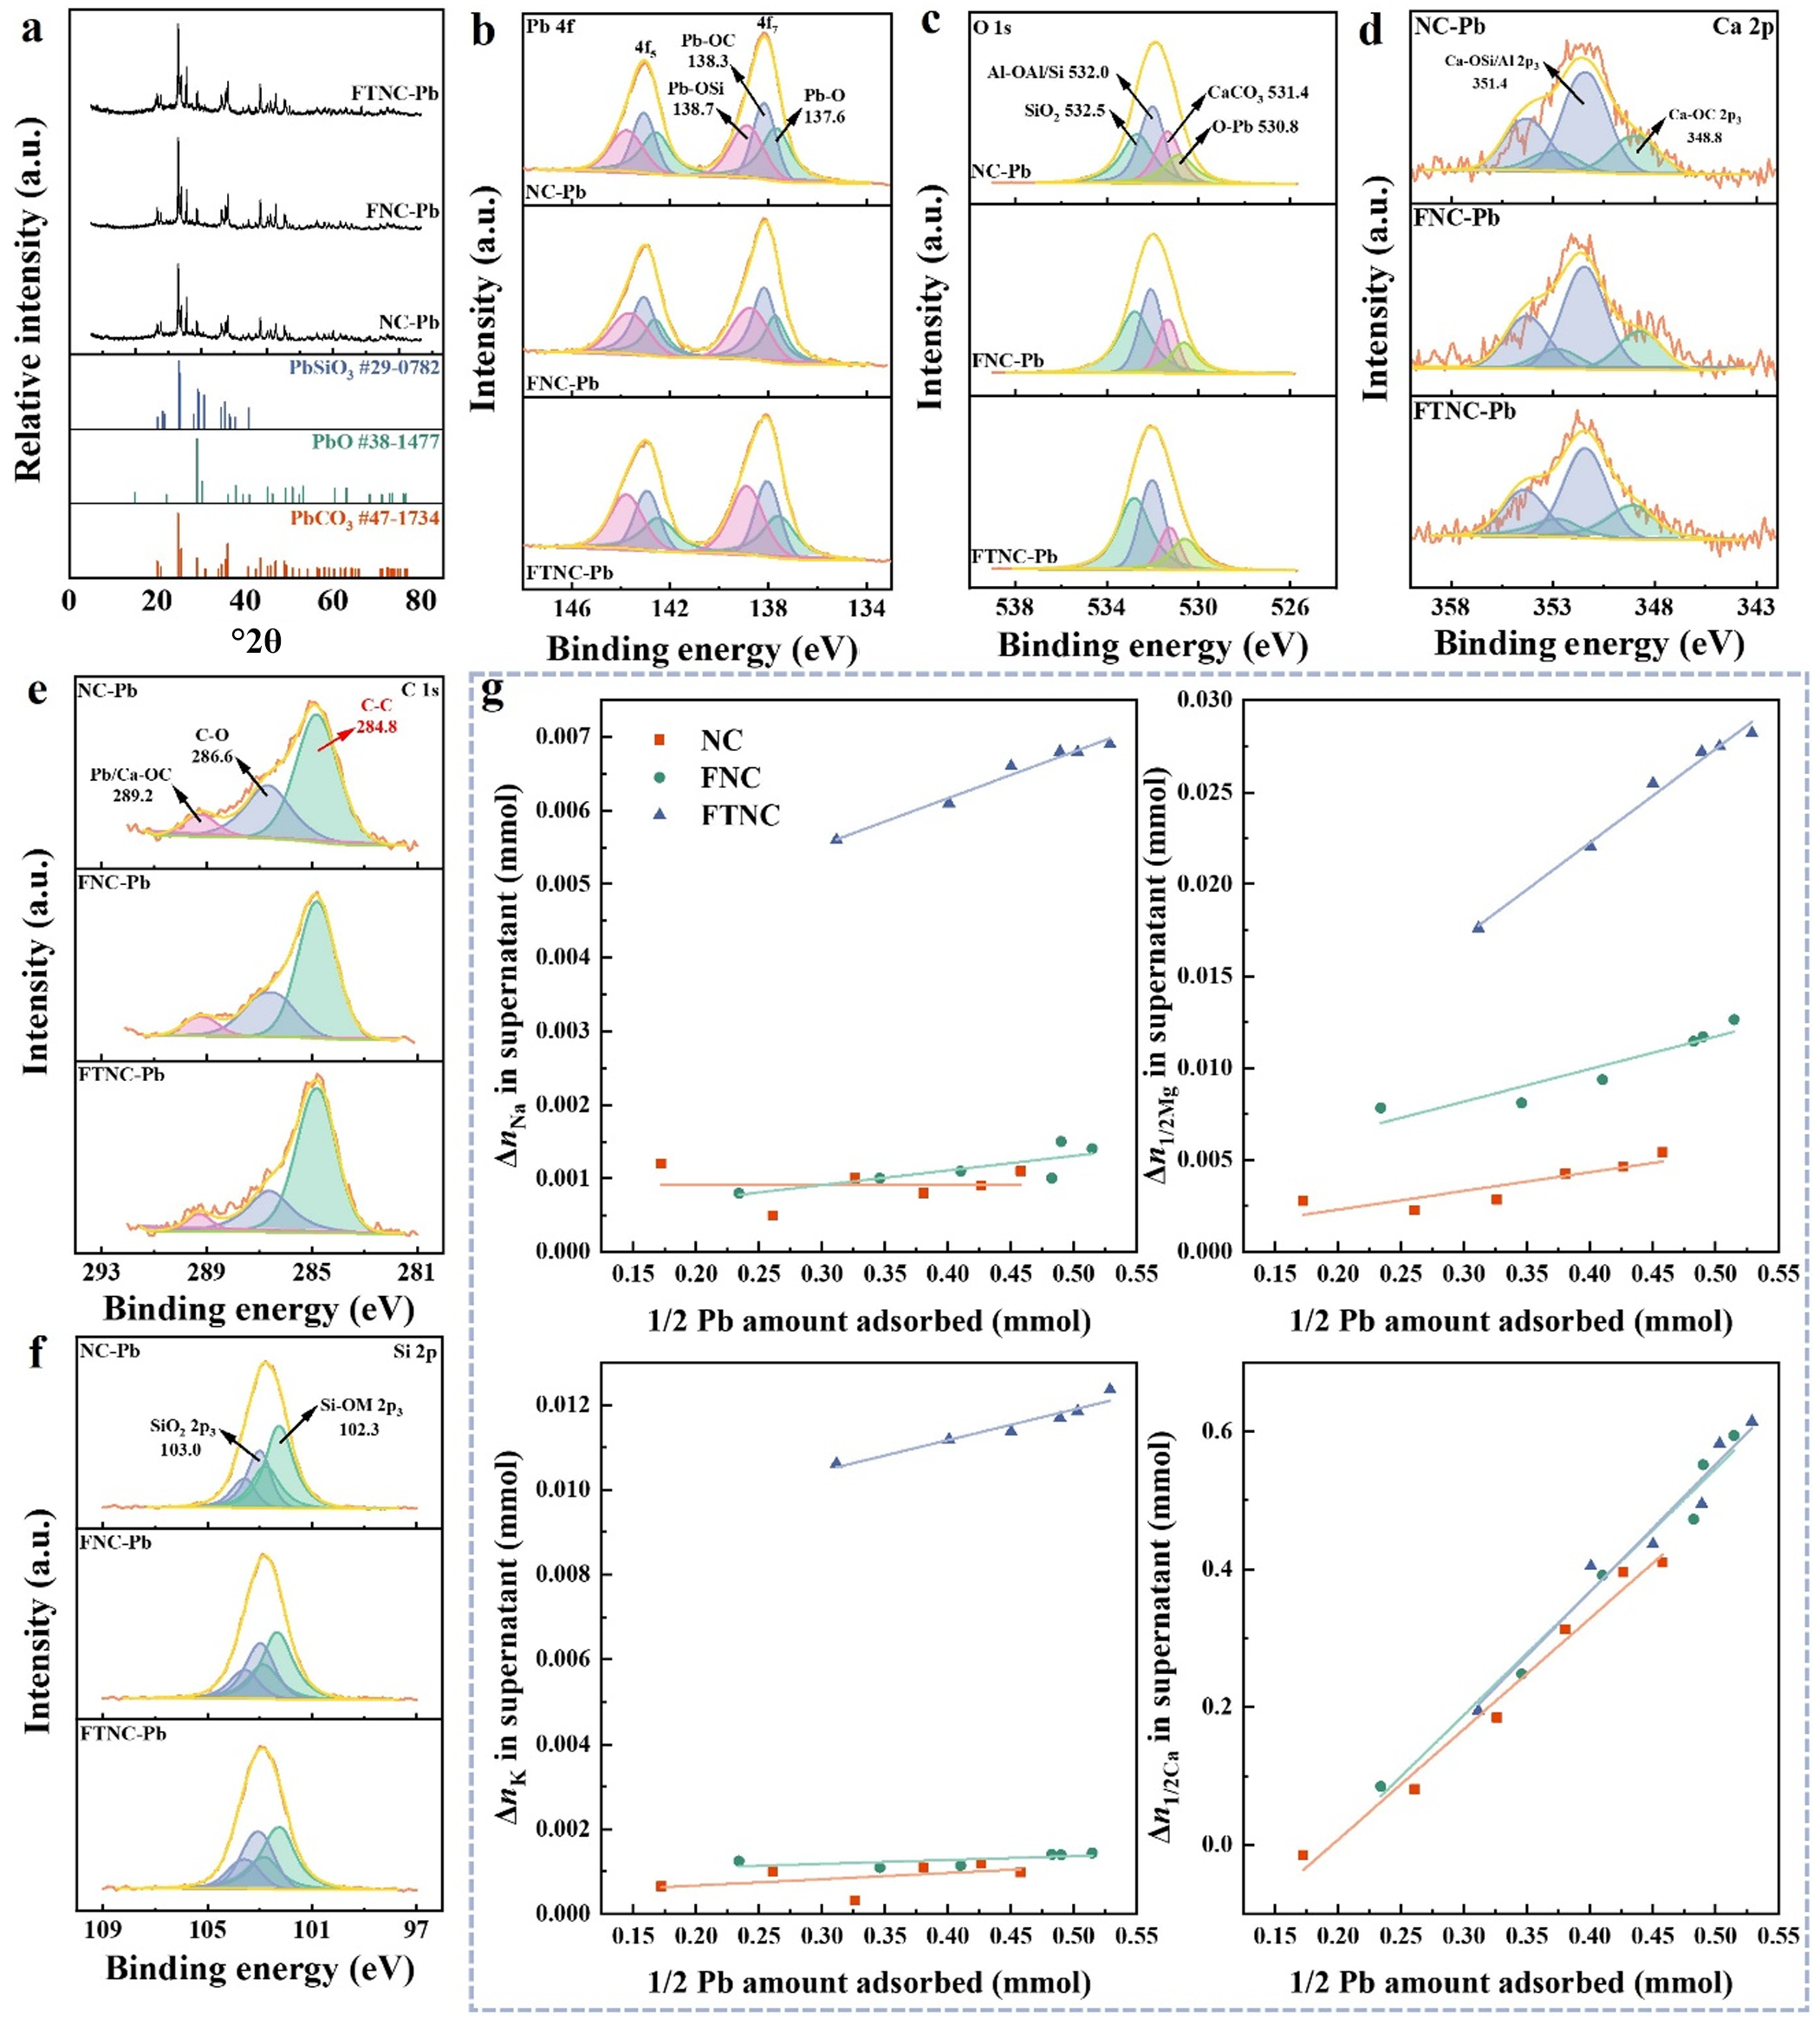
XRD traces of Pb-saturated samples (NC-Pb, FNC-Pb, FTNC-Pb; Fig. 6a) show diffraction peaks assigned to PbCO3 (JCPDS No. 47-1734), PbSiO3 (JCPDS No. 29-0782) and PbO (JCPDS No. 38-1477). PbCO3 dominates, suggesting that carbonate minerals are the main sink for Pb2+ fixation. This agrees with the sharp decrease in adsorption capacity above 800°C (Fig. 3a), where calcite decomposes. The presence of PbSiO3 indicates another immobilization route: ion exchange, whereby Pb2+ replaces structural cations (e.g. Na+, Mg2+) on silicate surfaces. All three samples contain both PbCO3 and PbSiO3, pointing to a dual mechanism: carbonate-dominated precipitation/complexation together with silicate-mediated ion exchange. The weak PbO signals and the elevated pH of Pb-saturated samples suggest that the alkalinity of adsorbents promotes some Pb2+ precipitation, although this is a minor pathway.
(a) XRD traces and (b–f) high-resolution XPS spectra of saturated adsorbent samples: (b) Pb 4f, (c) O 1s, (d) Ca 2p, (e) C 1s and (f) Si 2p. (g) Amounts of Na+, K+, Mg2+ and Ca2+ released into the supernatant during Pb2+ adsorption.

Figure 6 Long description
The figure contains multiple graphs: (a) XRD traces of Pb-saturated samples with diffraction peaks for PbCO3 PbSiO3 and PbO. (b-f) High-resolution XPS spectra for Pb 4f, O 1s, Ca 2p, C 1s and Si 2p, showing binding energy on the x-axis in electron volts and intensity on the y-axis in arbitrary units. Peaks are fitted with components. (g) Scatter plots showing the amounts of Na, K, Mg and Ca released into the supernatant during Pb adsorption. The x-axis represents one-half Pb amount adsorbed in millimoles and the y-axis shows Δμ in supernatant in millimoles. Different markers represent NC, FNC and FTNC samples. Key trends include increasing Δμ with adsorbed Pb, with FTNC showing the highest values. The graphs collectively illustrate the adsorption behavior and elemental composition changes in the samples.
Chemical state analysis of Pb-saturated samples
XPS survey spectra (Fig. S1b) show Pb 4d (412.0–434.3 eV) and 4f (136.9–141.8 eV) signals in the Pb-saturated samples. The Pb 4f core-level spectra (Fig. 6b) show three chemical states – PbO (137.6 eV), PbCO3 (138.3 eV) and PbSiO3 (138.7 eV) – matching the XRD findings. Their relative intensities reveal how the mechanism changes with activation. The PbO signal is lower in FNC-Pb and FTNC-Pb than in NC-Pb, meaning that activation reduces surface alkalinity and thus suppresses precipitation as a removal pathway. The PbSiO3 signal is higher in FTNC-Pb, indicating that thermal activation makes more Si–O⁻ active sites available, which promotes ion exchange-mediated Pb binding. The PbCO3 signal remains unchanged, showing that carbonate mineralization survives activation. This is noteworthy because calcite normally decomposes at high temperatures.
In the O 1s spectra (Fig. 6c), a new Pb–O peak appears at 530.8 eV after adsorption. Compared with the pristine samples (Fig. 2), the CaCO3 and Al–O–Al/Si–O peaks shift by 0.1 and 0.3 eV, respectively, while the SiO2 peak does not change. Ca 2p core-level spectra (Fig. 2d) show that after saturation adsorption, the binding energy of the Ca–O–C environment is 348.8 eV, close to the 348.2 eV observed for FTNC before adsorption. This suggests that activation shifts the binding energy in a direction favouring ion exchange. Moreover, samples with higher saturation adsorption capacities exhibit lower Ca–O–C binding energies, implying greater involvement of Ca in the adsorption process. C 1s spectra (Fig. 6e) corroborate this: the carbonate peak shifts from 289.4 to 289.2 eV. The Si–O–M peak (Fig. 6f) shifts by 0.1 eV. Both shifts confirm that Pb2+ interacts with carbonate and silicate components.
Together, the XPS data show a clear division of labour: carbonates act as the primary, stable sink for Pb2+ (unchanged PbCO3 signals), while silicate sites contribute via ion exchange – a role that increases with thermal activation (higher PbSiO3 in FTNC-Pb). In activated samples, less PbO forms, indicating a shift from non-specific precipitation to more targeted chemical binding. This is favourable for long-term immobilization.
Quantitative evidence of ion exchange
XRF analysis (Table S1) shows a marked decrease in Si content after washing, stirring and sieving, attributed to the removal of inert quartz particles that do not contribute to adsorption. To quantify the contribution of cation exchange, we performed the following experiments. First, 1.0 g of adsorbent was added to 1000 mL of DW (pH 5.5) containing Pb2+, with continuous stirring. The DW contained no detectable metal cations before this addition. Over time, the adsorbed Pb amount gradually increased. At regular intervals, a small suspension aliquot was sampled for ICP-OES analysis. The mass loss of adsorbent and volume change of the solution were negligible. The concentrations of Na+, K+, Mg2+ and Ca2+ in the supernatant were measured as a function of adsorbed Pb2+. A control experiment was performed under identical conditions but without Pb2+. In the main experiment, the released cations came from both Pb2+ exchange and adsorbent dissolution. In the control, only dissolution contributed. Subtracting the control values from the main experiment gave the net cations released solely by ion exchange.
Using the solid-to-liquid ratio, we then calculated (in mmol) both the amounts of the four cations involved in exchange and the amount of Pb fixed to the adsorbent. For charge equivalence, divalent cation amounts were divided by 2. The normalized results are shown in Fig. 6g. Ca release correlates positively with Pb2+ uptake, and the amount of Ca2+ released is much higher than those of Na+, K+ or Mg2+. Thus, Ca2+ dominates the ion-exchange process, consistent with the predominance of PbCO3 seen in XRD and XPS. Compared with NC, the Ca concentrations for FNC and FTNC increased only slightly, and the slopes of their correlation lines changed little. This suggests that thermal activation does not impair Ca-mediated ion exchange (Fig. 6g). Mg2+ also participates in exchange, although to a lesser extent than Ca. Activation gradually increases the exchange activity of Mg2+: the amount of Mg released increases, and the fitting slope becomes steeper. The increase from NC to FNC probably reflects the removal of inert particles, disruption of soft agglomerates and increased specific surface area, which expose more Mg active sites. The further increase from FNC to FTNC suggests that thermal treatment activates previously inactive sites, possibly by removing water from mineral crystal pores and allowing Pb2+ to enter (Fig. 6g). The trend is even more pronounced for Na+ and K+. For untreated adsorbents, the fitted slope is near zero, indicating negligible Na/K involvement in exchange. After thermal activation, both cations become significantly engaged: their supernatant concentrations now correlate with Pb2+ uptake (the slope increases). The underlying mechanism may be similar to that proposed for Mg2+.
To quantitatively assess the contribution of total cation exchange (Na+ + K+ + Mg2+ + Ca2+) to Pb2+ adsorption, we normalized all amounts to charge equivalents (mmol of +1 charge). From the fitted linear equations, we obtained the charge-equivalent adsorbed Pb and the corresponding charge-equivalent released cations. Table S6 summarizes these values.
The total exchanged cations account for at least 72.6% of the adsorbed Pb2+ (on a charge-equivalent basis). This indicates that ion exchange is the dominant adsorption mechanism. Moreover, activation increases the total amount of cations released during adsorption. Together, the ion-exchange data show a clear hierarchy linked to the structural roles of the cations. Ca2+ (carbonate-associated, readily exchangeable) dominates. Mg2+ (silicate-bound, moderately accessible) follows. Na+ and K+ (located in interlayers or channels) require thermal activation to become exchangeable. Activation thus progressively releases these sites, increasing Pb2+ adsorption.
Contribution of electrostatic attraction
Zeta-potential measurements (Fig. 3c) show that NC, FNC and FTNC all carry negative surface charges at pH 1–6, which can attract positively charged Pb2+. The negative charge increases with pH and levels off above pH 4. At pH ≥ 5, the zeta potentials are approximately –12.0 mV (NC), –17.8 mV (FNC) and –20.4 mV (FTNC).
Surface negativity increases with activation in the order NC < FNC < FTNC. Two factors explain this trend. First, mechanical disaggregation exposes negatively charged surfaces that were previously buried. Second, thermal activation probably increases the density of deprotonated Si–O⁻ sites. This stronger negative charge then promotes electrostatic capture of Pb2+.
The zeta-potential trend follows the adsorption capacity order (NC < FNC < FTNC). However, the surface-charge difference between NC and FTNC is only ∼8.4 mV, whereas the adsorption capacity increases by >120 mg g–1. This disparity indicates that electrostatic attraction alone cannot explain the full increase. Rather, activation mainly increases the density of active sites and promotes specific chemical binding (ion exchange and carbonate mineralization), with electrostatic attraction playing a complementary role.
Synergistic adsorption mechanism model
From the results presented earlier, we propose a synergistic adsorption mechanism for the multi-mineral intergrowth, involving four pathways: (1) calcite-dominated ion exchange (primary): CaCO3 + Pb2+ → PbCO3 + Ca2+; (2) silicate cation exchange (supplementary): ≡Si–O–M + Pb2+ → ≡Si–O–Pb + M (M = Na+, K+, Mg2+, Ca2+); (3) electrostatic attraction: negatively charged surfaces interact with Pb2+; and (4) in situ precipitation: local pH increase leads to PbO/Pb(OH)2 formation.
The contribution of each pathway changes with activation. Calcite-dominated exchange remains primary in all samples, as evidenced by the dominant PbCO3 in the XRD/XPS results and the strong Ca2+ release in the ICP-OES results. Silicate exchange, already present in pristine NC, becomes significantly greater after thermal activation – particularly for Na+ and K+, which are only mobilized upon heating. Natural minerals contain abundant bound water in their lattices; heat treatment can cause dehydroxylation. Previous work has shown that dehydroxylation of clay minerals promotes heavy metal adsorption from water (Chen et al., Reference Chen, Gray and Liu2017; Ondruška et al., Reference Ondruška, Štubňa, Trnovcová, Vozár and Bačík2017; Cheng et al., Reference Cheng, Xing, Bu, Zhang, Piao and Huang2019; Wu et al., Reference Wu, Feng, Jiang, Zhang, Xu and Liu2025; He et al., Reference He, Wang, Hu, Huang and Jiang2026), mainly by increasing the contact probability between adsorbate and active sites. Electrostatic attraction follows the order of surface negativity: FTNC > FNC > NC. Precipitation plays only a minor role, consistent with the weak PbO signals and their suppression in activated samples.
Our multi-scale engineering approach – compositional optimization, aggregate disintegration, structural activation and surface modification – systematically facilitates these mechanisms. Mechanical disaggregation removes inert quartz and exposes buried active surfaces, increasing the availability of both carbonate and silicate exchange sites. Thermal activation achieves a critical synergy: it preserves carbonate activity while activating silicate exchange sites and increasing surface negative charge. As a result, the primary and supplementary mechanisms work together rather than competing.
FTNC thus functions as a multi-pathway synergistic adsorption system, offering superior adsorption capacity, profound purification ability and acid tolerance relative to the pristine material.
Conclusions
A low-grade, natural, mixed attapulgite clay intergrowth (NC) with large reserves in nature was activated using reagent-free physical treatments (mechanical disaggregation followed by thermal activation) to obtain two clay-derived adsorbents: FNC and FTNC. The maximum Pb2+ adsorption capacities of NC, FNC and FTNC were 153.1, 206.4 and 237.5 mg g–1, respectively, with corresponding removal efficiencies of 96.42%, 99.52% and 99.99%. The adsorption follows the Langmuir isotherm and pseudo-first-order kinetics, indicating a spontaneous exothermic process. The adsorbed Pb2+ can be efficiently eluted with dilute acid. Characterization shows that NC is a mixed intergrowth primarily composed of quartz, calcite and attapulgite. Mechanical activation removes soluble salts and inert impurities, disrupts soft agglomerates and improves dispersion. Subsequent thermal activation at 600°C preserved the mineral phases but removes channel water, thereby facilitating ion diffusion. The adsorption involves three synergistic mechanisms: (1) ion exchange with carbonate and silicate minerals, forming PbCO3 and PbSiO3 (with calcite as the dominant contributor); (2) in situ precipitation of PbO induced by the alkalinity of intergrowth; and (3) electrostatic attraction between negatively charged surfaces and Pb2+. Mechanical activation improves performance by removing inactive components and improving dispersion. Thermal activation further increases adsorption capacity by activating silicate exchange sites and preserving carbonate activity, allowing effective Pb2+ adsorption even at pH 1.
Supplementary material
The supplementary material for this article can be found at https://doi.org/10.1180/clm.2026.10049.
CRediT authorship contribution statement
Huan Zhang: Investigation, Formal analysis, Data curation, Writing – original draft. Hang Lu, Zhihui Mao: Writing – review & editing, Formal analysis, Software. Zongyang Liu, Siyuan Wang: Formal analysis, Software. Wenbo Wang: Conceptualization, Writing – review & editing, Resources, Methodology, Supervision.
Financial support
This research was supported by the following projects: the National Natural Science Foundation of China (22468033); the Key R&D and Achievement Transformation Project of Inner Mongolia Autonomous Region (2023YFHH0057); the Natural Science Foundation of Inner Mongolia Autonomous Region (2024SHZR1554); the Jiangsu Provincial Key Laboratory of Palygorskite Science and Applied Technology, Huaiyin Institute of Technology (HPK202302); and the Program of Higher-Level Talents of Inner Mongolia University (10000-23112101/017).
Competing interests
The authors declare that they have no known competing financial interests or personal relationships that could have appeared to influence the work reported in this paper.