I. INTRODUCTION
Research work on copper alloy has augmented significantly over the past few years. Advanced materials are used to meet the requirements of industries such as valve, electrical wire manufacturing, etc. Amongst several alloy materials, copper alloy satisfies the demands of these manufactures. The properties of copper alloys such as high strength, hardness, ductility, better corrosive resistance, etc are highly attractive. Reference Moshkovich, Perfilyev, Lapsker and Rapoport1 Brass and its alloys are widely used in friction parts of machines, such as bearing liners and bushing. Reference Amirat, Zaïdi, Djamaï, Necib and Eyidi2 Brass (Cu–Zn alloy) has better properties such as higher plasticity, strength, hardness, and corrosion resistance than pure copper. Recently, European Union Regulation of REACH restricted the use of materials containing lead as alloying element. Therefore, brass has been used as the replacement of lead bronze to produce the sliding parts of hydraulic equipment to obtain good tribological property. Reference Gao, Nakata, Nagatsuka, Shibata and Amano3 The development of high strength and high conductive brasses are urgent to convince the demands of the electronic industry, automotive and aerospace applications, etc. Reference Li, Imai, Atsumi and Kondoh4
Dafan Du et al. synthesized Cu–Zn alloy through casting process and studied the effect of a high magnetic field on the growth of ε-CuZn5 dendrite during directionally solidified Zn-rich Zn–Cu alloys. Reference Du, Guan, Gagnoud, Fautrelle, Ren, Lu, Wang, Dai, Wang and Li5 Electrical discharge machining (EDM) is the standard method for producing small, tight tolerance holes. It is an extremely cost-effective method for producing fast and accurate holes for hard or soft conductive materials. Reference Khanna, Kumar, Pal Garg, Singh and Sharma6 Vilarinho et al. studied the influence of the chemical composition on the machinability of brasses during computer numerical control turning. Reference Vilarinho, Davim, Soares, Castro and Barbosa7 Kaiping Peng et al. studied the grain refinement and crack prevention in constrained groove pressing of two-phase Cu–Zn alloys. Reference Peng, Su, Shawb and Qian8 Hisashi Imai et al. reported the characteristics and machinability of lead-free Cu60–Zn40 brass alloys dispersed with graphite fabricated through powder metallurgy route. Reference Imai, Kosaka, Kojima, Li, Kondoh, Umeda and Atsumi9
Nanimina et al. evaluated the effect of EDM process parameters on 30% Al2O3 reinforced aluminum metal matrix composite (AMMC) and reported that a high value of peak current and pulse on-time increases the MRR of Al6061 rather than AMMC. Reference Nanimina, Abdul-Rani, Ahmad, Zainuddin and Jason10 Senthil et al. proposed a multicriteria optimization technique to optimize the EDM parameter in machining of Al/Cu/TiB2 in situ metal matrix composites (MMCs) and they considered the discharge current, pulse on-time and pulse off-time as machining parameter and MRR, tool wear rate (TWR), and SR as response parameters. Reference Senthil, Sekar and Singh11 Radhika et al. conducted experiment on multiobjective optimization of process parameters of Al/Si/10Mg/9 wt% Al2O3/3 wt% graphite in EDM and they concluded that, peak current was found to be the most dominant parameter with contribution of 61.36% to obtain good surface finish, reduced TWR, and better MRR. Reference Radhika, Chandran, Shivaram and Vijay Kumar12 Sidhu et al. studied the significant factors that affect the output responses while machining of 10 vol% Al2O3/Al composite material and explained that the MRR and TWR have a direct relationship with current and an inverse relationship with pulse on-time. Reference Sidhu, Kumar and Batish13 Sushant Dhar et al. performed three successive trials using EDM with a cylindrical brass electrode of 30 mm diameter. They used three factors and three level full factorial design, second order, nonlinear mathematical model and analysis of variance (ANOVA) for analyzing the results. Reference Dhar, Purohit, Saini, Sharma and Hemath Kumar14 Rengasamy et al. synthesized Al 4032 composite and optimized the EDM process parameter to obtain MRR, TWR, and depth with the help of Taguchi L25 OA. Reference Rengasamy, Rajkumar and Senthil Kumaran15 Hourmand et al. found that EWR and tool wear ratio increases with decreasing pulse on-time. When pulse on-time was quite low, with voltage and current amplification, TWR shows an increasingly sharp trend. Surface finish was worst with all three input parameters at their highest levels. Reference Hourmand, Farahany, Sarhan and Noordin16 Singh et al. studied the MRR, TWR, and SR by the grey relational grade (GRG) obtained through grey relational analysis (GRA) for multiple performance characteristics and described that through GRA, the optimization of the multiple performance characteristics can be greatly simplified. Reference Singh17 Balamurugan et al. investigated the machinability of hardened steel and obtained optimum process parameters by GRA and ANOVA. Reference Balamurugan, Biswanath and Sukamal18 El-Taweel analyzed the relationship between the process parameters in EDM of CK-45 steel with tool electrode material as Al–Cu–Si–TiC composite and concluded that, the peak current was the most important factor affecting both the MRR and TWR while dielectric flushing pressure has little effect on both responses. Reference El-Taweel19 Patel et al. explained the process behavior of EDM of Al2/SiCW/TiC ceramic composites using quadratic mathematical model with four process parameters such as discharge current, pulse on-time, duty cycle, and gap voltage. They explained that pulse-on time is the dominant parameter influencing SR. Reference Pate, Pandeya and Venkateswara Rao20 Singh et al. discussed the process parameter optimization of EDM machining of Al–10% SiC composites using grey relational analysis and described that the improvement in the process and proved through experimental results for the optimal conditions. Reference Narender Singh, Raghukandan and Pai21
The present work aims to synthesize duplex brass through stir casting method and study the machining behaviour during EDM. The EDM process is selected since the duplex brass has both soft and hard phases. The optimal parameters of EDM was found using Taguchi method with grey relational analysis.
II. EXPERIMENTAL DETAILS
In the present work, duplex brass has been produced using casting route from the copper and zinc billets. A stirring system has been developed by the motor with regulator for the uniform stirring. To ensure the proper mixing of melts, all the melting was carried out in a graphite crucible in an open hearth furnace. Billet of copper (60 wt%) and zinc (40 wt%) was preheated at 480 °C for 50 minutes before melting to make their surfaces oxidized. The furnace temperature was first raised above the liquidus (1100 °C) to melt the feed stock completely and was then cooled down just below the liquidus to keep the slurry in a semisolid state. After sufficient mixing, the slurry was reheated to a fully liquid state and then automatic mechanical mixing was carried out for about 15 minutes. In the final mixing process, the furnace temperature was within 1000 °C and the slurry was poured in a sand mold designed to get standard specimens. The material was then tested for the mechanical properties by using universal testing machine, Brinell hardness tester and impact testing machine. The hardness reading was taken in B scale and it was reported in Brinell Hardness Number (BHN). The density of the sample was calculated by Archimedes principle. Reference Ravichandran, Naveen Sait and Anandakrishnan22 The scanning electron microscopic analysis was carried out using SEM-ZEISS machine (Carl Zeiss, Jena, Germany). The composition of the casted materials is verified by EDAX analysis.
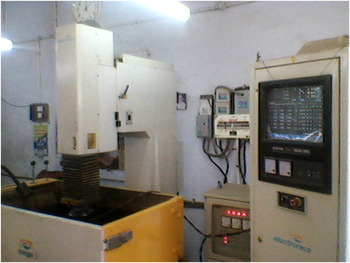
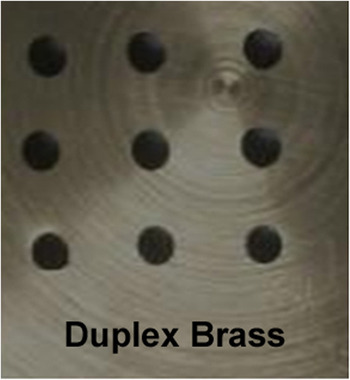
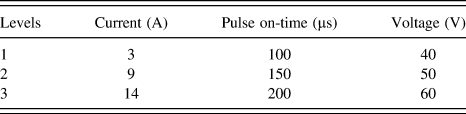
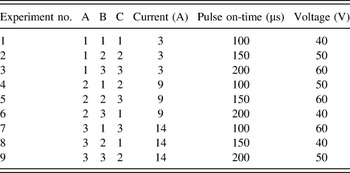
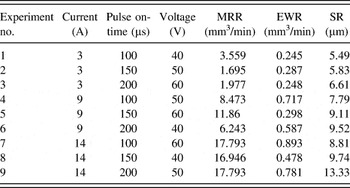
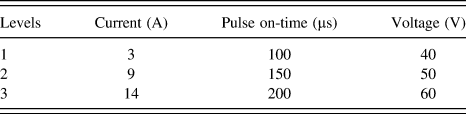
The drilling operation was performed by using EDM-Electronica model (Electronica Machine Tools, Kolkata, India) in newly synthesized duplex brass (100 × 100 × 8.5 mm). The copper electrode was selected as tool. The EDM machine setup is shown in Fig. 1. Kerosene was used as dielectric medium during machining. Three input parameters were selected from the previous literature such as current, pulse on-time, and voltage. The details of levels of parameters are represented in Table I. The machining was carried out as per L9 OA as shown in Table II to drill 6 mm diameter holes in the work material. The machined work piece material is shown in Fig. 2. The output parameters such as material removal rate (MRR), electrode wear rate (EWR), and surface roughness (SR) were recorded for the analysis. To calculate the MRR, the weight of the work piece and tool was observed with the difference between before and after the machining process. The MRR and EWR are calculated by using Eqs. (1) and (2). Reference Mathan Kumar, Senthil Kumaran and Kumaraswamidhas31
 $${\rm{MRR}} = {{\left[ {\left( {{W_{\rm{i}}} - {W_{\rm{f}}}} \right) \times 1000} \right]} \over {\left( {{D_{\rm{w}}} \times t} \right)}}\quad ,$$
where MRR-material removal rate (mm3/min), W i-initial weight of work piece (g), W f-final weight of work piece (g), D w-density of the work piece (7.28 g/cm3), t-period of trial (min).
 $${\rm{EWR}} = {{\left[ {\left( {{T_{\rm{i}}} - {T_{\rm{f}}}} \right) \times 1000} \right]} \over {\left( {{D_{\rm{e}}} \times t} \right)}}\quad ,$$
where EWR-electrode wear rate (mm3/min), T i-initial weight of tool (g), T f-final weight of tool (g), D e-density of the tool (8.12 g/cm3), t-period of trial (min).
EDM used for machining.

Copper alloy plate after EDM.

Control parameters with their levels.
Experimental layout as per L9 OA.

The SR for experiments is measured by surface tester (Mitutoyo Talysurf-SJ-201, Kanagawa, Japan). The calculated output parameters are represented in Table III.
Experimental results as per L9 OA.

III. RESULTS AND DISCUSSION
A. Materials properties and characterization
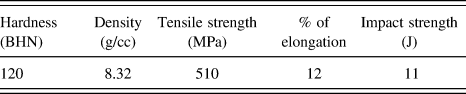
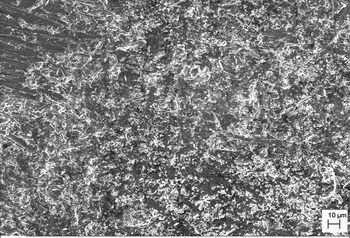
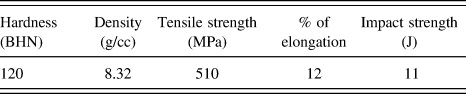
The density and mechanical properties such as hardness, tensile strength, percentage elongation, and impact strength of the synthesized duplex brass is given Table IV. To analyze the morphology of the material, scanning electron microscope (SEM) analysis had been conducted and the image is presented in Fig. 3. From the image it is clearly evident that the two-phase nature of duplex brass (α & β). It is observed that the Zn was dissolved in the Cu atoms during melting. The main factors influencing the microstructure are the percentage of copper and zinc as well as the thermo mechanical treatment of the material. Reference Nobel, Hofmann, Klocke, Veselovac and Pul23 In addition to that, the distribution of Zn in the Cu is uniform and it was achieved by the uniform speed of stirring during casting of material.
Properties of proposed material.
SEM image of duplex brass.

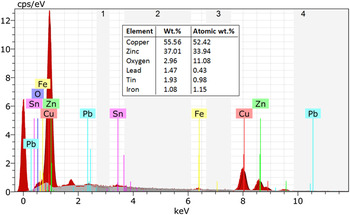
Figure 4 shows the results of EDAX analysis. From the image, the composition of the synthesized duplex brass is studied. The maximum of 55.56 wt% of copper, 37 wt% of zinc and very less percentage of Ni is observed. In general, brass alloys having a zinc content of up to 38% consist almost completely of α-grains. Lattice structure of the α-phase is face-centered cubic and therefore, brasses with high amount of α-phase possess a low hardness and high ductility. Reference Nobel, Hofmann, Klocke, Veselovac and Pul23 But the presence of β phase in the brass increases the hardness and strength of the duplex brass since the β-phase is body-centered cubic and is harder and stronger than α.
EDAX of duplex brass.

B. Signal to Noise (SN) ratio analysis
The Taguchi method is a powerful tool in quality optimization for manufacturing processes. Taguchi method makes use of a special design of OA to examine the quality characteristics through a minimal number of experiments. The experimental results based on the OA are then transformed into SN ratios to evaluate the performance characteristics. The total degrees of freedom (DOF) should be known first to forecast the number of experiments that should be taken. A total DOF was six to three factors. The experiments should always be conducted more in numbers than the selected DOF. Thus, L9 OA was selected based on Taguchi's design of experiments. Reference Tzeng and Chen24
Since we require minimum EWR and SR, the smaller the better characteristic is selected to minimize the output parameters such as EWR and SR. Larger the better characteristics are selected to maximize the MRR. Signal noise ratio for the output response can be calculated using Eqs. (3) and (4). Equation (3) is most desirable in cases where the response is in minimization quality characteristics. Equation (4) is applicable where the quality response is to be maximized. Reference Wang, Chow, Yang and Lu25
 $${{\rm{S}} \mathord{\left/ {\vphantom {{\rm{S}} {\rm{N}}}} \right. \kern-\nulldelimiterspace} {\rm{N}}}\;{\rm{ratio}} = - 10\,{\log _{10}}\left[ {\left( {{1 \over n}} \right)\left( {\sum\limits_{i = 1}^n {\mathop y\nolimits_{ij}^2 } } \right)} \right]$$
 $${{\rm{S}} \mathord{\left/ {\vphantom {{\rm{S}} {\rm{N}}}} \right. \kern-\nulldelimiterspace} {\rm{N}}}\;{\rm{ratio}} = - 10\,{\log _{10}}\left[ {\left( {{1 \over n}} \right)\left( {\sum\limits_{i = 1}^n {{1 \over {\mathop y\nolimits_{ij}^2 }}} } \right)} \right]\quad ,$$
where, n = number of replications; y ij = observed response, i = 1, 2, …, n; j = 1, 2,…, k.
C. Grey relational analysis
The grey system theory initiated by Deng is mainly utilized to study uncertainties in system models, analyze relations between systems, establish models, and make forecasts and decisions. The meaning of “grey” can be expressed as characteristic between black and white. The GRA is an important method in grey system theory. Data pre-processing in this analysis is the process of transferring of original sequence to a comparable sequence. For this the experimental results are normalized in the range between zero and one. Following the pre-processing, a grey relational coefficient γ is calculated to express the relationship between the actual normalized experimental results. The grey rational analysis can be viewed as the multiobjective optimization process that can identify the optimum input parameters combination and in addition, can also identify the effect of each of the machining parameters on the machining characteristics. Reference Tripathy and Tripathy26
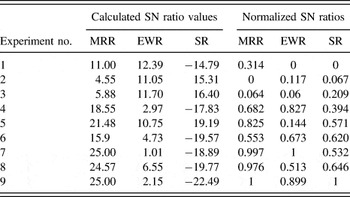
The values should be normalized before being analyzed with the grey relation theory. Here, the experimental result for the responses is normalized and is rated between 0 and 1. The normalized output parameters corresponding to the smaller the better and larger the better criterion can be calculated using Eqs. (5) & (6). Reference Bobbili, Madhu and Gogia27 The calculated SN ratio values and normalized SN ratio values for the MRR, EWR, & SR are presented in Table V.
 $${Z_{ij}} = {{\max \left( {{y_{ij}},i = 1,2, \ldots \ldots n} \right) - {y_{ij}}} \over {\max \left( {{y_{ij}},i = 1,2, \ldots \ldots ,n} \right) - \min \left( {{y_{ij}},i = 1,2, \ldots \ldots ,n} \right)}}$$
 $${Z_{ij}} = {{{y_{ij}} - \min \left( {{y_{ij}},i = 1,2, \ldots \ldots ,n} \right)} \over {\max \left( {{y_{ij}},i = 1,2, \ldots \ldots ,n} \right) - \min \left( {{y_{ij}},i = 1,2, \ldots \ldots ,n} \right)}}\quad ,$$
where, y ij = jth performance characteristic in the ith experiment; min y ij & max y ij = minimum and maximum values of the jth performance characteristic for the alternative ith experiment. The grey relational coefficients for the output responses from the normalized values can be determined by using Eq. (7). Reference Bobbili, Madhu and Gogia27
 $$\gamma \left( {{y_0}\left( k \right),y_i^*\left( k \right)} \right) = {{{\Delta _{\min }} + \xi {\Delta _{\max }}} \over {{\Delta _{0i}} + \zeta {\Delta _{\max }}}}\quad ,$$
where y
0(k)-ideal sequence (y
0(k) = 1, k = 1, 2 …); ∆0i
(k)-difference of absolute value between y
0(k) and
 $y_i^*\left( k \right)$
;
 ${\Delta _{0i}}\left( k \right) = \left[ {{y_0}\left( k \right) - y_i^*\left( k \right)} \right]$
; ∆min-smallest value of ∆0i(k); ∆max-largest value of ∆0i(k); ζ-distinguishing coefficient (ζ = 0.5 is generally used).
Calculated SN ratios and normalized SN ratios.

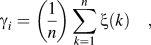
The grey relational coefficient is used for calculating the grey rational grade for combined objectives and is ranked in order. The performance standard is evaluated based on this and it is calculated using Eq. (8). Reference Bobbili, Madhu and Gogia27
 $${\gamma _i} = \left( {{1 \over n}} \right)\sum\limits_{k = 1}^n {\xi \left( k \right)} \quad ,$$
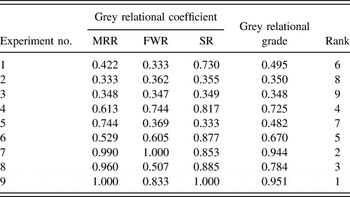
where, γ i is the GRG jth for the experiment and k is the number of performance characteristics. The calculated grey relational coefficient and GRG are provided in Table VI.
Grey relational coefficient.

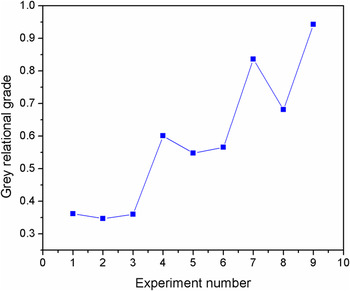
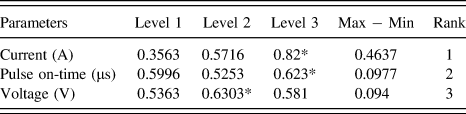
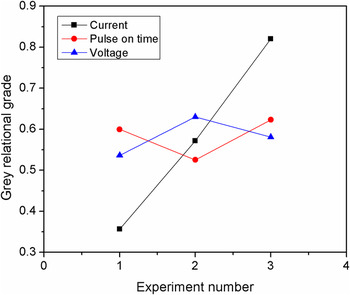
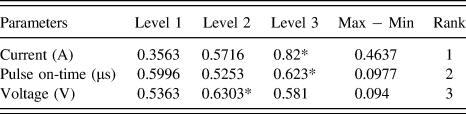
Figure 5 shows the GRG versus experiment number. From Fig. 5, it is observed that the experiment number 9 has high GRG (0.943), which consists of a better combination of optimal parameter (pulse current = 14 A, pulse on-time = 200 µs, and voltage = 50 V) with an objective to minimize the EWR, SR, and maximize the MRR. But the effect of each input parameters on the response should be determined. Table VII shows the GRG for each level of parameters and average grades. From Fig. 6, it is observed that the experiment runs 3, 3, and 2 have higher GRGs which consist of a better combination of optimal parameter level (A3B3C2). The minimum SR and EWR was achieved for high current and pulse on-time. Selvakumar et al. reported that, from the analysis it is observed that pulse on-time and peak current are the important process parameters affecting the SR. Reference Selvakumar, Sornalatha, Sarkar and Mitra28 Low current parameters will result a thin layer with a recast structure of increased hardness. Thus, there is a need for high current density and frequency of sparks that would eliminate or reduce the extent of finishing operations necessary for removing the recast layer. Reference Kandpal, Kumar and Singh29 Also in the higher levels of peak current by raising the spark voltage levels, the MRR increases. At higher peak current, more discharge energy is induced which causes overcuts and produces larger chips. Reference Bobbili, Madhu and Gogia27
GRGs for response parameters (MRR, EWR, and SR).

Gray relational grade for each level of parameters.
GRG for each level of parameters: current, pulse on-time and voltage.

The maximum MRR is observed for the highest value of pulse on-time. The reason is that, the pulse on-time controls the heat generation and spark formation. The increase of pulse on-time increases the heat generation which improves the material removal and extends the heat for longer time, which helps to remove material efficiently. Thus, longer pulse on-time increases the MRR. The increase of MRR is linearly proportional to the increase of pulse on-time. Reference Pramanik, Basak, Islam and Littlefair30 The increase in peak current increases the EWR and peak current is the most significant factor which affects the EWR. In this study, pulse on is insignificant factor for affecting the EWR.
D. ANOVA analysis
ANOVA is the statistical tool and which is applied to confirm the impact of all factors and their interactions by finding out the difference between the mean square and experimental errors at specific confident levels. ANOVA is widely used for getting the results of experiments to find the percentage of contribution of each parameter. Reference Bobbili, Madhu and Gogia27 In the present study ANOVA is used to determine the influence of input process parameters such as peak current, pulse on-time and voltage on the MRR, EWR, and SR. These results are very similar to that of Ravindranath Bobbili et al. who reported for ballistic grade of aluminium alloy. Reference Bobbili, Madhu and Gogia27
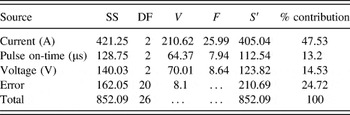
Table VIII shows the results of ANOVA. From the table it is clearly understood that, the current is the major contributed factor (47.53%) for affecting the SR followed by voltage and pulse on-time.
Results of ANOVA.

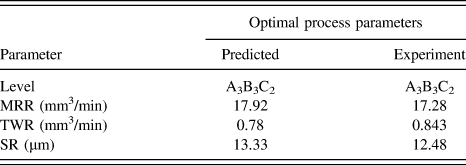
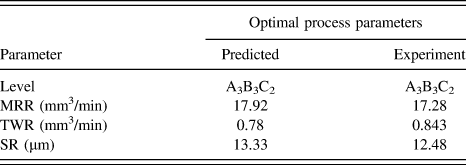
At the end, the confirmation tests were conducted to validate the predicted results of grey relational analysis. Table IX shows the both predicted and experimental results and it is evident that the experimental values are very close to predicted values.
Confirmation results.
IV. Conclusions
-
(1) The duplex brass was prepared by using stir casting route successfully and the machineability was studied using grey relational analysis.
-
(2) SEM image was presented and the EDAX analysis ensures the presence of weight percentages of alloying elements of duplex (α–β) brass.
-
(3) From the grey relational analysis, the optimum machining conditions for drilling the hole with maximum MRR, minimum SR, and EWR are identified as peak current: 14 A, pulse on-time: 200 µs and voltage: 50 V.
-
(4) From the ANOVA analysis, the peak current is the factor which highly contributing to affect the SR during drilling of duplex brass by using EDM.