Introduction
Variations of sea ice have received increased attention recently in the context of possible associations with anthropogenic climate change (Reference VinnikovVinnikov and others, 1999). The evidence from the past 2−3 decades indeed points to a decrease of ice coverage in the Arctic (Reference Chapman and WalshChapman and Walsh, 1993; Reference Bjorgo, Johannessen and MilesBjorgo and others, 1997; Reference Parkinson, Cavalieri, Gloersen, Zwally and ComisoParkinson and others, 1999). In addition to the decrease of ice coverage in the Northern Hemisphere, there are indications that sea-ice thickness has decreased substantially in the Arctic Ocean (Reference Rothrock, Yu and MaykutRothrock and others, 1999). However, several caveats must be noted before recent trends of sea ice are attributed to climate change, particularly greenhouse-related climate change. First, the two-decade record of passive-microwave satellite data, on which several recent trend analyses have been based, is exceedingly short for the detection of change. Second, the atmospheric circulation appears to have been a major factor in the recent sea-ice variations in the Northern Hemisphere (Reference Deser, Walsh and TimlinDeser and others, 2000). Finally, there are no indications of a decrease of Antarctic sea-ice coverage in the satellite-derived record for the past 2−3 decades. To the contrary, the satellite data even suggest a slight increase of Antarctic sea-ice coverage in these recent decades (Reference Cavalieri, Gloersen, Parkinson, Comiso and ZwallyCavalieri and others, 1997).
In view of the need for an extended time series to place the recent sea-ice variations into a longer temporal context, we have augmented the recent satellite data with various sources of data extending back to 1900. The various datasets are summarized in the following section. While a degree of heterogeneity is inevitable in such temporal extensions, the extension provides a "working record" of century-scale variations of sea-ice, and the resulting time series are generally (1) compatible with atmospheric data and (2) consistent across different sources of sea-ice data. Accordingly, we present in this paper a description of the dataset, a sample of century-long time series derived from the dataset, and a diagnosis of the variability in terms of the leading empirical modes of sea-ice coverage.
Data
The sea-ice database is an outgrowth of Reference Walsh and JohnsonWalsh and Johnson’s (1979) sea-ice data compilation performed in the 1970s, prior to the availability of satellite-derived datasets. This compilation consists of monthly grids of sea-ice concentration where available, the ice edge where concentrations were not available, and a baseline climatology where no information on even the ice edge was available. The strategy was to interpolate the available data to a common grid and date (end-of-month). While the original compilation was performed on a one-degree (111km) Cartesian grid, subsequent versions of the dataset have been converted to a 1 ° latitude × 1 ° longitude grid compatible with more recent sources of sea-ice data and with sea-surface temperature datasets.
The primary sources of the post-1972 data are the hemispheric fields of sea-ice concentration from (1) the U.S. National Ice Center (NIC), whose weekly grids (derived primarily from satellite data) span the period 1972−94, and (2) the satellite passive-microwave grids from the Scanning Multichannel Microwave Radiometer (SMMR)/Special Sensor Microwave/Imager (SSM/I) period, 1978−97 (Reference Parkinson, Cavalieri, Gloersen, Zwally and ComisoParkinson and others, 1999). As described by Reference Walsh and JohnsonWalsh and Johnson (1979), the primary sources for the period from the early 1950s to the early 1970s were the charts of the U.K. Meteorological Office, the Canadian Atmospheric Environment Service, the U.S. Naval Oceanographic Office, the Danish Meteorological Institute and the Icelandic Glaciological Society. For the first half of the 20th century, a primary source was the monthly April-September chart series of the Danish Meteorological Institute, digitized by Reference KellyKelly (1979), and corresponding wintertime information digitized by our group using the summaries of ship reports in the yearbooks of the Danish Meteorological Institute. An additional source of data for the first half of the 20th century is the recent digitization of the Norwegian Polar Institute’s sea-ice charts byT. Vinje and R. Colony (Reference VinjeVinje, 1999). Since the Norwegian digital data also include the more recent decades, we added these data to the eastern North Atlantic portions of our grids through 1972, the year when the hemispheric dataset of the NIC was initiated. We also note that the Norwegian dataset extends well back into the pre-1900 period, permitting even longer temporal extensions for the eastern North Atlantic. In the following section, we present some results based on this particular data source, together with results based on the more extensive synthesized dataset.
Results
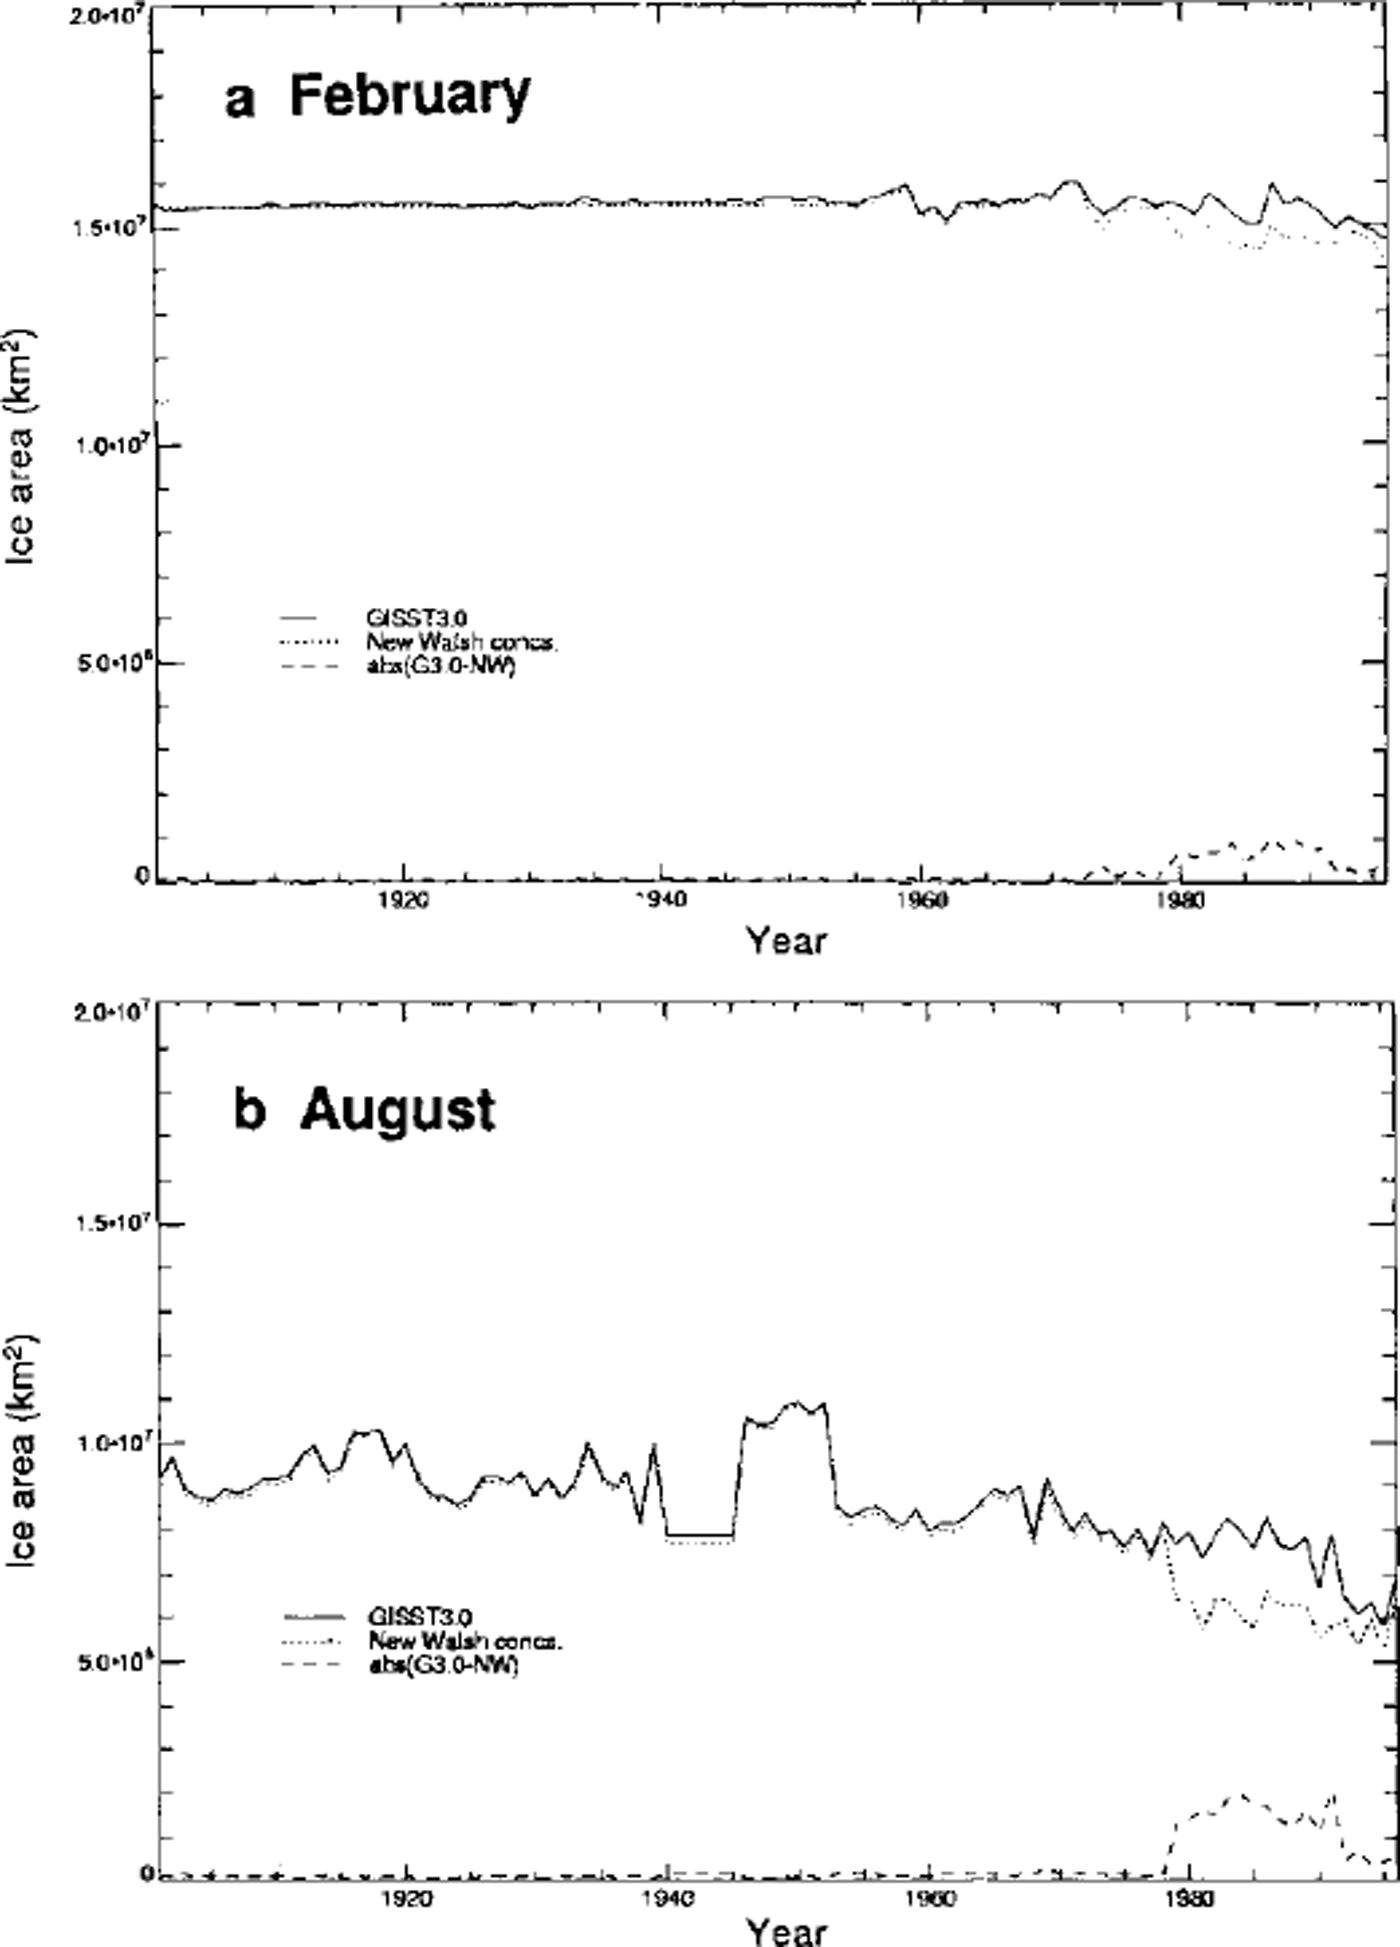
Datasets of sea-ice concentration permit the evaluation of two integrative measures of sea-ice coverage: ice extent and ice-covered area. The former is the ocean area poleward of the sea-ice edge (defined here as the equatorward limit of ice concentrations of 0.1 or greater). The latter is the sum over all gridcells of the product of ice concentration and gridcell area. Many of the earlier datasets permit evaluations of only ice extent. The Norwegian digital dataset, for example, consists of only the coordinates of the ice edge, so it is not possible to determine ice-covered area from this data source. Even the more recent hemispheric datasets do not provide compatible measures of ice-covered area. For example, Figure 1 (provided by N. Rayner) shows time series of ice-covered area for the Northern Hemisphere from two candidates for inclusion in the Hadley Centre for Climate Prediction and Research’s GISST (global sea-ice and sea-surface temperature) dataset. The two time series in Figure 1 differ primarily in the source of data for the past 20 years. The solid curve (NIC data for 1978−94) shows larger ice-covered areas than does the time series utilizing passive-microwave (SMMR/SSMI) data for the same period. The differences range from approximately 5% in winter (Fig. 1a) to 15−20% in summer (Fig. 1b). The differences, which arise from the smaller ice concentrations in the passive-microwave dataset, are largest in regions and time periods when melt creates a wet surface. These differences provide another reason for a focus on ice extent in our time-series analysis.
Time series of northern hemisphere ice-covered area for (a) winter (february) and ( b) sunnier (august) derived from alternative data inputs, including two different sources for the past two decades: nic (solid line) and SMMR/SSM/I passive-microwave data (dotted line). differences are shown by dashed lines at bottom of each panel. (figure provided by N. rayner, hadley centre, U.K. Meteorological office.)
As an illustration of the compatibility of various data sources in the determination of trends of ice extent, Figure 2 shows annual time series for the past 2−3 decades from five sources, including several based solely on satellite data (Reference RopelewskiRopdewski, 1985; Reference Bjorgo, Johannessen and MilesBjorgo and others, 1997; Reference Parkinson, Cavalieri, Gloersen, Zwally and ComisoParkinson and others, 1999). While the various time series show some offsets due to the inclusion or exclusion of peripheral subarctic seas (e.g. Baltic, Okhotsk), the interannual variations and, most importantly for this discussion, the trends are compatible across the various datasets. The linear trends are in the range −0.1 × 10⁶ to −0.3 × 10⁶ km2 per decade. Statistical significance tests of these trends (cf. table 1 of Reference VinnikovVinnikov and others, 1999) show that the trends are most significant in the longer time series, such as Reference Chapman and WalshChapman and Walsh’s (1993) time series extending back to 1953. The latter time series was derived from an earlier version of the same dataset described here.
Annual mean northern hemisphere sea-ice extent derived from five data sources: Reference RopelewskiRopelewski (1985), updated; Reference Chapman and Walshchapman and walsh (1993), updated; Reference Bjorgo, Johannessen and MilesBjørgo and others (1997); Reference ZakharovZakharov (1997); and Reference Parkinson, Cavalieri, Gloersen, Zwally and Comisoparkinson and others (1999). (figure provided by k. vinmkov.)
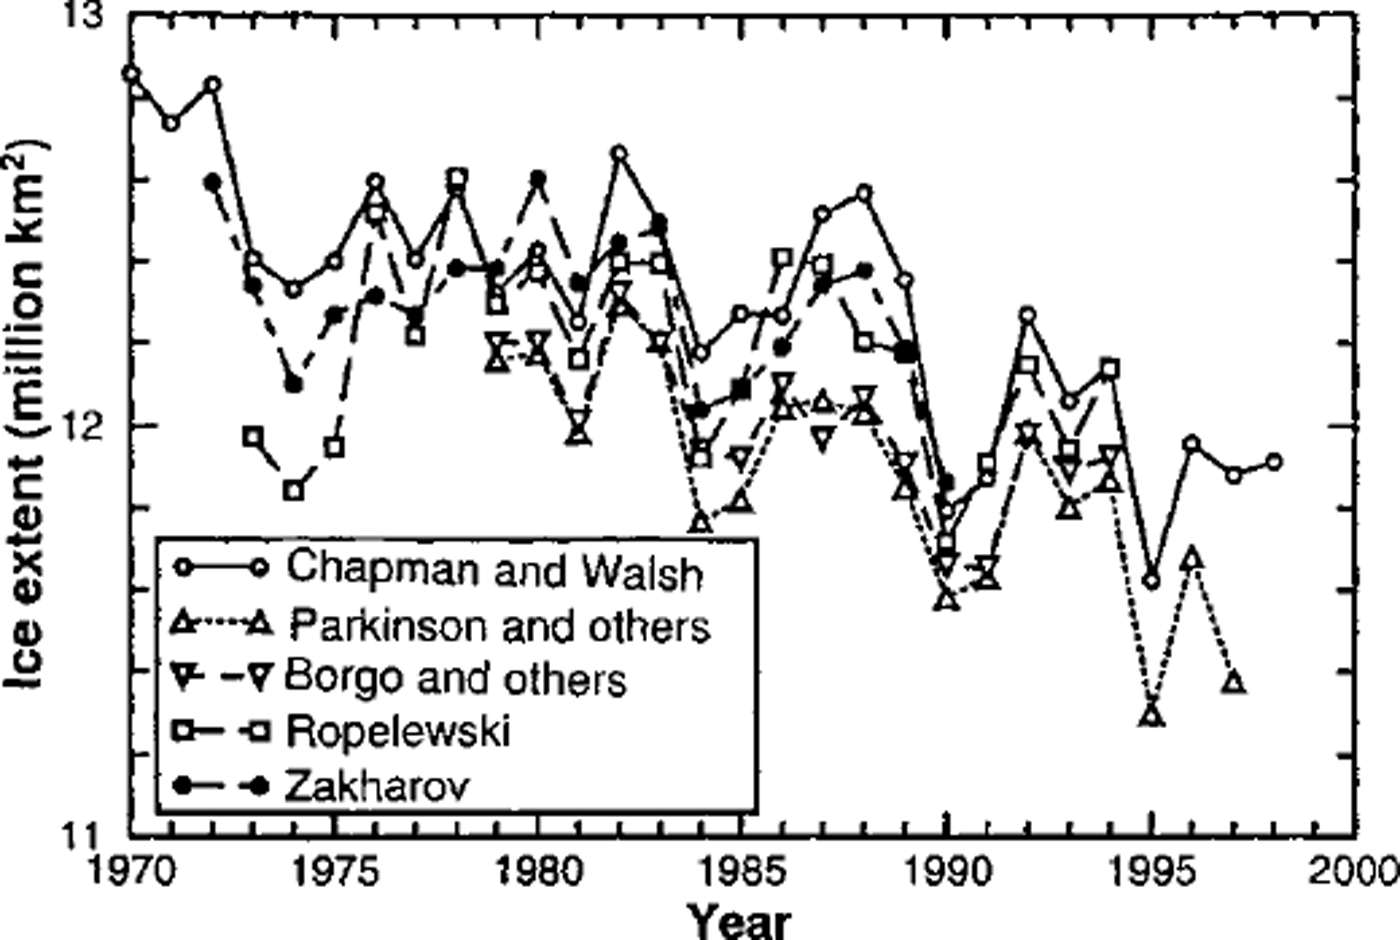
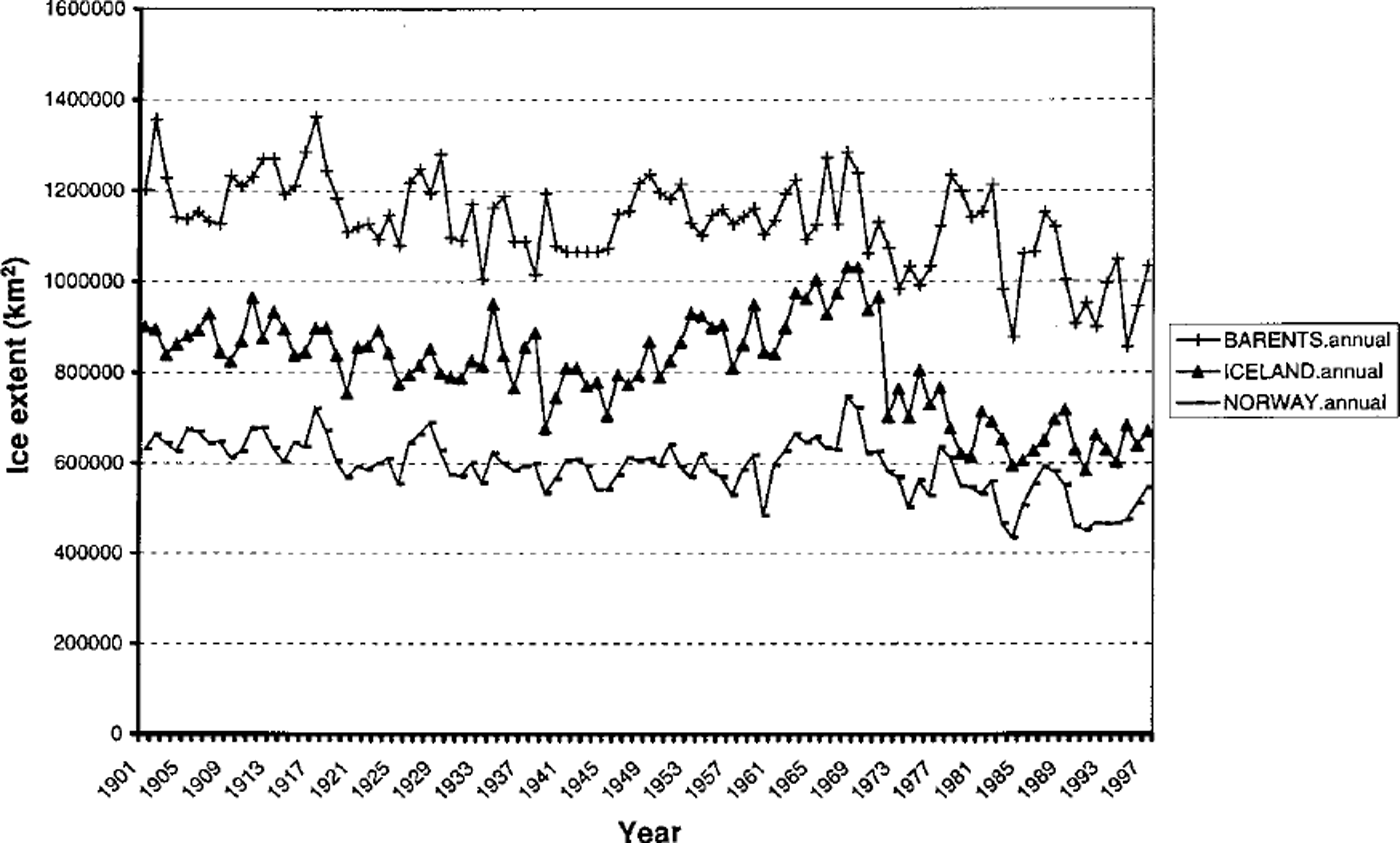
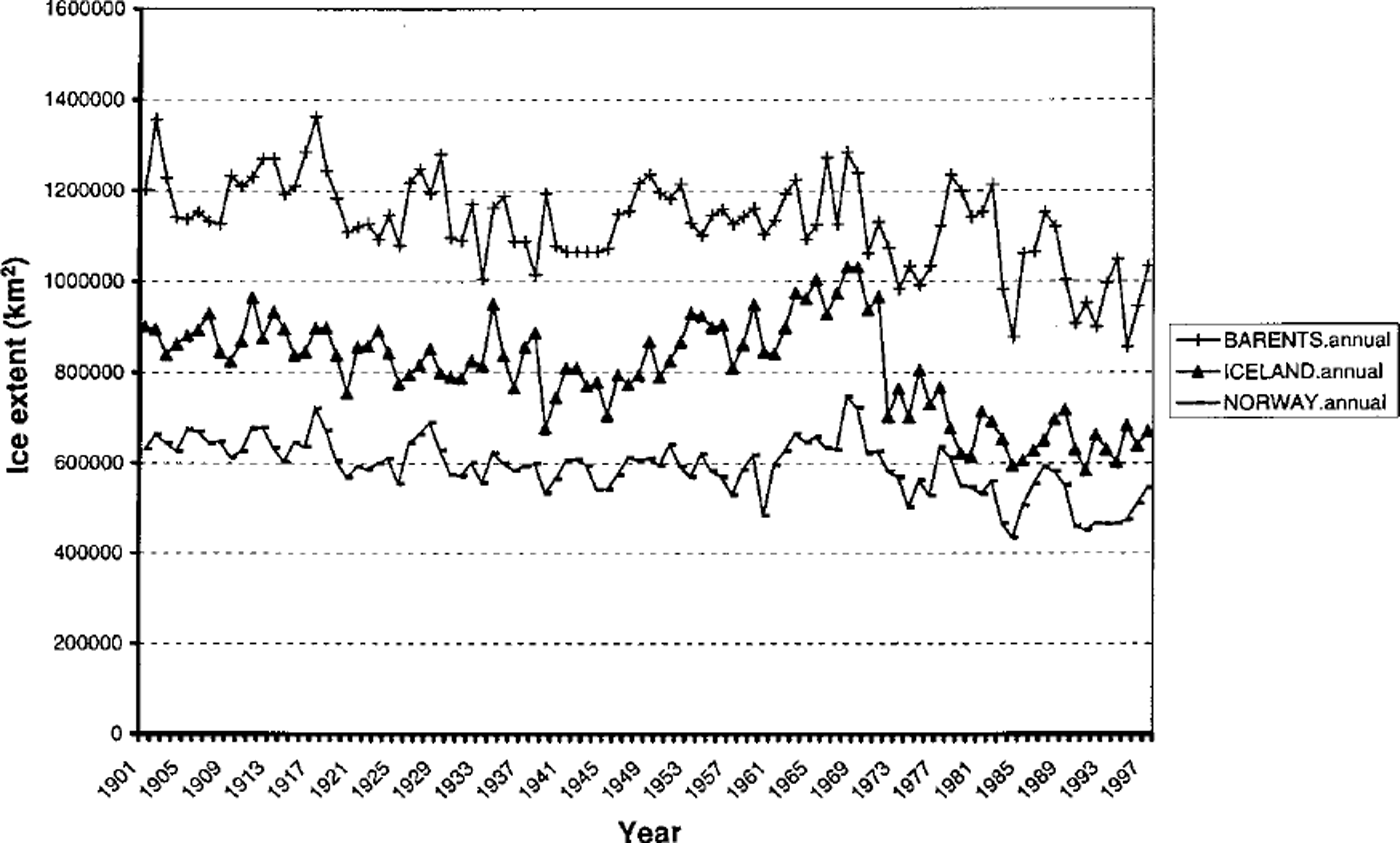
Figure 3 shows several examples of time series of regional ice extent extending back to 1901. These time series are based solely on the Norwegian Polar Institute’s dataset (Reference VinjeVinje, 1999), which is the most recent addition to our consolidated database. The three sectors for which Figure 3 depicts the ice variations are the Barents Sea (60−20° E), the Norwegian Sea (20° E to 10° W) and the Iceland sector (10−45° W). In all three sectors, the annual mean ice extent shows a negative trend. The trend is somewhat larger in the Barents and Iceland sectors, where linear regression lines indicate decreases of 15−20% from the beginning to the end of the century. However, the decreases are not linear. Rather sharp reductions in ice extent occurred from the late 1960s to the early 1970s, particularly in the Iceland sector. This decrease followed the period of relatively heavy ice conditions and low temperatures in the late 1960s, which is also the period during which the so-called "Great Salinity Anomaly-migrated through the subpolar seas of the northeastern North Atlantic (e.g. Reference Dickson, Lazier, Meincke, Rhines and SwiftDickson and others, 1996).
Annual mean sea-ice extents (1901−98) for the barents (+), iceland (Δ), and norway (-) sectors (defined in text).
The total hemispheric ice extent for 1901−97 is shown on a seasonal and annual basis in Figure 4, which is based on the consolidated dataset (including the Norwegian data in the pre-satellite period and the SMMR/SSM/I passive-microwave satellite data from 1978 onward). In agreement with Figure 3, the annually averaged ice extent shows a decrease of approximately 10%, although this occurred primarily during the second half of the century. A salient feature of Figure 4 is the seasonality: the negative trend is largest in summer (followed by spring and autumn), but is very small in winter. The summer trend, as measured by a least-squares fit to the century-long time series, represents a reduction of approximately 10% from the values early in the century. The extreme summer ice retreats of the 1990s (Reference Maslanik, Serreze and AgnewMaslanik and others, 1999) are consistent with the summer time series of Figure 4, even without the inclusion of the extreme summer minima of 1998 and 1999 in our figure. The summer decrease will be even larger when those years are included.
Time series of annual, winter (JFM), spring (AMJ), summer (JAS) and autumn (OND) mean northern hemisphere sea-ice extent for the period 1901−97.

The seasonality of the observational trends in Figure 4 raises a key question about the greenhouse simulations of global climate models. As noted by Reference Manabe, Spelman and StoufferManabe and others (1992) and Reference VinnikovVinnikov and others (1999), among others, greenhouse simulations by climate models show the largest reductions of ice coverage in winter and autumn. Yet the data indicate that the decrease is greatest in summer and smallest in winter, implying that (1) attribution of the recent trends to anthropogenic forcing is questionable, and/or (2) the model simulations are failing to capture the sea-ice variations of recent decades.
In order to address further the seasonality of the sea-ice variations in the Arctic, we have evaluated the dominant modes of seasonal variability in terms of empirical orthogonal functions (EOFs). Figure 5 shows the first EOFs of winter and summer variability of ice extent over the 1901−97 period. The leading mode of winter variability is dominated by an opposition of anomalies in the western North Atlantic (Baffin Bay, Labrador Sea) and the eastern North Atlantic (Greenland-Norwegian-Barents Seas). This pattern is consistent with a forcing of the wind and temperature anomalies of the North Atlantic Oscillation (NAO), as noted decades ago by Reference Rogers and van LoonRogers and Van Loon (1979). More recently, the NAO has been shown to be part of a broader atmospheric circulation mode, the so-called Arctic Oscillation (AO; Reference Thompson and WallaceThompson and Wallace, 1998). A much weaker dipole is apparent in Figure 5 in the Pacific sector, where the first winter EOF contains opposing anomalies in the eastern Bering Sea and the region to its west. The opposition of anomalies, especially along the longitudinally broader North Atlantic ice edge, is likely a key factor in the absence of any large wintertime trend in total hemispheric ice extent during the past century (Fig. 4). The leading wintertime EOF and its time series are also consistent with the large negative trends in the northeastern North Atlantic (Fig. 3), and there has been a well-documented shift of the wintertime NAO to its positive phase during the past few decades (Reference Dickson, Lazier, Meincke, Rhines and SwiftDickson and others, 1996; Reference Deser, Walsh and TimlinDeser and others, 2000).
The first eofs of sea-ice extent for (a) winter (JFM) and (b) summer (JAS) based on data for the period 1901−97. light (with dashed contours) and dark shaded regions denote anomalies of opposite sign.
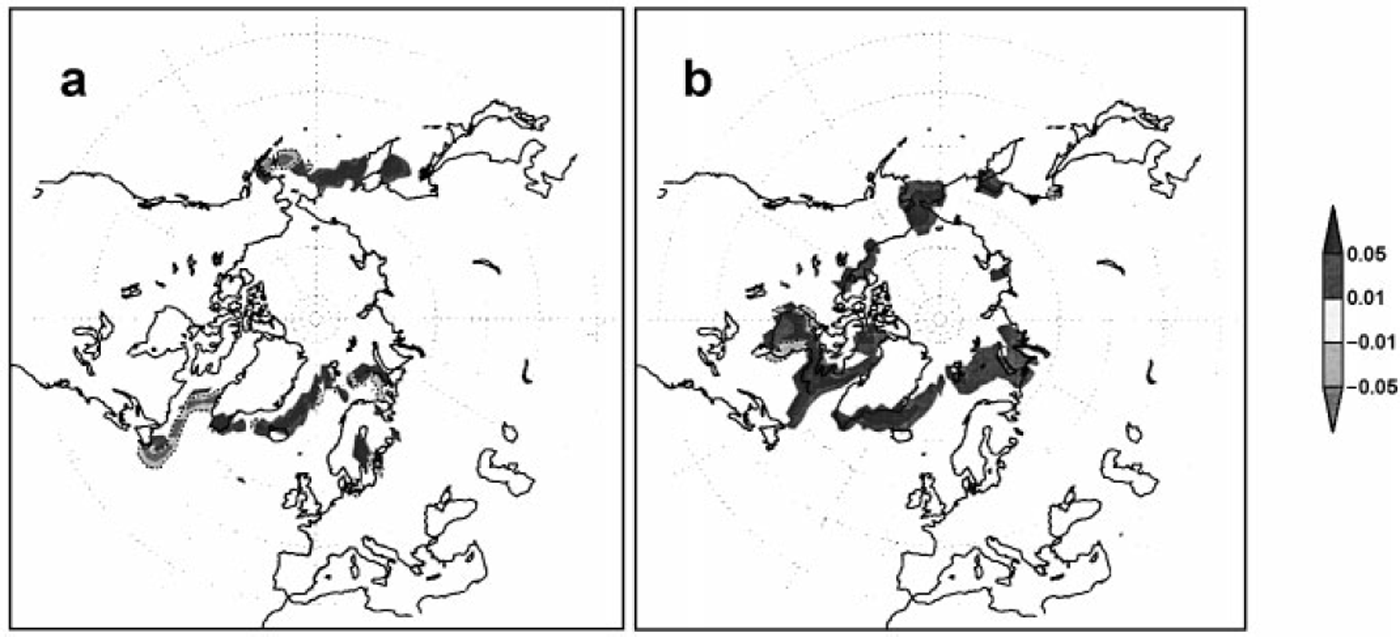
The first summertime EOF (Fig. 5b) displays a quite different character relative to its wintertime counterpart. The leading summer mode contains anomalies of the same sign over nearly the entire marginal ice zone. Figure 5b implies that offsetting anomalies are less common than Arctic-wide anomalies during summer. The time series of the pattern in Figure 5b shows a negative trend over the past half-century, consistent with the recent summertime decrease of Arctic ice extent. Indeed, the large decrease in summer relative to winter may be a manifestation of this absence of compensation of anomalies during summer.
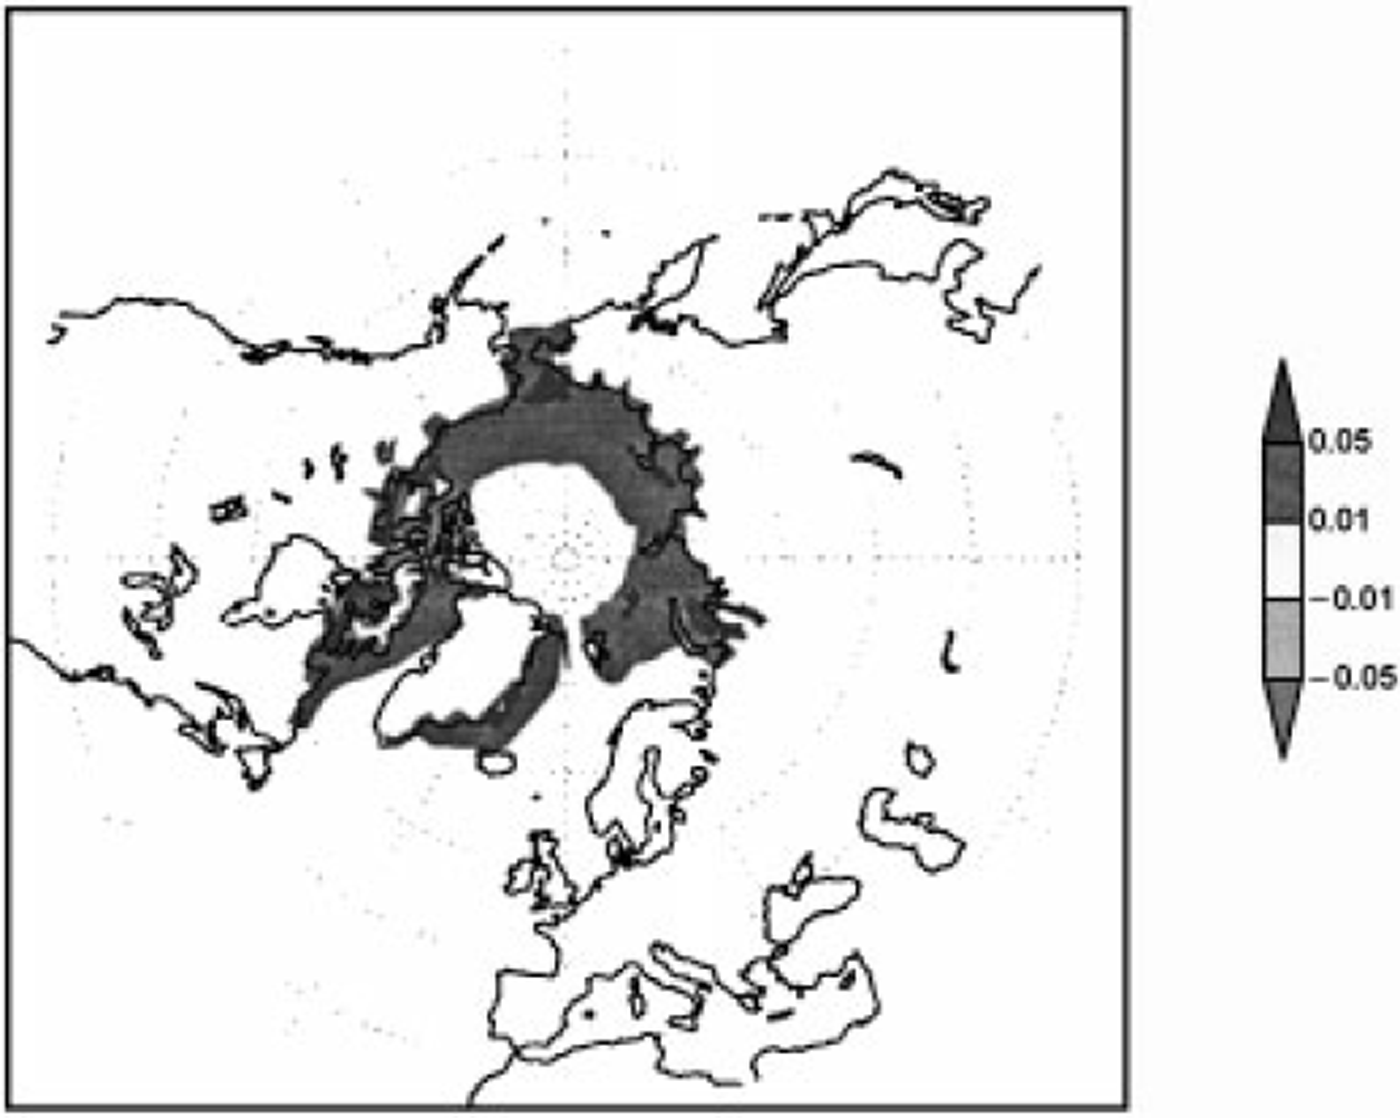
Finally, Figure 6 shows the first EOF of summertime sea-ice concentration (not ice extent as in Fig. 5b) for the shorter and more recent period, 1953−97, over which there are more available data on sea-ice concentration. The time series of this EOF contains a large negative trend over the 4−5 decades, consistent with the recent extreme summer ice retreats in the central Arctic. The broad manifestation of a recent decrease of ice coverage is also compatible with an increased inflow of warm Atlantic water to the Arctic Ocean (Reference McPhee, Stanton, Morison and MartinsonMcPhee and others, 1998). Interestingly, Figure 6 and its time series also imply negative trends over the Siberian shelf seas, a region excluded (by data unavailability) from Reference Rothrock, Yu and MaykutRothrock and others’ (1999) demonstration of a substantial decrease of ice thickness in the Arctic Ocean in recent decades.
The first EOF of summer (JAS) ice concentration for the period 1953−97.
Conclusion
The results described here are based on a consolidated dataset that represents an attempt to optimize the existing information on 20th-century variations of Arctic sea ice. While we have shown that datasets from different sources are generally compatible over the past 2−3 decades, there will likely be opportunities to improve the hemispheric dataset for the earlier decades, particularly if additional data for the Canadian and North Pacific sectors can be included.
The primary conclusion of the century-scale analysis is that sea-ice extent has decreased substantially in the Northern Hemisphere, primarily during summer. While a wintertime decrease has occurred in the eastern North Atlantic, this is largely offset by increases elsewhere and is likely driven by decadal-scale variations of the NAO or its broader manifestation, the so-called AO.
Two issues pertaining to attribution arise from the results presented here. The first is the contrasting seasonality of the changes of ice extent in the observational data and in greenhouse simulations by global climate models. The second is the absence of corresponding variations of Antarctic sea ice, which shows no decrease (and even a slight increase) in analyses of satellite data for the past two decades (Reference Cavalieri, Gloersen, Parkinson, Comiso and ZwallyCavalieri and others, 1997). While whaling logs provide hints of a decrease of Antarctic sea ice earlier in the century (Reference De la Marede la Mare, 1997), the evidence is highly uncertain and in need of corroboration by more rigorous analysis. These issues of seasonality and hemispheric asymmetry must be resolved before climate-model scenarios for the polar regions can be accepted with confidence.
Acknowledgements
This work was supported by the NASA Polar Program through grant NAG5−6836 and by the NOAA Office of Global Programs through grant NA86GP0528. We thank I. Shapiro for processing the Norwegian sea-ice data, D. Barnett and R. Chapman for compiling and digitizing various regional ice-source data, and M. Timlin for assistance with the EOF computations.