


1. Introduction
In many high-mountain environments, recent downwasting of debris-mantled glaciers has been associated with the formation of large, potentially unstable supraglacial lakes, ponded by dead ice or end moraines (Reference YamadaYamada, 1998). By insulating ice from solar radiation and diurnal temperature fluctuations, a debris cover more than a few centimetres thick inhibits ablation, rendering the glacier surface relatively insensitive to climatic change. However, where the debris cover is broken by crevasses or other holes on the glacier surface, local ablation rates may be very high (e.g. Reference Sakai, Nakawo and FujitaSakai and others, 1998). This is especially the case around the margins of supraglacial lakes, where bare ice cliffs can be subject to both melting and calving processes (Reference KirkbrideKirkbride, 1993; Reference Hochstein, Claridge, Henrys, Pyne, Nobes and LearyHochstein and others, 1995; Reference Kirkbride and WarrenKirkbride and Warren, 1999; Reference Benn, Wiseman and WarrenBenn and others, 2000; Reference Sakai, Takeuchi, Fujita and NakawoSakai and others, 2000). Under certain conditions, supraglacial lakes may undergo rapid growth, creating severe hazards to settlements and infrastructure located downstream (Reference Lliboutry, Arnao, Pautre and SchneiderLliboutry and others, 1977 a, Reference Lliboutry, Arnao and Schneiderb; Reference ReynoldsReynolds, 1999; Reference Richardson and ReynoldsRichardson and Reynolds, 2000a). Large lakes can also form where glaciers or moraines block drainage in adjacent valleys, presenting additional flood hazards during periods of glacier retreat (Reference Clague and EvansClague and Evans, 2000).
In the Himalaya, numerous glacier lake outburst floods (GLOFs) have occurred in recent decades, when lakes have breached dams of moraine or dead ice (e.g. Reference Vuichard and ZimmermannVuichard and Zimmermann, 1987; Reference Yamada and SharmaYamada and Sharma, 1993; Reference Richardson and ReynoldsRichardson and Reynolds, 2000b). Several potentially hazardous supra-glacial lakes have been identified, including the Tsho Rolpa in Rolwaling and the Imja in the Khumbu Himal (Reference YamadaYamada, 1998; Reference ReynoldsReynolds, 1999; Reference Richardson and ReynoldsRichardson and Reynolds, 2000b; Fig. 1a). The Nepal Himalaya have experienced significant warming since the 1970s (Reference Shrestha, Wake, Mayewski and DibbShrestha and others, 1999), and if this trend continues, such lakes may develop on the surfaces of many other debris-mantled valley glaciers in the region, increasing the risk of GLOFs (Reference Nakawo, Yabuki and SakaiNakawo and others, 1999). The response of debris-mantled glaciers to climate forcing is nonlinear, in that slow melting beneath a debris layer can lead to a threshold whereupon rapid lake growth by calving becomes the dominant ablation mechanism (Reference Kirkbride and WarrenKirkbride and Warren, 1999) . Many large Himalayan valley glaciers are currently so far out of equilibrium with climate that they may cross the threshold into rapid supraglacial lake growth in the coming decades even if the recent warming trend halts or reverses (Reference Naito, Nakawo, Kadota and RaymondNaito and others, 2000). There is thus a need for studies of the factors controlling the evolution of supraglacial lakes in the Himalaya, to develop an understanding of the probable future response of debris-mantled glaciers to climate change, and the associated GLOF hazard potential.
(a) Part of Khumbu Himal, showing large moraine-dammed or supraglacial lakes and the location of Ngozumpa Glacier, (b) Distribution of supraglacial lakes on Ngozumpa Glacier, 6 October 2000, taken from a Système probatoire pour l’observation de la terre (SPOT) panchromatic image. The dashed area shows the extent of Lake 7092 in October 1999.
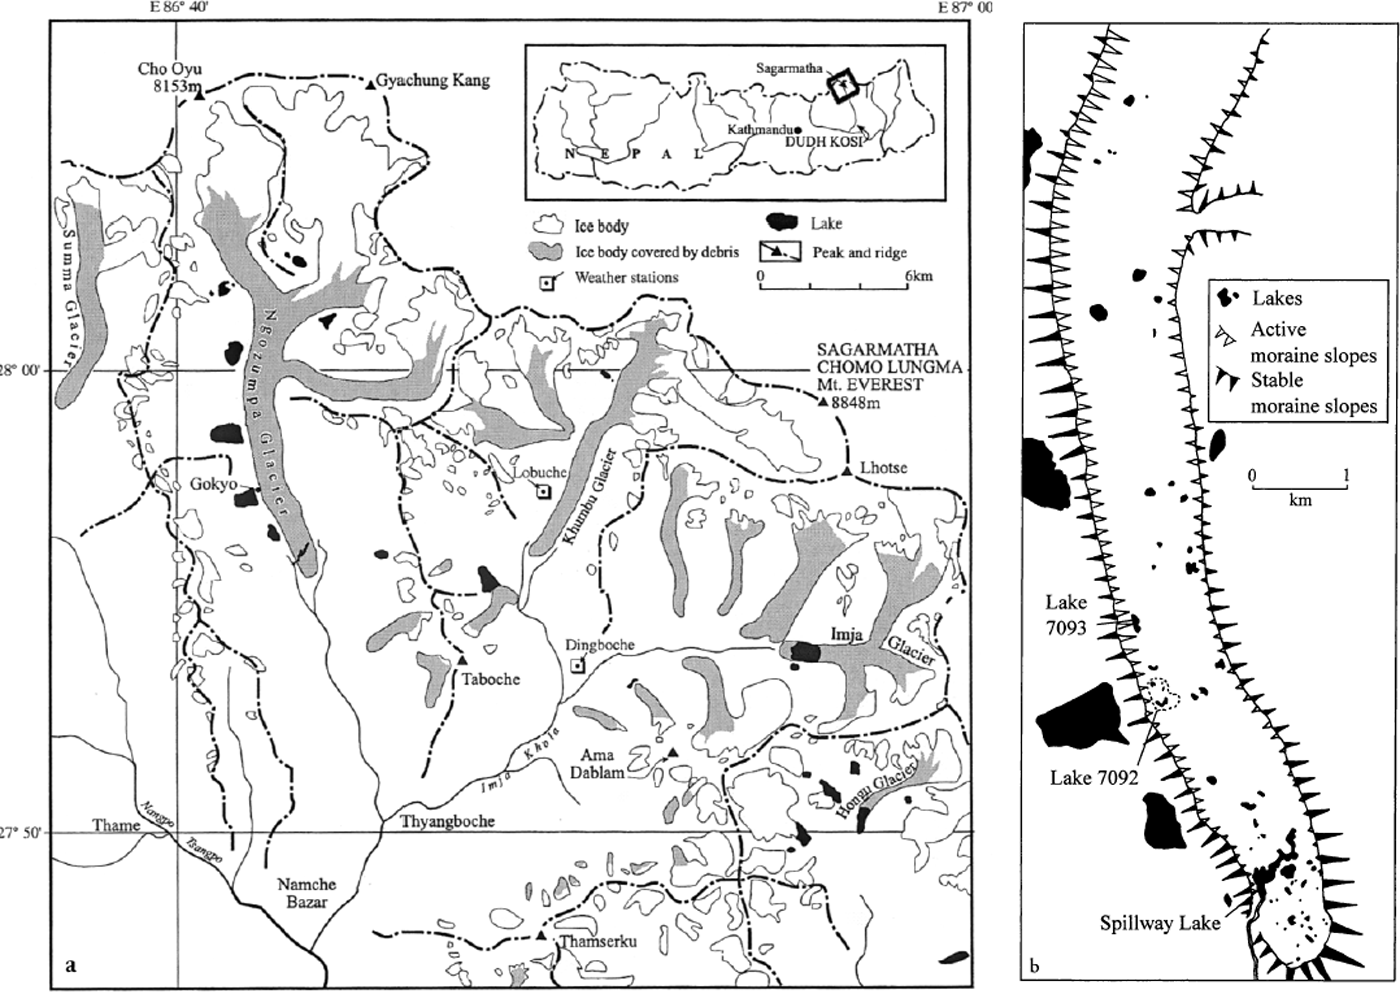
In this paper, we construct a qualitative model of supra- glacial lake evolution based on field observations of a range of lake types and their changes over time. We identify a number of controls on lake development and provide a framework for predicting the evolution of potentially hazardous lakes on glacier surfaces. This study focuses on Ngozumpa Glacier, a 25 km long valley glacier located in the upper Dudh Kosi catchment, about 20 km west of Sagarmatha (Mount Everest). The glacier has undergone significant downwasting in recent decades, has numerous supraglacial ponds and lakes on its debris-mantled ablation area, and may lie close to the threshold for rapid lake coalescence and expansion. Several large moraine-dammed lakes located along the western margin of the glacier may be destabilized by future downwasting, but these are not discussed in the present paper.
2. Ngozumpa Glacier
The Ngozumpa is nourished in two complex basins to the south of Cho Oyu (8188 m a.s.l.) and Gyachung Kang (7922 m a.s.l.), by a combination of direct snowfall and avalanching (Fig. 1a). Snowfields extend up to altitudes of 6400–6800 m, and large avalanche cones fringe the base of extensive, precipitous headwalls, which are commonly >1000 m high. Formerly, the glacier had a third major tributary, the Gaunara, but this is no longer dynamically connected to the Ngozumpa. No systematic ice-temperature measurements have been made on the glacier, although studies on nearby Khumbu Glacier (Reference Mae, Wushiki, Ageta and HiguchiMae and others, 1975; Reference MaeMae, 1976) and the extreme altitude (and low temperatures) of the glacier accumulation areas strongly suggest that much of the glacier is below the pressure-melting point.
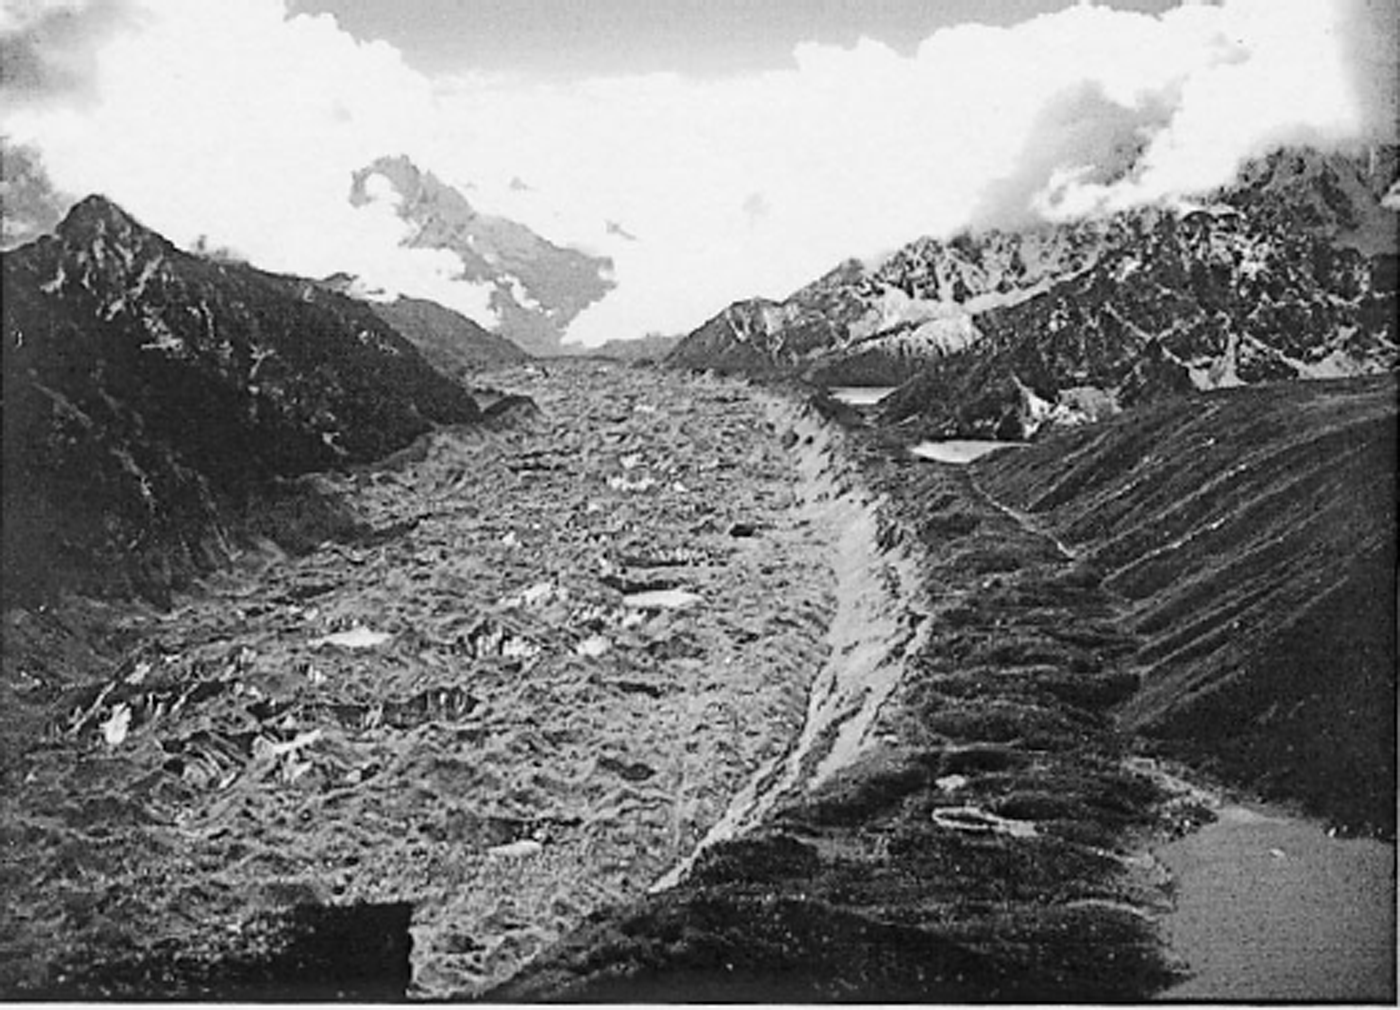
The lowermost 15 km of the Ngozumpa (below about 5200 m a.s.l.) is almost completely mantled by supraglacial debris. The debris mantle originates as medial moraines below the equilibrium line, and thickens down-glacier to about 1–2 m on the lower snout at about 4700 m a.s.l. The debris-mantled glacier surface is highly irregular, consisting of numerous hollows and intervening plateaux, ridges and conical peaks, with a typical relief of about 20–50 m. Many of the hollows are occupied by supraglacial ponds and lakes, which are flanked by bare-ice cliffs or scree slopes of debris- covered ice (Figs 1b and 2). Observations to date indicate that ablation rates in the vicinity of the terminus are negligible, except where the debris cover is broken and bare ice exposed.
The lower ablation area of Ngozumpa Glacier, looking south. Note the lakes dammed up by the west (right) lateral moraine, landslips on the inner face of the moraine, and the numerous supraglacial ponds.
The glacier does not have a connected supraglacial drainage system, and over most of the ablation area, surface meltwater flows into closed basins. In several places, however, water drains into moulins and undergoes englacial and possibly subglacial transport. In addition, a large melt-stream emerges from the terminus of the Gaunara, and enters a moulin on the eastern side of the Ngozumpa. Meltwater emerges from subaerial and subaqueous portals near the glacier terminus (described in section 7). The presence of moulins and active portals indicates that much of the long-distance transport of supraglacial meltwater is via englacial and possibly subglacial conduits.
With one exception (“Spillway Lake”, Fig. 1b) all of the lakes observed to date appear to have no perennial connection to the englacial/subglacial drainage system, and occupy closed basins with respect to surface drainage. The lakes are stagnant, except where disturbed by wind or falling debris, and show no evidence of either upwelling or drawdown of water. These lakes are referred to here as perched lakes because they are held above the englacial base-level by essentially impermeable glacier ice. In contrast, the level of Spillway Lake is controlled by the altitude of an overspill channel cut through the western lateral moraine. This has important implications for the future evolution of the lake, explored in detail below.
3. Methods
Repeated surveys and observations were made of Spillway Lake and two perched lakes: Lake 7092, on the western side of the glacier adjacent to Gokyo, and Lake 7093, approximately 1 km further north (Fig. 1b). (Perched lakes are labelled by their four-figure grid reference on the Survey of Nepal 1:50 000 maps.) Surveys were made of each lake in October 1998, October 1999 and October 2000. Triangulation from a measured baseline and single-station surveys were conducted using a Leica TR1000 theodolite and Dior 3002S distomat (1999 and 2000) and Abney Level and Suunto compass (1998). Repeat measurements were made in 1999 of bearings taken to fixed points in 1998, and the 1998 measurements were found to be accurate to within ±0.5°, which equates to a horizontal accuracy of ≤2 m for points in the surveyed areas. The 1999 and 2000 measurements were considerably more accurate, with a horizontal accuracy of ≤0.03 m. Bathymetric measurements were made of Lake 7092 on 25 October 1999 and of a limited part of Spillway Lake on 27 October 1999, when both lakes were frozen to a depth of ∼15 cm. Holes were cut in the ice, and soundings taken with a Low- rance LMS-350A sounder. The lakes were also visited in April 1999, when photographic surveys were undertaken.
To obtain data on the contribution of melting to lake basin expansion, measurements were made of subaerial and water-line melt of bare-ice faces adjacent to Lake 7092, on 13–16 October 1998. Subaerial melt rates were determined by measuring the progressive exposure of wooden dowels emplaced in ice faces with westerly, southerly and easterly aspects. Hourly radiation inputs and outputs normal to the ice were determined for each site using a Kipp and Zonen CM3 pyranometer (0.3–3.0 μm) and NR Lite net pyrgeometer (0–100 μm). Measurements of air temperature, humidity and wind speed at 2 m above ground were used to calculate energy fluxes associated with sensible-heat transfer H and evaporation and condensation of water vapour L using a bulk transfer approach (Reference PatersonPaterson, 1994):

where A is a bulk transfer coefficient (taken as 0.2 × 10⁻³), P is air pressure (extrapolated from the Pyramid weather station, Lobuche, Fig. 1), u is wind speed, T is air temperature, T s is the temperature of the ice surface (0°C), and e and e s are air and ice-surface vapour pressure (calculated from air pressure and temperature). Water-line melt rates were determined at one site, measured relative to a dowel emplaced in the ice above the water-line.
Width-averaged annual retreat rates for melting and calving ice faces were obtained from the survey data. Repeated observations and photographic records were made to determine processes and patterns of calving. In addition, general observations were made of other parts of the glacier in the period 1998–2000 to establish a wider context for the detailed observations.
4. Perched Lakes
4.1. Lake 7092
Between 1998 and 2000 this lake underwent rapid expansion then almost completely drained. The expansion phase (1998–99) has been described in detail by Reference Benn, Wiseman and WarrenBenn and others (2000) and is briefly reviewed here. In October 1998, three small lakes occupied a closed basin on the glacier surface to the east of Gokyo (Figs 3a and 4a). When it was visited again in April 1999, water level in the southern part of the basin had risen by about 2 m, causing the southern and central lakes to join. In general, there was little change in the overall size of the basin between October 1998 and April 1999, although during April calving of large spalls in the eastern and southeastern parts of the basin was leading to ice-cliff retreat in these areas.
Photomontages of Lake 7092 in (a) October 1998, (b) October 1999 and (c) October 2000. In (b) the numbers indicate calving failure surfaces. M, thermo-erosional notch.

Maps of Lake 7092 in (a) October 1998, (b) October 1999 and (c) October 2000. In (a) spot heights and the surface heights of lakes B and C are in metres above the surface of lake A; in (b) heights are in metres above the contemporary lake surface.

Large changes occurred in the basin between April and October 1999 (Figs 3b and 4b). Lake level rose during the summer monsoon, forming a single large lake in the basin, the surface of which was 8.8 m above the October 1998 level of lake A. The lake basin also underwent dramatic expansion, particularly along the southern and eastern margins, where the lake was in direct contact with steep ice faces. At the beginning of October 1999, the lake had an area of 52 550 m2, compared with 17 890 m the previous year. Part of the increase in area was due to flooding of the northern and central parts of the basin, but 18 900 m2 (∼36%) was accomplished by retreat of ice cliffs. The greatest changes occurred in the southeastern part of the basin, where the ice cliff retreated by about 100 m during the summer season. Mean retreat around the entire eastern and southern perimeter was 31 m during the same period. In total, approximately 340 000 m3 of ice and rock debris was removed from the lake margins, mainly by calving of ice faces. The exceptionally rapid backwasting of the southeastern margin of the lake probably relates to the presence of closely spaced longitudinal crevasse traces in this area, providing pre-existing weaknesses to be exploited by calving (see section 5 below). In October 1999, the lake was the largest perched lake on the glacier; the southern part of the lake extended almost 300 m east–west, or about 30% of the width of the glacier at this point (Fig. 1b).
When visited again in September 2000, the lake had almost completely emptied, and only ponds remained in the deepest parts of the basin (Figs 3c and 4c). Local enquiries determined that drainage of the lake occurred sometime during the monsoon months of July and August. The basin itself had undergone further expansion since October 1999, presumably mainly during the spring and early monsoon seasons of 2000. Ice cliffs had retreated by 10–20 m along much of the eastern basin margin, with retreat of 50–60 m in the northeastern and southeastern corners. Most rapid basin expansion thus occurred in the same areas as in 1998–99, again attributable to calving exploiting pre-existing weaknesses in the ice. Comparison of photographs taken in 1998 and 2000 (Fig. 3a and c) reveals no detectable change in topography or boulder configuration in the central and western parts of the basin floor, showing that there had been no significant subaqueous or subaerial melting in the intervening period. Three of the ponds remaining on the basin floor occupied the same depressions as lakes A–C in 1998.
Englacial conduits were exposed at three localities along the southeastern margin of the basin. The largest of these extended northeast and southwest from the ends of a scalloped overhung recess in the ice cliff (C1, Fig. 4c). The entrance to the northeastern portion was about 3 m high, and had an inverted “T” cross-section (Fig. 5a). The upper part of the conduit followed the outcrop of a debris band. Approximately 10 m from the entrance, the lower part of the inverted “T” terminated at a vertical wall, whereupon the upper part rose at a gentle angle towards the glacier surface. Light could be seen coming from the far end of this conduit, indicating a connection to the surface. The southwestern portion of the conduit, at the righthand end of the overhung recess, was an oval cave 4 m wide and 3 m high. The cave diminished rapidly in height with distance from the entrance, and showed clear signs of roof collapse. Another conduit was exposed in the ice cliff to the northeast of the overhung recess (C2, Figs 4c and 5). This conduit was about 4 m wide, cut across a debris band within the ice. At the right-hand end, a vertical groove in the ice cliff led down from the conduit mouth, thermally eroded by water cascading from the conduit following drainage of the lake. A third conduit was exposed at the back of a large hole in the ice cliff (H, Fig. 4c). The 5 m wide hole was surrounded by angular ice blocks, and forms part of a larger area affected by subsidence and collapse. There is no evidence that large amounts of water had flowed through the hole, indicating that the hole was formed by subsidence after drainage of the lake. The back of the hole intersected a northeast–southwest-oriented conduit, the floor of which was occupied by a stream, possibly the downstream continuation of C1. It is concluded that the lake drained when a calving event exposed the conduit at C1, which was then enlarged by thermal erosion during lake drainage, both downstream and headward of the efflux point, producing the distinctive conduit cross-profile. Lake drainage was followed by local collapse of the enlarged conduit.
Englacial conduit C1. Note the enlargement of the lower part of the conduit caused by outflowing water during lake drainage.

There is evidence that a deeper lake occupied the basin sometime prior to autumn 1998. In that year, drapes of laminated silts and sands were observed on the hummocky debris-mantled ice in the west-central part of the basin, attesting to water levels at least 12 m higher than the autumn 1998 level. Photographs taken in 1995 (personal communication from A. Sakai, 2000) show a lake in the basin. The basin appears to have been similar in area to that in 1998, but was flooded to a greater depth. Thus, changes observed in the period 1998–2000 are part of a repetitive cycle of lake expansion and drainage.
4.2. Lake 7093
This lake is nestled between the glacier surface and the west lateral moraine, about 1 km north of Lake 7092. In October 1998 it was about 170 m long with an area of 3870 m2, and entirely flanked by hummocky debris-mantled ice or scree slopes (Fig. 6a). No bare ice was exposed around its margins. By October 1999, the lake had expanded to 250 m in length and 13 550 m2 in area, and lake level had risen by about 9 m (Fig. 6b). In the northern part of the lake basin, most or all of the expansion was accomplished by flooding of the low ground surrounding the lake, but lake growth in the southern part was largely due to the development and retreat of bare- ice cliffs. The ice cliffs had started to form by April 1999, but were very limited in extent. Thus, most ice-cliff retreat occurred during the 1999 monsoon season, and by October of that year extended along 125 m (about 20%) of the lake perimeter and rose 10–27 m above the lake surface. Average retreat of the ice cliffs for the 1 year period was 51.6 m. The morphology of the ice cliffs, and numerous icebergs floating in the lake in October 1999 indicate that much of the ice-cliff retreat was by calving. Retreat of subaerially melting ice faces in the basin (with a similar westerly aspect) was 15.0 m in the same period (mean for 1998–2000 = 13.7 m). In October 2000, the level of Lake 7093 was about 1 m higher than in the previous year. Lake area, however, had decreased to 11 260 m2 (reduction by about 17%) due to the progradation of talus aprons into the southeastern part of the lake (Fig. 6c). Part of the talus appears to have originated as a large debris slide, which exposed a sloping ice face back from the former ice-cliff top. As a result of talus build-up, no ice faces remained in contact with the lake, so calving and water-line melting no longer contributed to ice ablation around the lake margins.
Maps of Lake 7093 in (a) October 1998, (b) October 1999 and (c) October 2000. In (b) the spot heights are in metres above the lake surface and (in parentheses) above the 1998 lake surface.

During the study period, a large steep-sided depression on the glacier surface approximately 150 m northeast of Lake 7093 underwent rapid evolution. In October 1998, the sides of the depression were mainly scree-mantled, with limited exposures of ice. By October 1999, the depression had become a large ice-walled moulin, the rim of which was about 130 m across from north to south, and about 65 m across from east to west (Fig. 6b). The rim of the moulin stood about 35 m higher on the east than on the west side. The walls of the moulin consisted of bare ice, except for the uppermost 2 m which were composed of supraglacial debris. During periods of ice melting, water flowed down runnels in the ice walls, into a large open hole. By October 2000 the moulin had become infilled with a talus cone fed from the ice slopes to the east (Fig. 6c). Meltwater from the surrounding ice slopes percolated below the talus and may have continued to enter a buried moulin.
5. Mechanisms of Lake Growth
Repeated observations were made of the processes and patterns of lake growth in the period 1998–2000, and three mechanisms were observed to contribute to ice ablation: subaerial melting, thermo-erosional notching at the waterline, and calving.
5.1. Subaerial melting
Around lake margins and other holes on the glacier surface, exposed ice slopes undergo diurnal melting cycles. Melting of the ice destabilizes the overlying debris mantle, causing debris to slump down the ice, coating it with thin layers of saturated fine sediment and running water. Most ice faces around lakes could not be accessed due to the threat posed by falling rock, but it was possible to conduct ablation experiments on small (<2 m high) ice faces exposed near the eastern shore of Lake 7092 (Fig. 3a). These faces were capped by sandy gravelly debris which intermittently flowed down the ice, and are believed to be representative of exposed ice around the lakes. Melt rates and energy-balance components were measured for five faces, with easterly, southerly and westerly aspects.
During the measurement period 13–16 October 1998, skies were predominantly clear until noon, when fog was advected onto the glacier by the valley wind, so on horizontal surfaces maximum solar irradiance occurred during the late morning (typically around 1000 W m−2; Fig. 7). On steeply sloping ice faces, however, shortwave receipts were strongly influenced by aspect, and were highest on southeast to southwest facing slopes (F2, F4 and F5; Fig. 8) which face the late- morning sun. On such slopes, shortwave receipts >1290 W m−2 were recorded, reflecting the high altitude of the site and low atmospheric attenuation. The albedo of the ice faces was typically ∼0.06, a very low value more typical of water bodies than of glacier ice (cf. Reference PatersonPaterson, 1994; Reference Barry and ChorleyBarry and Ghorley, 1998) , so on suitably oriented faces, absorbed shortwave was very large. Longwave fluxes were generally negative, with positive excursions in the early afternoons due to downward radiation from advected fog. Sensible-heat fluxes were small (due to light winds) and latent-heat fluxes were negligible. Measured ablation rates were typically 0.03–0.045 m d−1 with peak rates on southeast- to southwest-facing slopes, where shortwave radiation receipts were highest. Galculated hourly ablation totals were generally close to the measured values, although there is a tendency for the calculated values to be too high, especially for the early afternoons (Fig. 9). The mismatch is thought to be due to the advection of heat out of the experimental sites by running water and entrained debris. The lower parts of long ice slopes (>10 m) on the glacier are commonly indented by deep rills, which are presumably enlarged by such advected heat.
Short- and longwave energy receipts on horizontal surfaces, 15 October 1998.

Energy-balance components (shortwave, net longwave and sensible-heat flux) for five ice faces on 15 October 1998. Latent-heatfluxes were close to zero and are not shown. Angles refer to ice-face orientation.

Comparison of measured and calculated hourly melt totals for F1–F5, 15 October 1998. The diagonal line represents 1:1 correspondence.

Longer-term average melting rates and seasonal patterns are not known, although melting is likely to be negligible during the winter months (December–February). Heavy snowfall on 18–20 October 1999 resulted in a profound change in the energy budget and ablation rates on the glacier. Prior to those dates, exposed ice was subject to diurnal melting, as in October 1998. Following the snowfall, however, complete snow cover resulted in a large increase in albedo (to ∼0.67), and a corresponding large reduction of absorbed shortwave, despite cloudless skies and high incoming solar radiation. Daily maximum air temperatures also fell dramatically, from 8.4°C on 15 October 1999 to 1.1 °C on 21 October. As a result, ablation on the glacier effectively ceased for the remainder of 1999. Glearly, snowfall events have a marked effect on melting rates on the glacier, but the magnitude of this effect on different time-scales is unknown.
In contrast with the melting of exposed ice around lake margins, ablation of the areas of debris-mantled ice between the lakes is very limited. Gomparison of photographs taken in 1998, 1999 and 2000 showed very little change to debris- mantled ice surfaces, and prominent boulders can be identified occupying similar positions in all three years (Fig. 3). Some boulders, however, toppled over, suggesting that they were destabilized by limited melting of the underlying ice. Reference Conway and RasmussenGonway and Rasmussen (2000) calculated melt rates of 1–2 mm d−1 below 2.5 m of debris on Khumbu Glacier for the late pre-monsoon period, i.e. only about 2–6% of the melt rates for ice faces reported here.
5.2. Water-line melting
Thermo-erosional notching was observed to occur throughout October 1998 and October 2000, and prior to 18 October 1999, after which low air temperatures caused the supra- glacial lakes to freeze over. When the lakes are unfrozen, their low albedo (∼0.07) and high turbidity means that most of the incident shortwave radiation is available to warm surface water (Fig. 7). Warmed water is advected horizontally by wind-generated currents, whereupon it melts ice around the water-line, producing a pronounced notch. Rates of thermo-erosional notching are difficult to determine due to access problems. Experiments conducted in October 1998 indicated water-line melting rates of 0.7–2.7 cm h−1, with melt rates averaging 2.9 times the concurrent subaerial melting rates (Table 1). Longer-term rates are unknown. However, on 24 October 1999, when the lake was frozen, a notch below a non-calving, west-facing ice face bordering Lake 7092 (N, Fig. 3b) was measured to be 3.8 m deep. The site was mantled by scree in October 1998 and April 1999, so erosion of the notch occurred entirely during the summer monsoon and autumn of 1999. The notch at this locality was unusually deep, probably because of the modest height of the ice cliff which inhibited calving and removal of overlying ice.
Measured melt rates at a water-line notch and overlying subaerial ice face, 14 October 1998

5.3. Calving
Numerous calving events were observed during October 1999. Calving was by four main mechanisms, similar to those described by Reference Kirkbride and WarrenKirkbride and Warren (1997).
1. Full-height slab calving. On several occasions, large blocks of ice became detached from ice cliffs by toppling failure, with fracture surfaces partly defined by steeply oriented debris bands or crevasse traces. Full-height slab calving is thus associated with the reactivation and propagation of suitably oriented pre-existing weaknesses. Calving events were typically preceded by gradual widening of such lines of weakness over several days, and final failure took place along fresh, steeply sloping fracture surfaces extending down to (and presumably below) the water-line (Fig. 3). The final failure surfaces typically intersected the waterline well back from the thermo-erosional notch, and therefore appear not to have been controlled by the presence of the notch. Full-height slab calving was very localized during the period of observation, confined to the southeastern part of Lake 7093 and the southern side and northeastern corner of Lake 7092 (Fig. 3b). Calving events were apparently unrelated to weather, and occurred during overcast, wet conditions and clear, cold conditions.
All observed full-height slab calving events occurred where the ice cliffs exceeded 15 m in height. It is suggested that this represents a threshold height required to generate sufficient stress gradients for the reactivation of suitably oriented crevasses. Reference Hanson and HookeHanson and Hooke (2000) have shown that the longitudinal stress deviator increases steeply downward at an unsupported vertical ice face, showing that calving rate is a function of ice-cliff height. Rates will also be influenced by the spacing, orientation and characteristics of pre-existing weaknesses such as debris bands, crevasses and crevasse traces, which influence the tensile strength of the ice. The role of pre-existing weaknesses in controlling patterns of calving around Himalayan supraglacial ponds has also been noted by Reference Richardson and ReynoldsRichardson and Reynolds (2000a).
2. Flake calving. Occurring more frequently than full- height slab calving events, but involving smaller masses of ice, were relatively thin spalls of ice from vertical or overhanging cliffs. Spalls are typically <1 m thick, but may be several metres across. The detachment of spalls appears to be associated with the development of fresh stress-release fractures parallel to the ice face, although due to their inaccessibility, none could be examined in detail.
3. Water-line calving. Some calving events were caused by roof collapse above thermo-erosional notches. The largest observed event released an arcuate mass of ice 28 m long and >1 m high from the roof of a water-line notch beside Lake 7092.
4. Subaqueous calving. Ice flooring supraglacial lakes may become detached and rise to the surface driven by buoyancy (Reference KirkbrideKirkbride, 1993). Lake floors on the Ngozumpa, however, are typically mantled by bouldery debris, which will tend to offset ice buoyancy and suppress subaqueous calving. Debris mantles also reduce subaqueous melt rates (Reference Sakai, Takeuchi, Fujita and NakawoSakai and others, 2000). Only one subaqueous calving event was observed, at the southeastern end of Lake 7093, when a rushing noise was accompanied by the sudden appearance of a berg about 10 m from the ice cliff. Overall, however, we believe that subaqueous calving is infrequent, and of minor importance as a mechanism of the growth of perched lakes on the Ngozumpa.
Reference Kirkbride and WarrenKirkbride and Warren (1997) argued that, at the margin of Maud Glacier, New Zealand, thermo-erosional notching, calving at the water-line, flake calving, full-height slab calving and subaqueous calving form a repeating cycle of processes controlled by the rate of water-line melting. Our observations on the Ngozumpa, however, suggest that, with the exception of thermo-erosional notching and water-line calving, these processes are largely independent. For example, calving retreat of the eastern and northeastern margins of Lake 7092 between April and October 1999 occurred at rates well in excess of short- and long-term water-line melting rates. At these localities, therefore, water-line melting is not the rate-limiting process, and calving rates are controlled by the location and spacing of suitably oriented weaknesses. In localities where such weaknesses are rare or absent, waterline melting can exert a strong control on calving rates. Thus, water-line melting may or may not be the rate-limiting process controlling the retreat of lake-contact ice faces, depending on ice structure and other factors.
6. Changes in the Levels of Perched Lakes
The observations reported above show that perched lakes can undergo large increases or decreases of level. Several possible causes can be proposed to account for such changes:
(1) interannual variations in the balance between precipitation, meltwater runoff and evaporation;
(2) input of calved ice blocks adding water to the lake;
(3) input of rock debris displacing lake water; and
(4) opening or closing of contacts with englacial conduits.
Evidence was presented in section 4.1 that the drainage of Lake 7092 in 2000 occurred when a connection was made with the englacial drainage system. There is compelling evidence elsewhere on the glacier surface that many former lakes have partially or completely drained by making contact with englacial conduits. In several former lake basins, drapes of lacustrine silts and sands are pierced by holes up to about 1 m in diameter, at the centre of subsided hollows. Systems of dry rills lead into the hollows, indicating that water drained through the holes into englacial conduits. It is likely that such connections can be made by several different mechanisms, such as the exposure of conduits by calving events (as evidenced at Lake 7092), the collapse of conduit roofs, lateral migration of conduits, ablation of the lake floor by melting or subaqueous calving, water seepage through debris bands and subsequent piping, and the opening or reactivation of crevasses. The possibility of lake drainage provides a limit to the growth of perched supraglacial lakes, because such lakes can only exist until their floor makes some contact with the englacial drainage system, which becomes more likely as the lake grows larger.
The 9 m increase in the levels of Lakes 7092 and 7093 between October 1998 and October 1999 was part of a lake recharge cycle, following the high levels of 1995 and low levels of 1998. It is possible that the lake lowering-and-deepening cycle was triggered by the opening and subsequent closure of contacts with the englacial drainage system (factor 4 above), although no direct evidence was observed for this. The immediate cause of the increase in the amount of water held in the basin between 1998 and 1999, however, is likely to have been a combination of factors 1–3 above. It is not possible to calculate the annual water balance, including evaporation and meltwater runoff, for the lakes for the study period, due to the lack of comprehensive meteorological data for Ngozumpa Glacier. Data are, however, available for the Pyramid Research Station at Lobuche, about 11 km east of Gokyo (Fig. 1), for 1998 (Reference Bertolani, Bollasina, Verza and TartariBertolani and others, 2000) and 1999 (personal communication from M. Bollasina, 2000). The Pyramid is at an altitude of 5050 m a.s.l. close to the western margin of Khumbu Glacier, in the next north–south valley east of the Ngozumpa. Although not exactly representative of meteorological conditions on the Ngozumpa, the Pyramid data indicate there were some differences between the monsoon seasons of 1998 and 1999 (Table 2). Total precipitation during April–October 1999 was 473 mm, 38.6 mm (8.9%) greater than during the equivalent period of 1998. April and May 1999 were warmer, and June–September 1999 cooler, than during the same months in 1998. Thus, there may have been more precipitation but less runoff from melting on Ngozumpa Glacier during the 1999 monsoon. Thus, overall differences in water balance are likely to have been small, indicating that meteorological factors are unlikely to account for the observed changes in lake level.
Summary meteorological data for April-October 1998 and 1999. from the Pyramid Research Station, Lobuche (5050 m, 86°49′ E, 27°57′ M)

In contrast, calving retreat of the lake margins can account for the change in lake levels. For Lake 7092, the loss of ice and debris from the basin margins between 1998 and October 1999 was ∼340 000 m3, as noted above. Assuming a surface debris layer with a constant thickness of 2 m, the ice volume added to the lake was ∼245 000 m3, or ∼220 500 m3 water equivalent. Bathymetric data indicate that the increase in lake volume in the same period was ∼219 900 m3, remarkably close to the calculated input. (This estimate is based on changes in water level and the 1999 bathymetric measurements, and therefore takes into account the debris volume that entered the lake.) Although the close similarity of the two values is likely to be fortuitous given the spatial resolution of the survey data and other uncertainties, we conclude that the increase in lake level is mainly attributable to calving from the ice surrounding the lake.
Deepening of the lakes occurred concurrently with accelerated calving of the surrounding ice cliffs. It is unlikely that the association between deeper water and faster calving is analogous to the well-known (but incompletely understood) positive correlation between water depths and calving velocities in water-terminating glaciers (cf. Reference Brown, Meier and PostBrown and others, 1982; Reference WarrenWarren, 1992; Reference Hanson and HookeHanson and Hooke, 2000). We suggest that deepening of the supraglacial lakes encourages calving retreat because flooding of talus and ice-block aprons tends to bring ice faces into direct contact with water, whereupon undercutting by thermo-erosional notching can occur. Additionally, deeper water reduces the likelihood of talus accumulation above the water-line, fallen icebergs are more likely to be removed by wind drifting, and ice faces are thus less likely to be buttressed by aprons of debris and ice. It therefore appears likely that water deepening and calving retreat form a positive feedback cycle, together leading to lake expansion. As the lake expands by calving, ice and debris inputs deepen the water, encouraging further calving, and so on. As shown by the evolution of Lake 7093 between 1999 and 2000, however, this cycle can be interrupted if debris supply at the lake margins is sufficient to cause ice-face burial.
7. Spillway Lake
Spillway Lake is a narrow, sinuous water body that extends almost the full width of the glacier, approximately 1 km from its terminus (Figs 1 and 10). The lake has a complex form, with numerous embayments, promontories and islands. Most of the meltwater leaving the glacier passes through Spillway Lake, and exits via a subaerial channel cut into the right (west) lateral moraine. Spillway Lake therefore differs from the perched lakes observed on the Ngozumpa, in that its level is controlled by the altitude of the overflow channel through the western lateral moraine. Water enters Spillway Lake from at least two subaerial portals located just above lake level, and two to three subaqueous portals, which are revealed by the presence of water upwelling to the surface. The upwelling water has a visibly lower suspended sediment content than the ambient water of the lake and is assumed to be colder, since it will emerge from englacial conduits with temperatures at or close to 0°C. (No actual measurements could be made, however, because the lake froze before a boat was available.) It is inferred, therefore, that upwelling is driven by density differences due to both suspended sediment concentrations and temperature. In early November 1999, water depths in the vicinity of the most persistent upwelling were ∼8 m, indicating that the feeder conduit emerges from the glacier at relatively shallow depth.
Map of Spillway Lake, October 1999. The October 1998 lake margin differed significantly in only one area, indicated by dashed line.

Most of the lake margin consists of hummocky debris- mantled ice or ice-cored scree slopes. During the study period, the most extensive area of bare ice was around an embayment and promontory in the western part of the lake (boxed area and inset, Fig. 10). In 1998 and 1999, this ice face was about 80 m long and up to 16 m high, with slopes of 45–90°. By October 2000, ice-face retreat had cut through the promontory, and a new, small ice face had appeared adjacent to the nearby upwelling point. Expansion of this ice face may reflect accelerated ablation around a conduit efflux. The average backwasting rates around the embayment and promontory were 18.9 m (1998–99) and 11 m (1999–2000). The 1999–2000 value includes slopes that were mantled by scree for part or all of the interval. At the times of observation, ablation of exposed ice was entirely by melting, and there was no evidence of calving. It is possible, however, that some retreat was accomplished by the toppling and subsequent melting of blocks of ice undermined by thermal erosion along the water-line. Survey data and comparison of photographs indicate that all other parts of the margin of Spillway Lake underwent only small changes during the study period. In 2000, a new ice face had become exposed along part of the southeastern shore of the lake (not shown), and may act as the locus of accelerated backwasting.
Between October 1998 and October 1999, part of the glacier surface to the north of Spillway Lake underwent large changes (Fig. 10). This part of the glacier was taken by a well- marked trail between Gokyo and the Cho La, a popular trekking pass, and had been stable for some years. During the study period, however, a chain of features indicative of subsidence opened up on the glacier surface, including landslips, chasms and holes, destroying part of the trail. The chain of subsidence features extended up-glacier from close to a melt- water portal, located just above water level beside Spillway Lake. The zone of subsidence clearly reflects the collapse of ice and superficial debris into subsurface voids, most probably a shallow englacial conduit. The area underwent further subsidence during 1999–2000, indicating that Spillway Lake is likely to expand northwards into this area within the next few years.
8. Synthesis and Conclusions
An important contrast exists between Spillway Lake and perched lakes on the Ngozumpa. The level of Spillway Lake is controlled by the moraine barrier at its western end, and the lake will not drain while the barrier remains at its present level. It is likely, therefore, that Spillway Lake will continue to expand until its growth is checked by incision or failure of the moraine dam. In contrast, perched lakes lie above the englacial base level, and are susceptible to periodic drainage if a connection is made to an englacial conduit. Perched lakes are therefore ephemeral features that undergo cycles of expansion and drainage. The growth of perched lakes on the glacier surface is self-limiting, and although they contribute substantially to thinning of the glacier, they are unlikely to evolve directly into large ( >1 km) moraine- dammed lakes.
Four main surface types can be identified on the ablation zone of the glacier:
(1) hummocky debris-mantled ice;
(2) talus slopes;
(3) subaerially melting ice faces;
(4) lake-contact ice faces.
Basin floors underlain by hummocky debris-mantled ice undergo only slow changes (unless subsidence occurs into subsurface voids) reflecting low subaerial and subaqueous melting rates beneath thick debris mantles (cf. Reference Conway and RasmussenConway and Rasmussen, 2000; Reference Takeuchi, Kayastha and NakawoTakeuchi and others, 2000). Ice melting beneath talus slopes is also likely to be small, and talus slopes may prograde into lakes if debris supply is high. For exposed ice faces, measured subaerial melt rates (October 1998) lie in the range 0.03–0.045 m d−1, and mean annual rates of 13.7 and 14.9 m a−1 (October 1998–October 2000) were determined from the surveys of Lake 7093 and Spillway Lake, respectively. Thus, basins may undergo significant expansion by the backwasting of exposed ice faces. However, ice faces may become buried by talus, and thus cease rapid backwast- ing. Reference Sakai, Takeuchi, Fujita and NakawoSakai and others (2000) concluded that, on Lirung Glacier, Nepal, ice faces occupy 1.8% of the debris-covered area but account for 18% of the ablation. On lake-contact ice faces, advection of warmed surface water results in locally high ablation rates along the water-line, producing thermo- erosional notches. Limited data on water-line melting indicate that ablation rates can be ∼3 times faster than the melting of overlying subaerial ice faces. Water-line melting can locally accelerate calving, by undercutting ice faces, although in the areas of most rapid calving water-line melting is not the rate-limiting process. Calving is an important ablation process for ice cliffs >15 m high, with highest retreat rates where there are suitably oriented pre-existing weaknesses in the ice, such as crevasse traces or debris bands. Calving rates of up to 100 m a−1 have been observed in such localities. Average calving retreat rates were 31 and 51.6 m a−1 for Lakes 7092 and 7093, respectively, for October 1998–October 1999, most of which occurred during April–October 1999. Ablation of exposed ice around the margins of supraglacial lakes therefore contributes substantially to local ice wastage, and may account for much of the recent downwasting of the Ngozumpa.
The growth rate of lake basins thus depends upon the surface type. Growth rates are lowest for basins fringed by hummocky debris-mantled ice or talus slopes, and highest where lake-contact ice faces retreat by calving and water-line melting. Available data suggest that subaerially melting ice faces undergo backwasting at rates 20–50% of calving retreat. Lake growth rates may be altered when basin margins change from one surface type to another. For example, lake-contact ice faces may be buried by talus, thus switching off calving and water-line melting and slowing basin expansion. Falls in lake level can also change the dominant ablation mechanism on ice faces from calving to subaerial melting. Alternatively, increases in lake level during basin expansion can help to maintain calving retreat by minimizing the likelihood of shoreline burial by talus or fallen ice blocks. We infer that a positive feedback occurred between calving and lake- level rise for Lake 7092 during the 1999 ablation season, whereby calved ice blocks added to the volume of the lake, which in turn encouraged further calving. The glacier surface can thus be envisaged as a mosaic of surface types, each with characteristic ablation rates, which can undergo transitions to other surface types by a variety of processes. Further measurement of ablation rates and quantification of transition probabilities are important goals for future research on the glacier.
For basins perched above the englacial base level, basin expansion may be slowed or halted when a connection is established between a lake and an englacial conduit. Lake 7092 drained when a conduit was exposed by a calving event, but other mechanisms for making connections can be envisaged. Reference Sakai, Takeuchi, Fujita and NakawoSakai and others (2000) have argued that water draining from supraglacial ponds through englacial conduits can accomplish significant thermal erosion and conduit enlargement, and that subsequent collapse of the conduit roof can create a new lake basin on the glacier surface. A similar process has been inferred for the debris- mantled Tasman Glacier, New Zealand, by Reference KirkbrideKirkbride (1993). Direct evidence for this process is provided by the morphology of conduit Cl exposed adjacent to Lake 7092, and the collapsed topography in that basin and north of Spillway Lake. The conduits observed on the Ngozumpa tend to occur in association with debris bands, indicating that structures may exert an important influence on the englacial drainage system, as well as calving rates.
The channel through the lateral moraine at the western end of Spillway Lake forms the base level for all drainage from the glacier. Thus, if glacier downwasting continues, the growth–drainage cycle of perched lakes will cease when lake basins intersect the base level. When lake level coincides with the base level, lakes will no longer drain by the conduit-connection mechanism, and monotonic lake growth will ensue, provided the moraine barrier remains at its present level. Spillway Lake is already in that condition, and other lakes within about 2 km of the glacier terminus may be at or close to it. Depending on the rate of spillway incision relative to lake expansion, Spillway Lake and other lakes near the terminus may grow and coalesce to occupy a large area of the lower snout, as has happened on Imja,Tsho Rolpa and other glaciers in the region (Reference Yamada and SharmaYamada and Sharma, 1993; Reference Chikita, Yamada, Sakai and GhimireChikita and others, 1997, Reference Chikita, Jha and Yamada1999; Reference YamadaYamada, 1998; Reference ReynoldsReynolds, 1999) . Between 1998 and 2000, growth of Spillway Lake was limited and localized, due to an insulating mantle of debris cover around most of the lake margins. Localized backwast- ing of exposed ice faces and evidence for extensive glacier surface subsidence up-glacier from a meltwater efflux point, however, suggests that the lake has the potential for rapid growth in the coming years.
Acknowledgements
Fieldwork was funded by The Carnegie Trust for the Universities of Scotland, the Universities of Aberdeen and St Andrews, and the Russell Trust. We are indebted to M. Bollasina, L. Bertolani and G. Tartari for generously supplying unpublished meteorological data from the Pyramid Research Station. Grateful thanks are offered to C. Warren, V. Kerr, T. Harrington, S. Fielding, L. Nicholson, A. Wakefield and Z. Varga for field assistance, J. Jarvis for help with equipment and data analysis, J. Reynolds and S. Richardson for productive discussions and access to SPOT imagery, M. Kirkbride and H. Conway for careful reviews, A. Sakai for additional comments and 1995 photographs of the glacier, and R. Aryal and other staff at the Department of Hydrology and Meteorology, Kathmandu, for helpful advice and permission to work in Nepal.



