Introduction
Electron back-scatter diffraction (EBSD) is the principal method used to measure the orientation and spatial distribution of the minerals from which a rock is constructed (see Prior et al., Reference Prior, Mariani, Wheeler, Schwartz, Kumar, Adams and Field2009 for a review). This technique has provided great insight into the kinematics of rock deformation (e.g. Trimby et al., Reference Trimby, Prior and Wheeler1998; Bestmann and Prior, Reference Bestmann and Prior2003), metamorphic processes (e.g. Spiess et al., Reference Spiess, Bertolo, Borghi and Centi2001, Reference Spiess, Groppo and Compagnoni2007, Reference Spiess, Dibona, Rybacki, Wirth and Dresen2012; Storey and Prior, Reference Storey and Prior2005; Díaz Aspiroz et al., Reference Díaz Aspiroz, Lloyd and Fernández2007), planetary geology (He et al., Reference He, Godet, Jacques and Jonas2006) and geochronology (e.g. Reddy et al., Reference Reddy, Timms, Pantleon and Trimby2007; Piazolo et al., Reference Piazolo, Austrheim and Whitehouse2012; Timms et al., Reference Timms, Reddy, Fitz Gerald, Green and Muhling2012, Reference Timms, Erickson, Pearce, Cavosie, Schmieder, Tohver, Reddy, Zanetti, Nemchin and Wittmann2017). EBSD can only be conducted on the surface of a polished sample, and under the vacuum conditions of an electron microscope. It is possible to extend this technique into 3D by coupling with focussed ion beam (FIB) serial sectioning (e.g. Calcagnotto et al., Reference Calcagnotto, Ponge, Demir and Raabe2010), yet the production of these data is extremely slow and not practical for most applications. Furthermore, as it is destructive, this 3D technique does not allow for samples to be subjected to experimental stress, temperature or deformation which would allow for the direct investigation of geological processes in situ within the microscope.
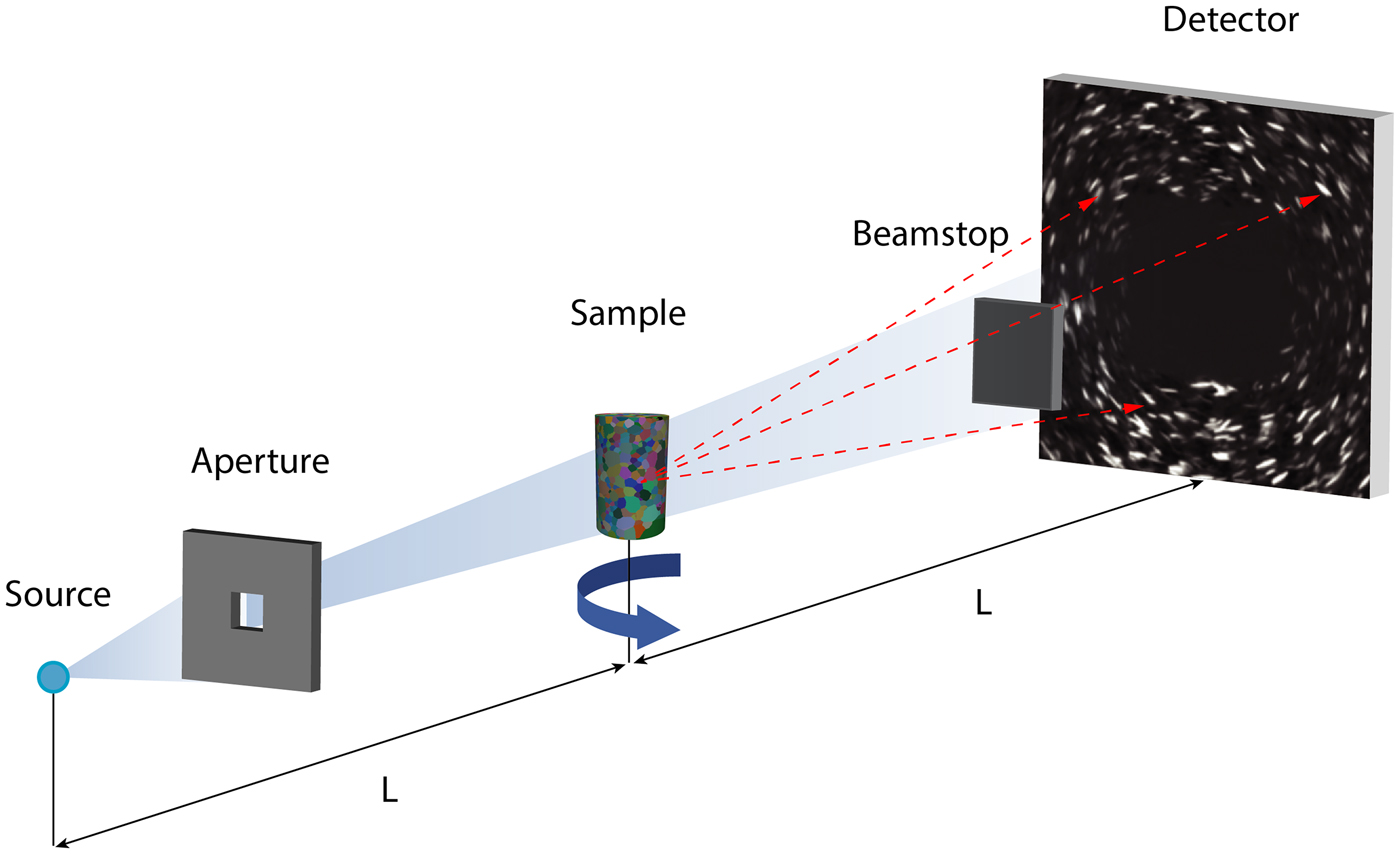
Mapping crystallographic orientations of a polycrystalline sample non-destructively has mainly grown from within material science (Poulsen et al., Reference Poulsen, Nielsen, Lauridsen, Schmidt, Suter, Lienert, Margulies, Lorentzen and Juul Jensen2001; Poulsen, Reference Poulsen2012) and is now a routine tool implemented in several synchrotrons, like at the ESRF (referred to as “Diffraction Contrast Tomography”, Ludwig et al., Reference Ludwig, Reischig, King, Herbig, Lauridsen, Johnson, Marrow and Buffière2009), APS and CHESS (referred to as “High Energy X-ray Diffraction Microscopy”, Lienert et al., Reference Lienert, Li, Hefferan, Lind, Suter, Bernier, Barton, Brandes, Mills, Miller, Jakobsen and Pantleon2011). This type of technology has only recently been available using laboratory X-ray sources (the reader interested in the physics are directed to McDonald et al., Reference McDonald, Reischig, Holzner, Lauridsen, Withers, Merkle and Feser2015; and Holzner et al., Reference Holzner, Lavery, Bale, Merkle, McDonald, Withers, Zhang, Jensen, Kimura, Lyckegaard, Reischig and Lauridsen2016), see also Fig. 1. In the first instance, application of LabDCT was limited to the analysis of the grain centre of mass location and orientation of cubic materials (metals; see McDonald et al., Reference McDonald, Reischig, Holzner, Lauridsen, Withers, Merkle and Feser2015).
Schematic of the experimental setup of LabDCT in the laboratory X-ray microscope (from Niverty et al., Reference Niverty, Sun, Williams, Bachmann, Gueninchault, Lauridsen and Chawla2019; Oddershede et al., Reference Oddershede, Sun, Gueninchault, Bachmann, Bale, Holzner and Lauridsen2019). The location and intensity of diffracted X-rays are recorded as the sample is rotated through 360°. A polychromatic X-ray beam illuminates a region of interest using an aperture between source and sample (distance of L). Transmitted X-rays are not collected due to the placement of a beamstop between sample and detector (distance also L). The transmitted X-rays are substantially stronger and would otherwise flood the detector when using the settings needed to achieve adequate signal:noise for the diffracted X-rays. Diffraction images are focussed by applying Laue geometry and appear as line-shaped spots.

To make LabDCT possible using such low brilliance polychromatic sources, and to optimise the signal:noise of the images recorded by the detector, diffraction patterns are collected in a specific configuration called ‘Laue symmetry’ where the source-to-sample and the sample-to-detector distances are identical (see Oddershede et al., Reference Oddershede, Sun, Gueninchault, Bachmann, Bale, Holzner and Lauridsen2019 for an introduction). A tungsten aperture is inserted between the source and the sample to ensure that the volume of interest is solely illuminated, as well as a square tungsten beamstop in front of the detector to prevent direct beam exposure of the scintillator (Fig. 1).
LabDCT is a fast-developing technique: now the full shape of the grains can be reconstructed from high-fidelity diffraction signals (Bachmann et al., Reference Bachmann, Bale, Gueninchault, Holzner and Lauridsen2019) rather than tessellation (McDonald et al., Reference McDonald, Holzner, Lauridsen, Reischig, Merkle and Withers2017), which provides improvements to 5D analysis of the grain boundaries network (see Shahani et al., Reference Shahani, Bale, Gueninchault, Merkle and Lauridsen2017; Oddershede et al., Reference Oddershede, Sun, Gueninchault, Bachmann, Bale, Holzner and Lauridsen2019; Sun et al., Reference Sun, Zhang, Lyckegaard, Bachmann, Lauridsen and Juul Jensen2019). The full-grain approach in theory extends the application to any kind of crystalline material (c.f. tessellation which is otherwise restricted due to the lower crystallographic symmetry of a non-cubic material), and with the benefit of multi-modal 3D imaging (see Keinan et al., Reference Keinan, Bale, Gueninchault, Lauridsen and Shahani2018 and references therein) and improvements to grain mapping reliability (Niverty et al., Reference Niverty, Sun, Williams, Bachmann, Gueninchault, Lauridsen and Chawla2019), supports attempts to conduct LabDCT analysis of more complicated materials, like rocks.
Olivine, which is orthorhombic, dominates the upper mantle by volume, is a prevalent mineral involved in the petrogenesis of basaltic liquids (e.g. Holtzman et al., Reference Holtzman, Kohlstedt, Zimmerman, Heidelbach, Hiraga and Hustoft2003), crystallises and fractionates in olivine saturated magmas (Pankhurst et al., Reference Pankhurst, Morgan, Thordarson and Loughlin2018a), and is common in some meteorite classes (Rudraswami et al., Reference Rudraswami, Prasad, Jones and Nagashima2016). Olivine is also used as a reactant in some industrial processes (Kemppainen et al., Reference Kemppainen, Mattila, Heikkinen, Paananen and Fabritius2012), and is a common slag mineral (Piatak et al., Reference Piatak, Parsons and Seal2015). The crystallographic orientation of olivine in natural rocks provides insights to mantle flow and physical anisotropies (Mizukami et al., Reference Mizukami, Wallis and Yamamoto2004; Tasaka et al., Reference Tasaka, Michibayashi and Mainprice2008; Demouchy et al., Reference Demouchy, Tommasi, Barou, Mainprice and Cordier2012; Hansen et al., Reference Hansen, Zimmerman, Dillman and Kohlstedt2012; Michibayashi et al., Reference Michibayashi, Mainprice, Fujii, Uehara, Shinkai, Kondo, Ohara, Ishii, Fryer, Bloomer, Ishiwatari, Hawkins and Ji2016), is essential for accurate derivation of 3D olivine element diffusion chronometry (Dohmen et al., Reference Dohmen, Becker and Chakraborty2007; Shea et al., Reference Shea, Costa, Krimer and Hammer2015a,Reference Shea, Lynn and Garciab), and provides information as to closed-system kinetics in condensing planetary discs and the formation of rocky bodies (Miyamoto et al., Reference Miyamoto, Mikouchi and Jones2009).
Measuring the size, shape, composition and crystallographic orientation of olivine to address research questions normally requires destructive sample preparation (thin section or grain mount) and 2D analysis. The inherent advantages of LabDCT include volume analysis, which bypasses the need to extrapolate 2D crystallographic data into 3D for use in structural interpretation. This also allows for per-voxel linking to 3D chemical information using calibrated X-ray tomographic attenuation images (Pankhurst et al., Reference Pankhurst, Vo, Butcher, Long, Wang, Nonni, Harvey, Guðfinnsson, Fowler, Atwood, Walshaw and Lee2018b); and potentially, to build such datasets faster than would otherwise be feasible with 2D analysis that requires intensive sample preparation and raster-type scanning (Pankhurst et al., Reference Pankhurst, Dobson, Morgan, Loughlin, Thordarson, Courtios and Lee2014). Our primary aim here is to determine whether LabDCT can measure the crystallographic orientation of olivine and gauge the likely uncertainty upon such measurements.
Methods
Experiment design
Numerous fragments of olivine of the same composition were scanned using LabDCT together with glass microbeads set into a resin straw. Setting a limited number of particles into resin held the experiment still and provided the highest possibility of clean diffraction projection images in this first experiment. It also aided us to make clear comparisons between particles as either olivine grains, and that of glass (which by definition should not produce diffraction spots), as we can use the shape of the particle to independently assign the material type.
Sample preparation
Approximately 1 mm wide, 5 mm deep holes were drilled into the walls of a silicon mount under a binocular microscope. The sides of the holes are rough. A single crystal of olivine from San Carlos (characterised previously by Pankhurst et al., Reference Pankhurst, Walshaw and Morgan2017) was manually crushed using a pestle and mortar, and shards ~50 to 300 µm long were dropped into these holes using tweezers. Glass microbeads (SLGMS-2.5: 45–53 µm, supplied by Cospheric; www.cospheric.com) were also introduced.
Two-part epoxy resin Epothin 2 (Beuhler; www.buehler.com) was dripped onto the opening of the holes, but did not penetrate due to surface tension. The mount was placed into a vacuum, and then pressure vessel, which was observed to help draw the resin down into the holes. After curing, the silicon mount was manipulated such that the resin poked out from the opening of the holes, which allowed recovery by tweezers. Visual inspection shows that the particles are distributed around the edges of a resin straw, apparently the particles caught by, and resin wicked onto, the rough walls of the bespoke mould.
Sample measurements
At Carl Zeiss X-ray Microscopy (4385 Hopyard Road, Pleasanton, CA, USA) a LabDCT dataset consisting of two tomographic scans was acquired sequentially on a Zeiss Xradia 520 Versa X-ray microscope equipped with the LabDCT module (Laue focussing geometry) without disturbing the sample. First, a classic absorption computed tomography (ACT) scan consisting of 2401 projections was collected with no beamstop or aperture, around 360° using a rotation stage. For each image, the exposure time was set to 1 s with no binning. The working distances were both 13 mm, leading to a pixel size of 1.69 µm. The source was set at 160 kV and 10 W, and the resulting tomographic volume was reconstructed using a filtered back projection algorithm. For the LabDCT scan, 181 diffraction contrast patterns (DCP) around 360° were collected (every 2° of rotation), with an exposure time of 600 s per projection for a total scan time of 30.17 hr. A 750 µm × 750 µm aperture and a 2.5 mm × 2.5 mm beamstop were used, set in place automatically and without opening the X-ray instrument (see Fig. 1).
Data reconstruction and reduction
We reconstructed the absorption data first to confirm that olivine and microbead particles are easily distinguishable by shape. Diffraction data were then reconstructed at a spatial resolution of 2.5 µm and indexed using orthorhombic crystal symmetry, along with a calculation of a confidence value, per-voxel, using the GrainMapper3D® software developed by Xnovo Technology ApS. For a full description of the GrainMapper3D method used here, we direct the reader to Bachmann et al. (Reference Bachmann, Bale, Gueninchault, Holzner and Lauridsen2019).
King et al. (Reference King, Reischig, Adrien and Ludwig2013) showed how using a projection geometry (with sample close to the source but far from the detector), it is possible to non-destructively reconstruct a grain map with a laboratory-based system. In that work, the algorithm relies on the identification of the precession path of the diffraction spots, identifying a maximum of energy to determine the geometry of the diffraction event and, thereafter, determine the orientation of the grain fulfilling the Bragg's condition. This information is later used to reconstruct the grain map using oblique back projection from a SIRT algorithm.
The GrainMapper3D® software (Bachmann et al., Reference Bachmann, Bale, Gueninchault, Holzner and Lauridsen2019) used for the current experiment relies on a different method. Here, the sample is placed in ‘Laue-focusing’ geometry, where the source-to-sample and sample-to-detector distances are equal. Consequently, the diffraction spots appear as lines on the detector, which reduce the probability of spot overlaps and require less acquisition time. Once the diffraction dataset is acquired, the spots are then binarised and the algorithm will consider a simplified diffraction model which attempts to optimise a metric called ‘completeness’ locally. The algorithm generates a list of possible grain candidates from the diffraction data, with the a priori knowledge of the diffraction geometry, and probe defined locations within the sample's volume while checking for the best grain candidate through a heuristic approach.
The quality of indexing has a natural upper limit due to the potential for diffracted X-rays to be absorbed, or spots to overlap etc. In practice, the completeness value must be >40% for the solution to be considered, and trusted at 85% using GrainMapper3D®, which corresponds to an uncertainty within the 95% confidence interval, (see corroboration with EBSD data in Niverty et al., Reference Niverty, Sun, Williams, Bachmann, Gueninchault, Lauridsen and Chawla2019). We used a trust completeness value of 85% in this study. The data were then reduced by labelling neighbouring voxels of <0.1° misorientation together as distinct regions (i.e. misorientation of >0.1° between two neighbouring voxels places each into different labelled regions), and the results from each region displayed as the average value according to two visualisation schemes: IPF (inverse pole figure) and hkl (Miller indices).
Results and discussion
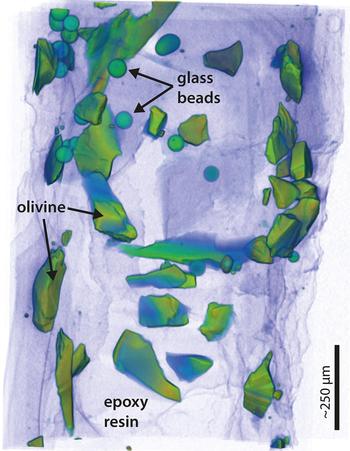
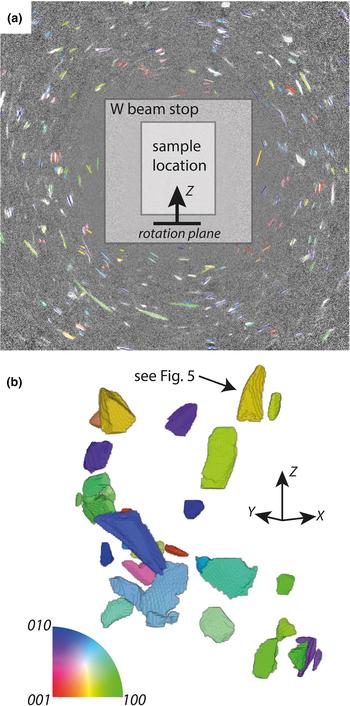
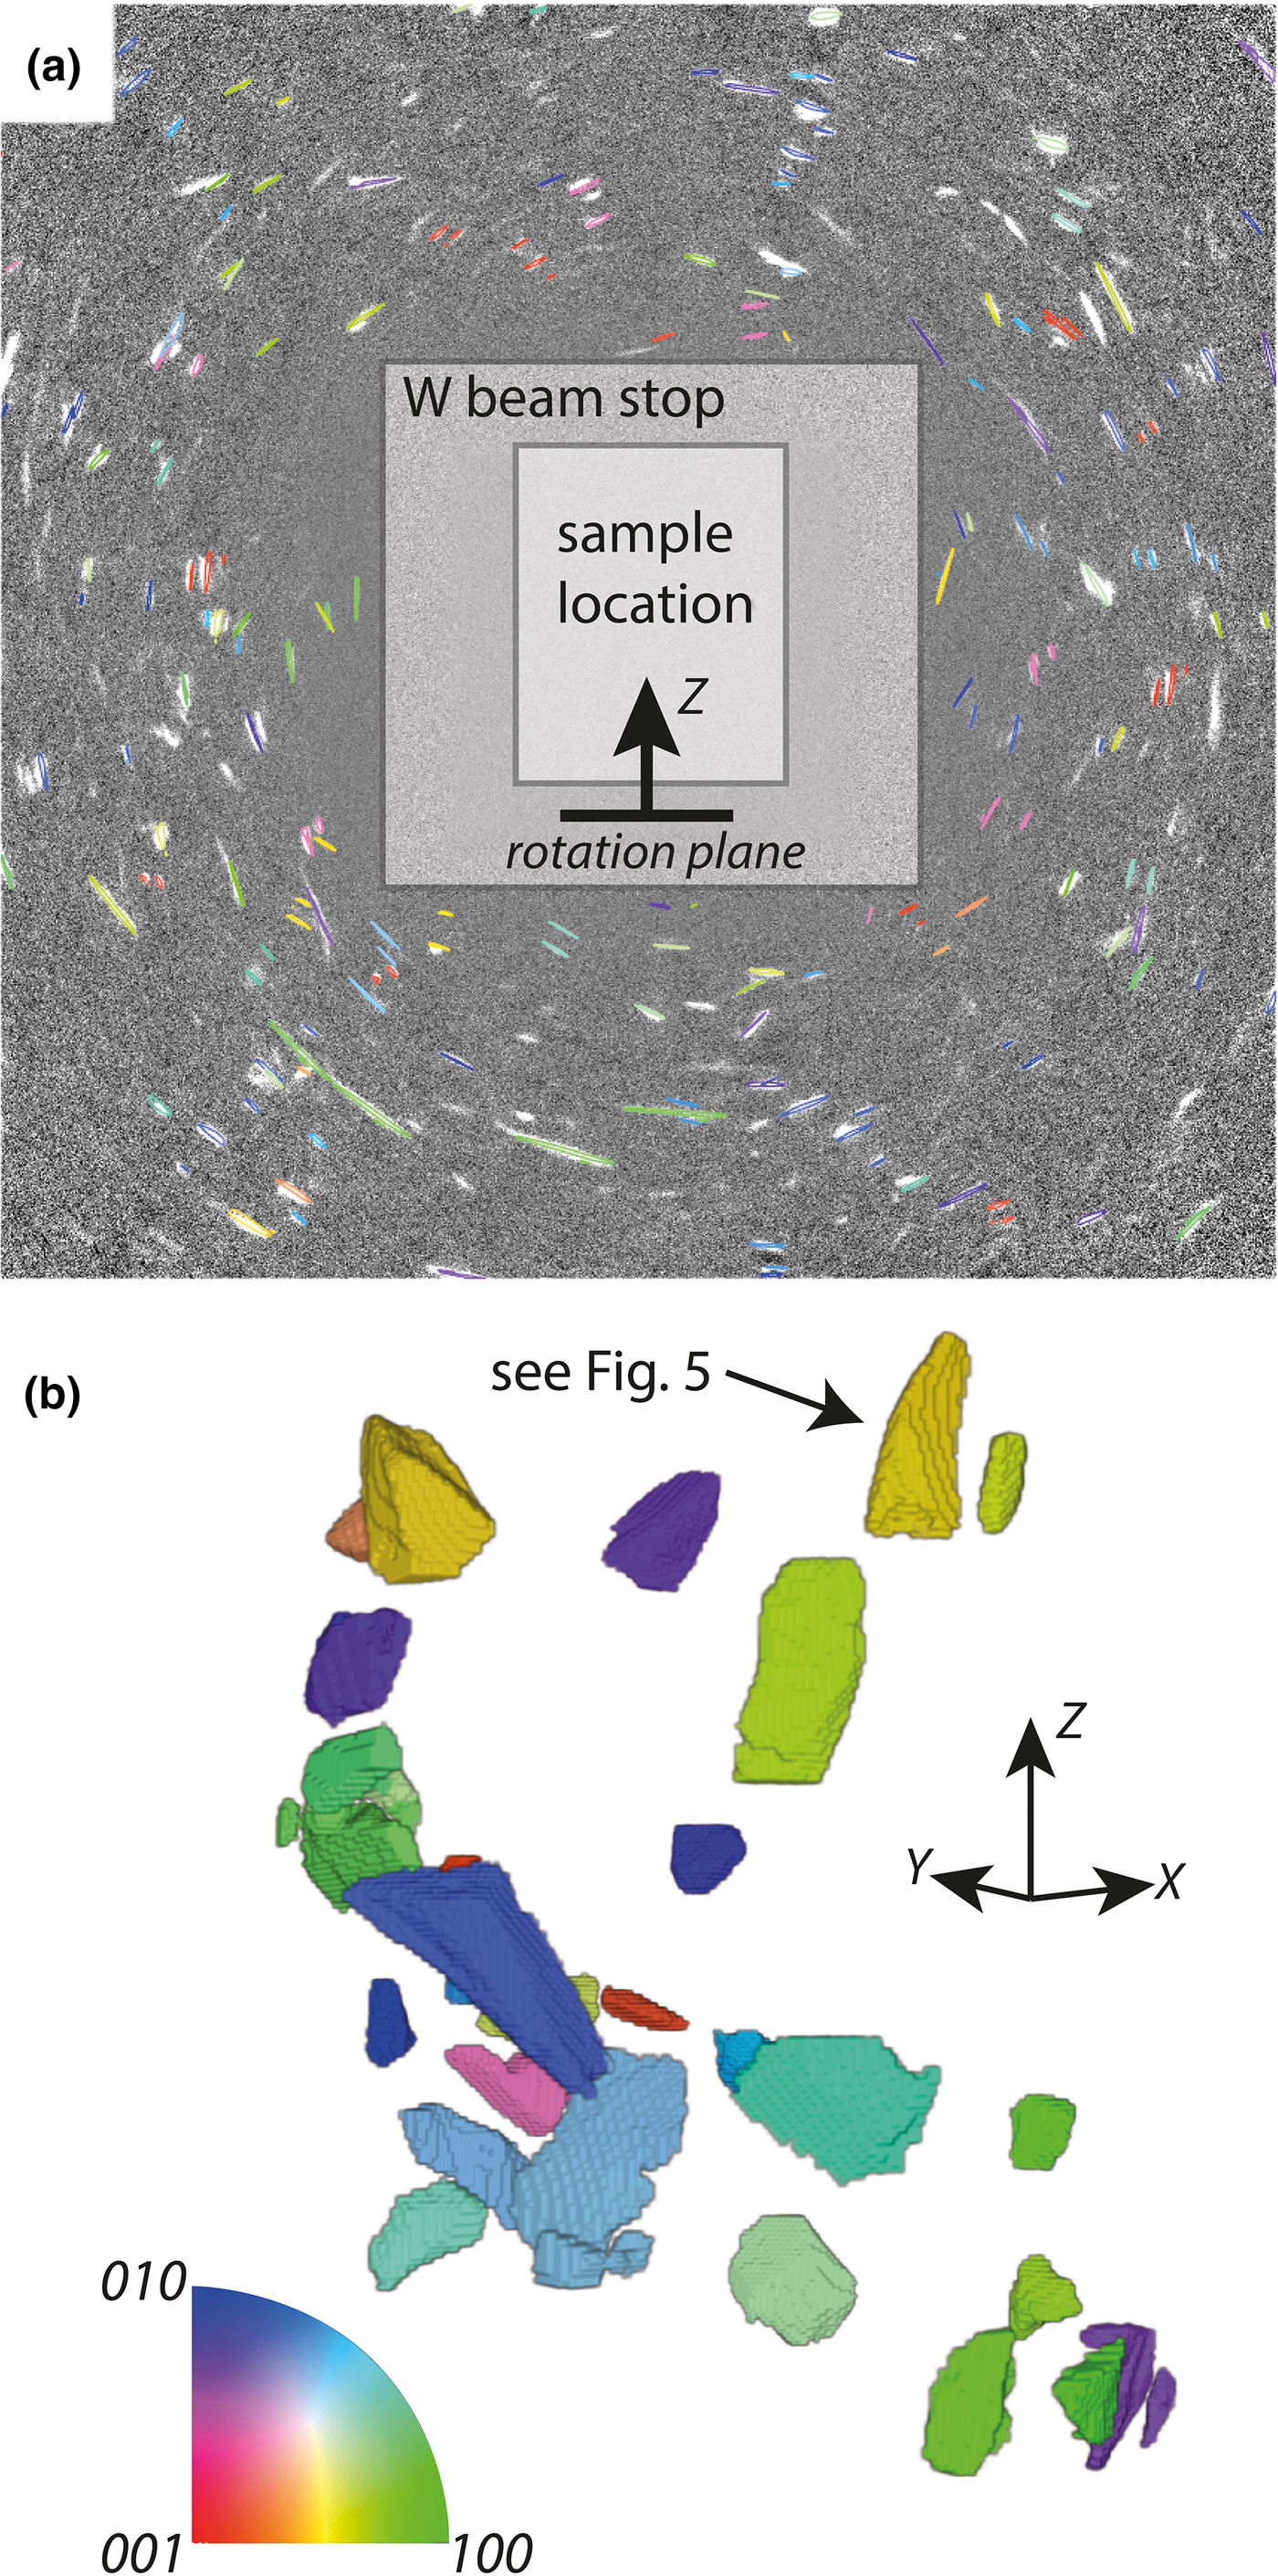
The conventional absorption data are summarised in Fig. 2 which illustrates the random distribution of particles set into place by the resin. A single projection of the raw diffraction data is shown in Fig. 3a, overlain with the results of a forward model (discussed below). The corresponding reconstructed LabDCT image is presented in Fig. 3b; diffraction spots in Fig. 3a correspond to the same coloured fragment in Fig. 3b.
Tomographic X-ray absorption image of the sample used in the DCT experiment. The view is of the sample as presented to the beam. A qualitative measure of density is illustrated by using a semi-transparent colour-drape over a volume render. Purple is low density, and green–orange is higher density. The edges of the particles are defined clearly against the cured resin, from which their shapes are observed and the particle type identified.

Example diffraction projection and reconstructed crystallographic orientation tomogram: (a) a beamstop (tungsten shield) blocks X-rays from the principle beam (located at the viewer's perspective here) from reaching the square detector, upon which diffraction spots originating from crystals within the sample (in front of the beamstop) form, and are captured at each sample rotation angle. The intensity, size and shape of the spots are a function of the size and shape and orientation of the particle. The angles between spots, and their shift with sample rotation, contain crystal system and location information; (b) the reconstructed volume is labelled according to IPF notation and corresponding inset colourmap. Data are plotted relative to the Z axis, which is the rotation axis. For instance, the 100 axis of dark green crystals are aligned with the Z axis of the sample.
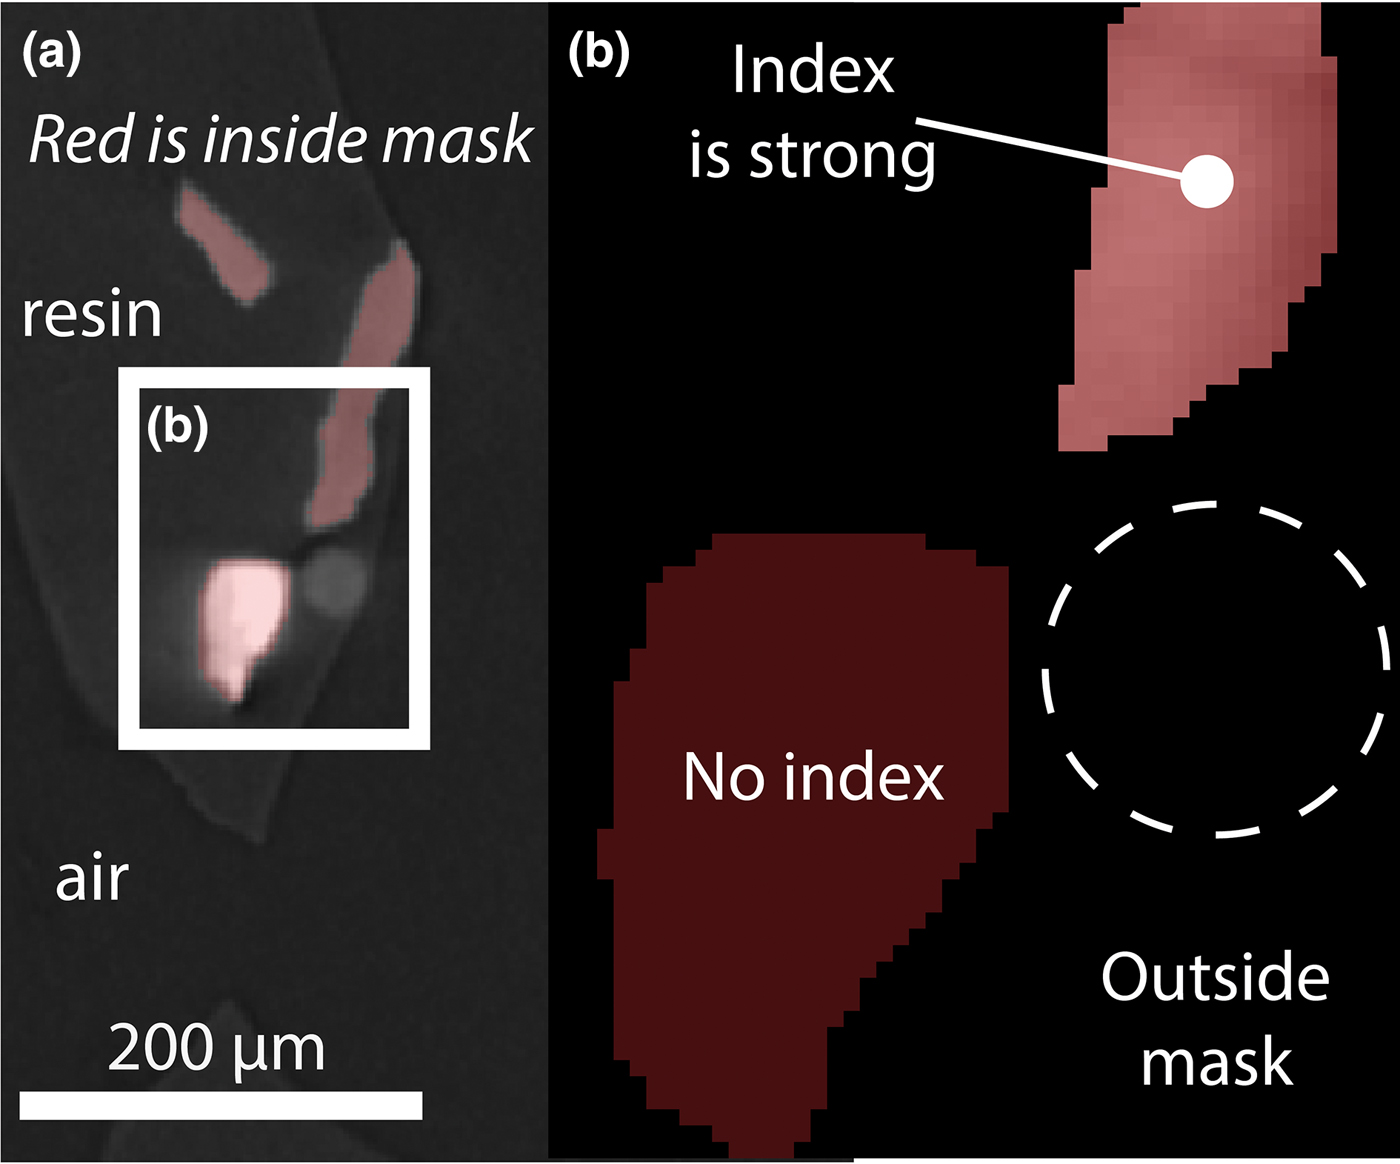
LabDCT resolves the olivine fragments (shards, generally with concoidal fracture) using the orthorhombic system. These indexed areas match the location, size and shape of olivine fragments in the attenuation image. Glass microbeads, resin, nor indeed air, do not produce diffraction spots (Fig. 4).
Crystallographic orientation index quality per material. (a) Orthoslice from 3D absorption image overlain with mask defining voxels to attempt indexation. Four particles, resin and air are represented in this view. Three of those particles are resolved from the diffraction data, which indicate they are crystalline. (b) Larger view of inset in a: The bright (dense) material in (a) is unable to be indexed using an orthorhombic system, whereas the moderately dense particles are indexed with high confidence. Dashed circle approximates the location of the glass microbead.
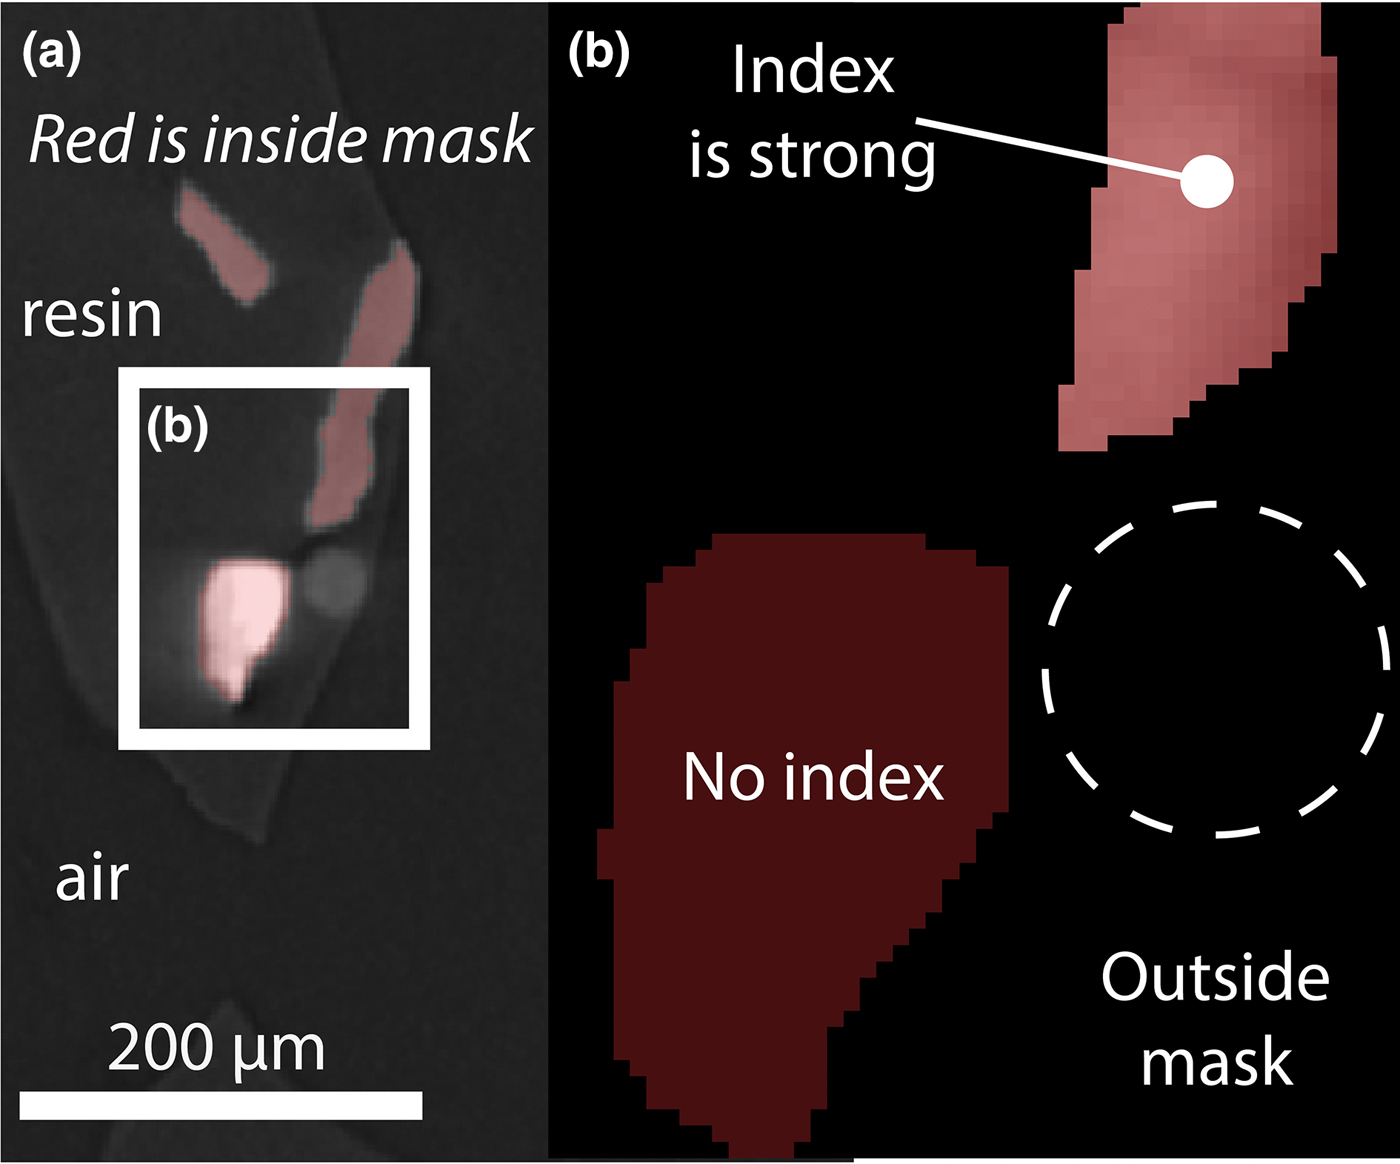
A surprise result was the (poor) indexing in the orthorhombic system of an anomalously bright region of the attenuation image (Fig. 4). This particle is crystalline, yet is too dense to be the San Carlos olivine. It is not attached to any other particle and does not index as spinel, which is a common dense mineral inclusion in olivine. As its origin is likely to be contamination further speculation as to its nature is unwarranted, yet it does offer a useful true negative result when compared to the olivine true positive results. It signals that crystalline phases may be distinguishable by LabDCT on the basis of the strength of their indexing according to any one system.
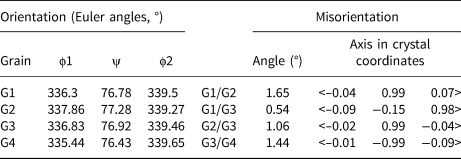
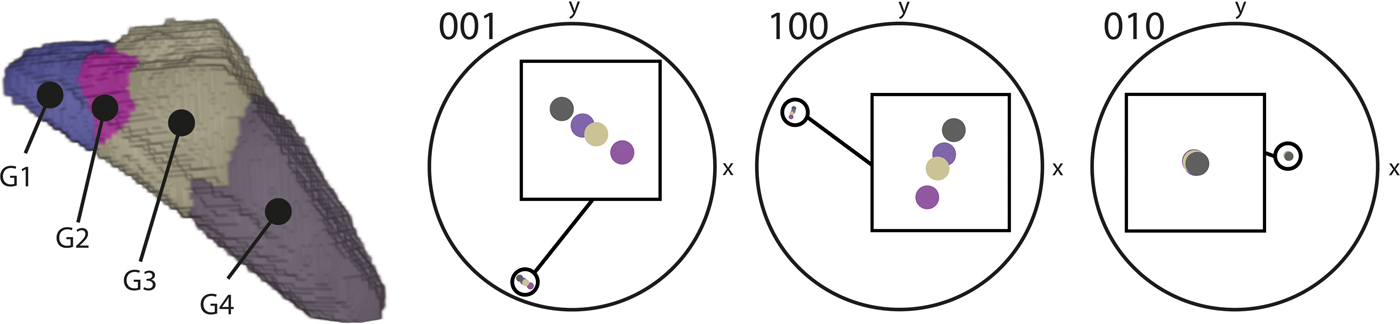
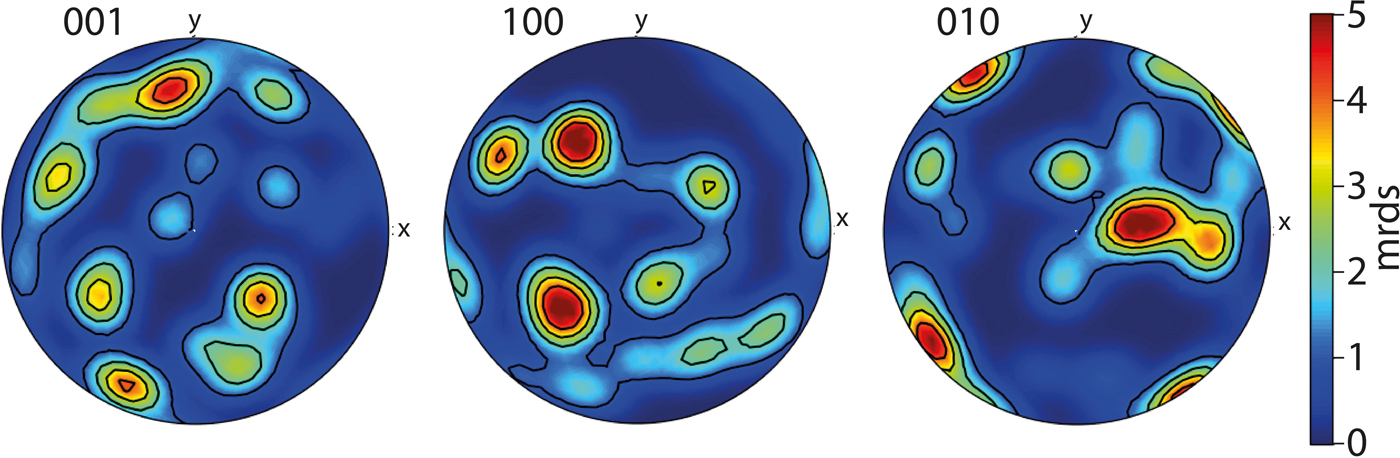
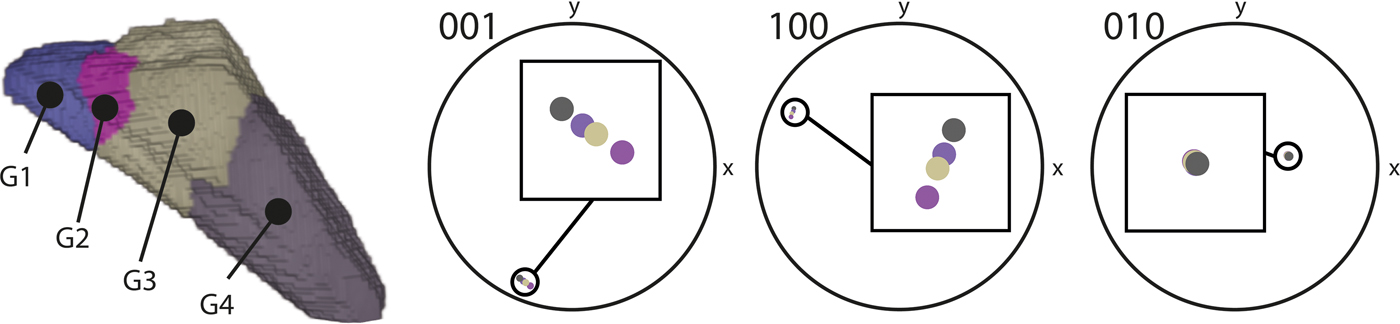
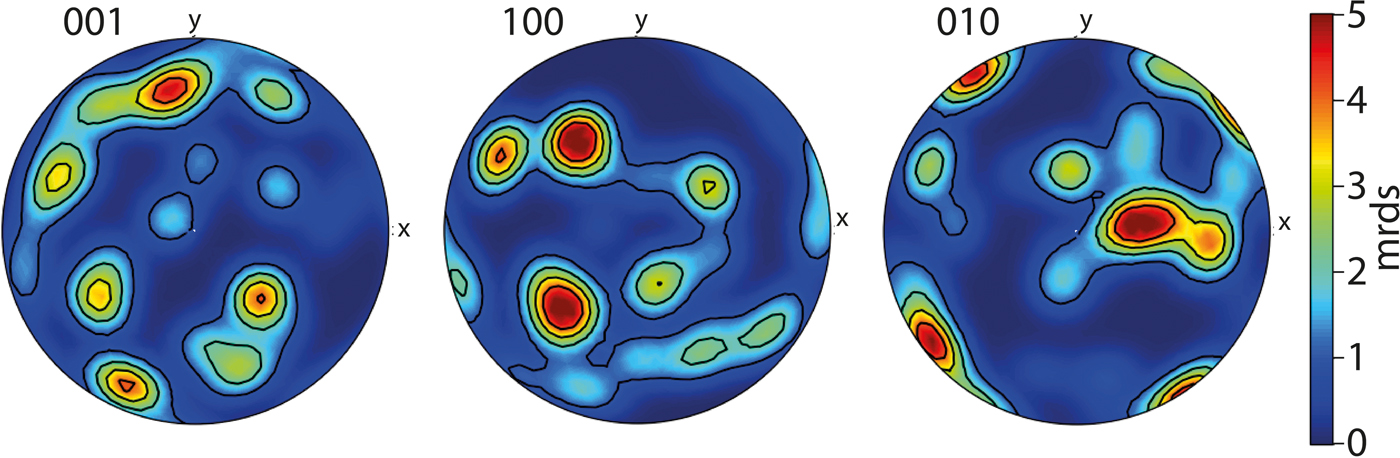
We observe clusters of spots on the raw diffraction data which correspond to distinct volumes within the sample that are proximal to each other, yet display distinct crystallographic orientation. This result brings the potential of this technique sharply into focus, as these observations originate from sub-grains within individual fragments, and so demonstrate that subtle variation is detectable (Fig. 5, Table 1). To illustrate the nature of the sub-grain boundaries we visualised the olivine data as pole figures (Fig. 6). In this experiment comprised of randomly located, randomly orientated particles, the distinct clusters of orientation data in Fig. 6 can be traced to single grains of olivine and the spread within a cluster indicates the divergence of sub-grain orientation. We consider that interpretation beyond these observations is better directed at samples that have not been crushed. Imaging and analysis of such unmodified samples is the subject of current work.
Crystallographic measurements from a single fragment of olivine composed of four subgrains shown in Fig. 4: (a) orientation data; (b) misorientation calculations between subgrains.

Detection and quantification of olivine sub-grains in three dimensions. An hkl scheme applied to the diffraction data reveals distinct domains of crystallographic orientation. Each domain is composed of hundreds of voxels that are under a threshold of 0.1° of (total) misorientation from each other.
Pole figures of the olivine data. The spread in all crystallographic orientations demonstrates the random orientation of olivine fragments. Clustering illustrates the contribution of numerous sub-grains with small, yet detectable misorientations.
Future potential and challenges
The present study describes the first instance of non-destructive crystallographic orientation analysis of a material with a non-metallic, non-cubic system using LabDCT. An exhaustive comparison against other crystallographic orientation measurement techniques is beyond the scope of this contribution, and will require data from natural samples to be gathered from a range of such techniques to best articulate the advantages and limitations to geoscience. Below is an outline of how this technique could grow, and where barriers to that growth could originate. First we return to a brief comparison between EBSD and LabDCT.
LabDCT is anticipated to become a highly complementary technique to that of EBSD. Here we demonstrate olivine is able to be analysed in 3D and non-destructively, yet there is much development work to be conducted before different crystal systems can be analysed by LabDCT with confidence, which would then allow for a variety of rocks to be examined, as they are routinely using EBSD. Furthermore, the highest spatial resolution possible using EBSD is currently greater than that demonstrated by LabDCT studies, and the width and length of a single map possible by EBSD is over an order of magnitude larger than state of the art LabDCT. Importantly, LabDCT as compared to EBSD analysis of the same sample finds good agreement in both location and shape of crystallographic domains and orientation accuracy (Niverty et al., Reference Niverty, Sun, Williams, Bachmann, Gueninchault, Lauridsen and Chawla2019). LabDCT has higher angular resolution than EBSD due to the gathering of diffraction data as tracks over large angles whose solution, found during reconstruction, converges at a higher resolution than that of an individual projection. Consistency between grains studied by McDonald et al. (Reference McDonald, Holzner, Lauridsen, Reischig, Merkle and Withers2017) suggest a measurement accuracy of <0.05°, which is shown experimentally by Bachmann (Reference Bachmann, Bale, Gueninchault, Holzner and Lauridsen2019). Compare this data gathering geometry to diffraction patterns that are 2D images, where angular resolution is linked to the width of the Kikuchi bands and by extension, the depth of focus. EBSD angular resolution is on the order of tenths of degrees (McDonald et al., Reference McDonald, Holzner, Lauridsen, Reischig, Merkle and Withers2017).
Optimisation
This study's experiment was conducted using typical scan settings used to measure the orientation of grains within metals (Niverty et al., Reference Niverty, Sun, Williams, Bachmann, Gueninchault, Lauridsen and Chawla2019). The only difference to note was that the exposure was set to 600 s per projection rather than the 500 s used by Niverty et al. (Reference Niverty, Sun, Williams, Bachmann, Gueninchault, Lauridsen and Chawla2019) in an attempt to maximise the intensity of the olivine diffraction spots. The quality of these first results in terms of the ability to domain voxels with the same orientation are comparable to state-of-the-art EBSD datasets with acceptable mean angular deviation values (Maitland and Sitzman, Reference Maitland and Sitzman2007) – see Niverty et al. (Reference Niverty, Sun, Williams, Bachmann, Gueninchault, Lauridsen and Chawla2019) who conducted a 1:1 comparison between LabDCT and EBSD data.
For the LabDCT method to gather enough information for complete indexing, weak as well as strong reflections are required to be resolved. As geological crystals are frequently low symmetry, strained and/or twinned at various scales, the typical diffraction spots in future work are anticipated to be weaker, noisier, and more artefact-prone than those generated from metallic samples. The diffraction of the material therefore serves as a limitation to indexation with high confidence. One simple way to optimise what is essentially a segmentation challenge is to increase exposure time to improve the signal-to-noise for weakly scattering crystals, yet other options are becoming available.
Recent benchmarking results from the application of modern data science and machine learning techniques shows significant benefits to the identification of individual diffraction spots from a noisy and artefact prone diffraction pattern (e.g. Andrew, Reference Andrew2018; Berg et al., Reference Berg, Saxena, Shaik and Pradhan2018). Such techniques may prove especially valuable when trying to extend diffraction contrast to more complex mineralogical or crystallographic systems (e.g. Darling et al., Reference Darling, Moser, Barker, Tait, Chamberlain, Schmitt and Hyde2016).
Materials
The crystallography of minerals in solid solutions, like olivine and others including the feldspar group, is effected by their composition (e.g. Deer et al., Reference Deer, Howie and Zussman1992). Further work is required to determine how chemical variation across a solid solution might effect LabDCT results, to what degree this may be a source of uncertainty (for instance, if the sample is known to contain olivine, but the composition is not known the input lattice parameters must only be an approximation). It is worth nothing that by resolving subgrains within a single particle, the technique can resolve boundaries where distinct grains are touching, as they are frequently observed to be in natural samples. It is also worth noting that crystallographic orientation imparts measurable variations in signal intensity during electron beam analysis whereby a ‘volume’ of excitation produces yield (e.g. as secondary or back-scattered electrons or X-rays). Using LabDCT to map the surface and ‘subsurface’ of grain mounts or thin sections may have value in increasing the accuracy of compositional measurement, in particular with respect to spatial characterisation of reference materials (e.g. Pankhurst et al., Reference Pankhurst, Walshaw and Morgan2017).
Strained crystals, such as many in nature (see Hunter et al., Reference Hunter, Weinberg, Wilson, Luzin and Misra2018 for a recent example) as well as those synthesised in laboratory experiments (e.g. Hansen et al., Reference Hansen, Zimmerman, Dillman and Kohlstedt2012), represent a limitation of, yet also an opportunity for, LabDCT as applied to geoscience. For instance, departure from an idealised crystallographic structure reduces the capacity for software to index the data. This necessarily effects accuracy and precision of the measurement, yet also may indicate the presence of elastic or plastic strain. The assumption of one orientation per grain is difficult to apply, as generally the diffraction spots lose their shape and start to streak. Mapping this reduction in indexation, or change in spot shape/size for a given material of the same phase and known or controlled shape (in 3D) may constitute a new way forward in understanding the development of strain. It is plausible that this technique may be developed for in situ use during live/interrupted deformation and/or heating experiments depending on experiment requirements (see McDonald et al., Reference McDonald, Holzner, Lauridsen, Reischig, Merkle and Withers2017 for an example). These would need to be designed with the scanning duration in mind, yet is still advantageous compared with the impossibility of using 2D, destructive techniques.
Conclusions and implications
This study demonstrates that the crystallographic orientation of olivine can be measured using DCT, which opens new avenues of research upon olivine and, by extension, other non-metallic crystalline materials. The inherent ability of LabDCT to distinguish crystalline from non-crystalline substances in 3D, and potential to use the quality of indexing to different crystallographic systems as a parameter for segmenting 3D image volumes, holds potential to be used to discriminate between phases in natural rocks and other materials. For those minerals that have orthorhombic structures, we show that each grains’ crystallographic orientation, and those of any sub-grains, can be determined precisely. We conclude that in addition to metals, LabDCT is applicable to a range of materials. Due to the inherently 3D and non-destructive nature of the technique, promising new directions for research and understanding of the formation and evolution of crystalline materials are now possible.