Introduction
The study of population aggregation processes has been an enduring focus for archaeological research on complex societies. Recent work has documented a remarkable diversity in the spatial and social organisation of large settlements, challenging scholars to re-think models of prehistoric population aggregation, settlement growth and urbanism (Szentmiklosi et al. Reference Szentmiklosi, Heeb, Heeb, Harding, Krause and Becker2011; Collis Reference Collis, Fernández-Götz, Wendling and Winger2014; Chapman & Gaydarska Reference Chapman, Gaydarska, Fernández-Götz and Krausse2016). These processes are often the result of complex trajectories, with both centripetal and centrifugal forces affecting the expansion and decline of large sites (Ur Reference Ur2010; Fernández-Götz Reference Fernández-Götz2017). The Caucasus is a useful region in which to explore the interplay of these forces, as tension between mobility and sedentism resulted in varying levels of population aggregation during the Bronze and Iron Ages (Smith Reference Smith2005; Lindsay & Greene Reference Lindsay and Greene2013). Moreover, the lack of correlation between increasing sedentism and markers of extreme social hierarchy provide a contrast to the neighbouring regions of the Fertile Crescent. While population aggregation and settlement growth were important topics in the Soviet-period archaeological scholarship on the South Caucasus (e.g. Berdzenishvili Reference Berdzenishvili1975), only recently have these processes begun to attract wider international attention. This lack of interest can be attributed to modern linguistic and political barriers, and perhaps also to the rather late appearance of sites that could be considered ‘urban’ in the traditional Near Eastern sense.
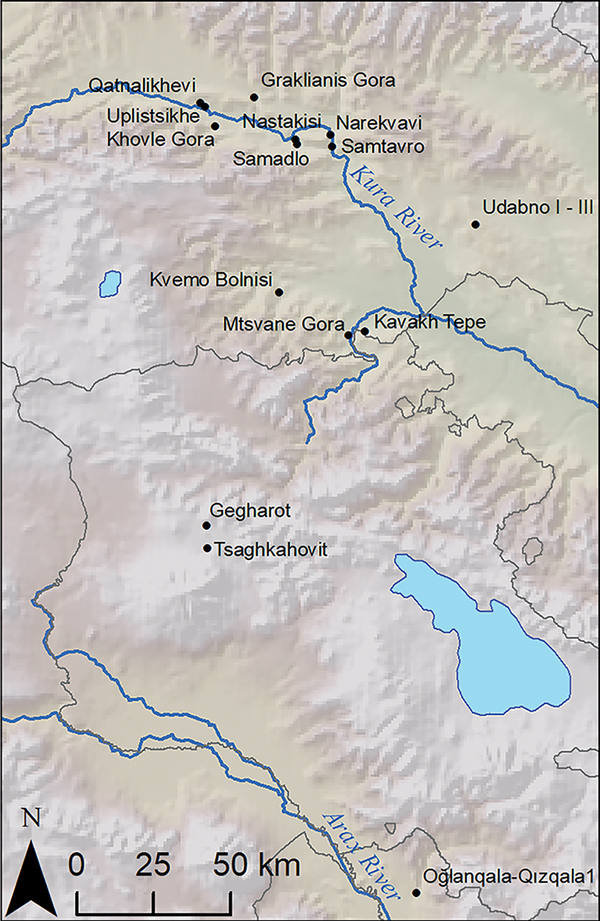
The appearance of fortified hilltop sites in parts of eastern Anatolia and the South Caucasus during the Late Bronze Age (c. 1500–1100 BC) corresponds to a period of significant social change (Figure 1). While the preceding Middle Bronze Age (c. 2400–1500 BC) is characterised by large and extravagant kurgan burials—some reaching 100m in diameter and 12m high (Makharadze & Murvanidze Reference Makharadze and Murvanidze2014)—contemporaneous settlement sites are largely lacking. The Middle Bronze Age has therefore been interpreted as an interval characterised by mobile lifeways between the Early and Late Bronze Ages, both of which feature large numbers of settlements (Smith Reference Smith2005: 261–64; Smith et al. Reference Smith, Badalyan and Avetisyan2009: 27–29).
Map of selected hilltop sites with Late Bronze and/or Iron Age occupation. DEM from GTOPO30.
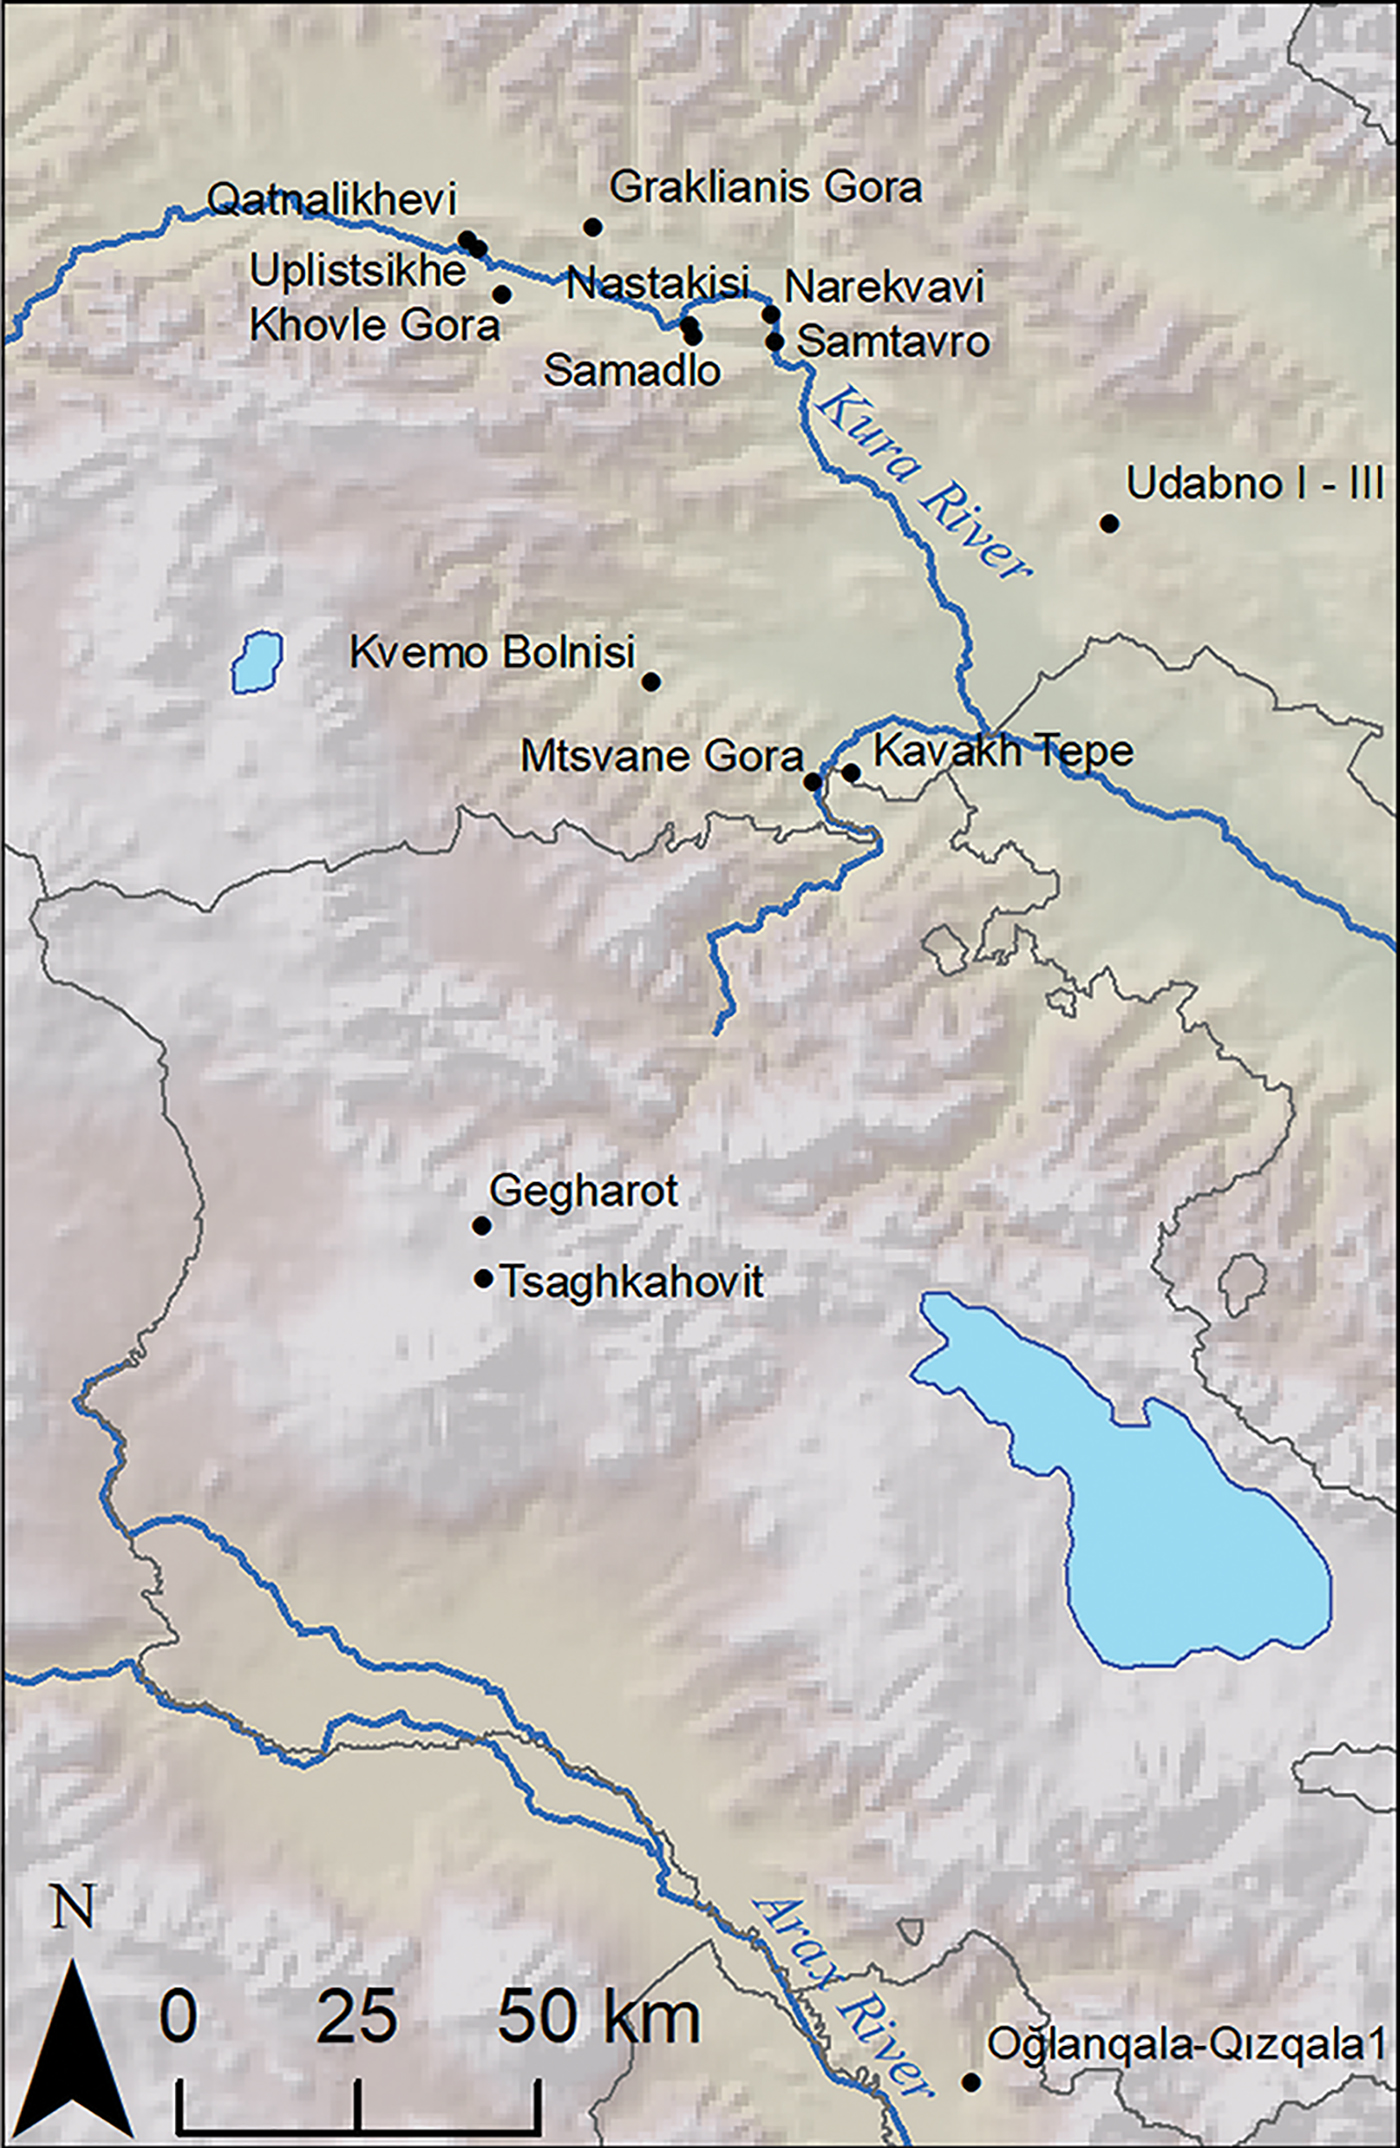
Late Bronze Age and Early Iron Age hilltop sites—often fortified—are found across much of eastern Georgia, Armenia, north-eastern Turkey and parts of Azerbaijan (Smith et al. Reference Smith, Badalyan and Avetisyan2009; Narimanishvili Reference Narimanishvili, Avetisyan and Bobokhyan2012; Hammer Reference Hammer2014; Yardimiciel et al. Reference Yardimiciel, Özdemir, Işıklı, Anderson, Hopper and Robinson2018). They vary in size and style of construction; some have massive walls of unworked ‘cyclopean’ dry stone masonry, while others have more modestly sized defensive structures built of smaller stones. While some notable work has been conducted on these types of site in both the Soviet and post-Soviet periods (e.g. Esayan Reference Esayan1976; Badalyan et al. Reference Badalyan, Smith and Khatchadourian2010; Narimanishvili Reference Narimanishvili, Avetisyan and Bobokhyan2012), much remains unclear concerning their social dynamics, spatial organisation and the circumstances of their emergence. Recent investigations in Armenia, Azerbaijan and the North Caucasus have provided valuable information about Late Bronze Age and Iron Age settlement patterns (e.g. Smith et al. Reference Smith, Badalyan and Avetisyan2009; Badalyan et al. Reference Badalyan, Smith and Khatchadourian2010; Lindsay et al. Reference Lindsay, Smith and Badalyan2010, Reference Lindsay, Leon, Smith and Wiktorowicz2014; Hammer Reference Hammer2014; Reinhold et al. Reference Reinhold, Belinskiy and Korobov2016). Further work is necessary to assess the variability and coherence of this fortress-building phenomenon. Systematic spatial approaches have not been applied to questions of Late Bronze to Early Iron Age settlement structure in the middle Kura Valley, with the occasional exception (e.g. Giese et al. Reference Giese, Grubert and Hübner2007). By applying a suite of complementary techniques, including unmanned aerial vehicle (UAV) imaging, magnetic gradiometry survey and systematic surface collection, we are able to produce a more robust understanding of settlement structure and explore its implications for models of Late Bronze to Early Iron Age settlement growth.
Many archaeologists view the emergence of fortresses as a result of the changing modes through which social hierarchy was expressed, with the rich assemblages within massive Middle Bronze Age kurgan graves giving way to somewhat more muted expression of hierarchy in the Late Bronze Age mortuary record (Smith Reference Smith2005: 266–68; Lindsay et al. Reference Lindsay, Smith and Badalyan2010: 16–17). Despite the rise of fortress settlements in the Late Bronze Age South Caucasus, research suggests that significant segments of the population remained mobile (Lindsay et al. Reference Lindsay, Smith and Badalyan2010; Lindsay & Greene Reference Lindsay and Greene2013). Although archaeologists have proposed a range of centripetal social forces (e.g. security, ritual activities) that would have drawn or compelled people to gather at these sites (Smith & Leon Reference Smith and Leon2014), many questions remain about the social dynamics that influenced the growth of fortresses.
The nature of settlement within areas below but associated with these hilltop fortresses is a key issue in these discussions. The fortress complex at Oğlanqala-Qizqala 1 in Azerbaijan, for example, has walls extending off the main hills, which may date back to the Iron Age. These walls enclose very large areas, although it is unclear how much of this lower enclosure was filled with structures (Hammer Reference Hammer2014). At Tsaghkahovit in Armenia, the extensive lower settlement dates primarily to the Iron III (Achaemenid) period (Badalyan et al. Reference Badalyan, Smith and Khatchadourian2010; Khatchadourian Reference Khatchadourian and Areshian2013). Although Late Bronze Age occupation in this lower area has also been documented, the structures appear less substantial and perhaps less permanent than those of the later settlement (Lindsay et al. Reference Lindsay, Smith and Badalyan2010, Reference Lindsay, Leon, Smith and Wiktorowicz2014).
The emergence and growth of Late Bronze Age fortress settlements has long been a subject of interest, although systematic archaeological survey and excavation has been limited. Berdzenishvili (Reference Berdzenishvili1975: 19) identified hilltop sites as representing a significant stage in his Marxist model of social development. Based on preliminary observations at Khovle Gora and Nastakisi, he linked the rise of larger settlements to the expansion of occupation around Late Bronze to Early Iron Age hilltop fortresses. Berdzenishvili's model relies partially on linguistic observations: the Georgian word for ‘town’, for example, is ‘daba’, which also means ‘low’ or ‘lower’ (daba, dabali). He thus proposed that early towns emerged as the lower settlements of hilltop fortresses (Berdzenishvili Reference Berdzenishvili1975: 23–61). As the antiquity of this term is unclear, linguistic support for an evolutionary linkage between fortresses and towns remains speculative, at best; this pairing may simply reflect synchronic spatial relations between fortresses and towns in later periods, rather than a diachronic developmental trajectory.
Later archaeological excavations at Khovle Gora in modern Georgia supported Berdzenishvili's hypothesis about the presence of an extramural settlement at the site (Muskhelishvili Reference Muskhelishvili1978). Evidence for Late Bronze to Early Iron Age settlement expansion from a central hill to smaller satellite hills has been suggested at other sites, such as Samtavro. At Narekvavi, the previously unoccupied central hill was later fortified and acted as the main defensive structure for the surrounding settlements (Sadradze Reference Sadradze2002: 173–203, 222–41). As the central fortified node postdates the surrounding settlement, the Narekvavi case may indicate variability in settlement aggregation processes. Lordkipanidze (Reference Lordkipanidze1989: 181–82) espouses a slightly different perspective, at least concerning the relationship between Late Bronze to Early Iron Age fortress settlements and the urban sites of the late first millennium BC. He argues for a period of widespread settlement destruction and abandonment in the late sixth to early fourth centuries BC (the continued settlement at Khovle Gora being an exception). Thus, the ‘urban explosion’ of the late fourth and third centuries BC, while often involving the reoccupation of Late Bronze to Early Iron Age sites, represents, in this perspective, a distinct development (Lordkipanidze Reference Lordkipanidze1989: 312–14). Although scholars have frequently discussed the growth and transformation of fortified settlements, these ideas require further investigation and testing through systematic survey and spatial analysis.
Survey methodologies
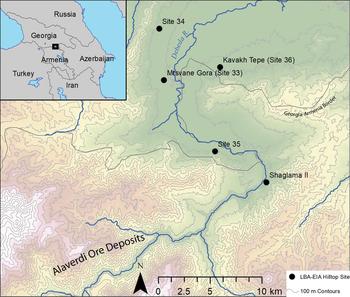
The Archaeological Research in Kvemo Kartli (ARKK) project was established to explore Late Bronze Age and Early Iron Age social and technological transformations in the South Caucasus. Initial pedestrian and remote-sensing survey of the region mapped a number of hilltop sites with Late Bronze Age and Early Iron Age pottery (Erb-Satullo Reference Erb-Satullo, Anderson, Hopper and Robinson2018). In the Debeda River valley (Figure 2), hilltop sites are situated at various points along the valley as it narrows and rises into the highlands. In 2016, two sites, Mtsvane Gora and Kavakh Tepe, were identified for comprehensive survey using multiple techniques. Kavakh Tepe was selected for its substantial surface architecture and possible lower settlement, while Mtsvane Gora was chosen due to the presence of surface metallurgical debris. Both hilltop sites exhibited a series of shallow depressions on the slopes and surrounding lower areas that were originally hypothesised to be evidence for possible extramural buildings. Three complementary types of survey technique were employed: UAV imaging and photogrammetry, surface mapping and systematic collection, and magnetic gradiometry.
Map of the Debeda River valley. DEM from ASTER (a production of METI and NASA).

Aerial imagery was collected using a GoPro Hero4 Black mounted on a 3D Robotics Solo Quadcopter. This was used to create orthoimages, a DEM and various DEM-derived products, including hillshades and slope and local relief models (LRMs). Extensive surface collection was carried out at Kavakh Tepe to map the extent of settlement and to date features mapped by other techniques. Ceramics were collected in contiguous 15m units in the areas selected for magnetometry survey, as well as in 30m grids scattered over the rest of the site. Surface collection at Mtsvane Gora—undertaken during preliminary survey in 2014—focused on the top and the slopes of the hill, with the goal of obtaining a broad sample of ceramics and metallurgical debris (Erb-Satullo Reference Erb-Satullo, Anderson, Hopper and Robinson2018).
Magnetic prospection was conducted with a Bartington 601 Magnetic Gradiometer. At Kavakh Tepe, magnetic prospection focused on areas where surface walls or concentrations of Late Bronze to Early Iron Age ceramics were visible. Due to the surface metallurgical remains at Mtsvane Gora, magnetometry here focused on areas where slag was recovered, in anticipation of locating metallurgical features such as furnaces, hearths or concentrated slag dumps. Further details about the survey methodologies can be found in the online supplementary material (OSM).
Results
Kavakh Tepe: surface mapping and UAV imaging
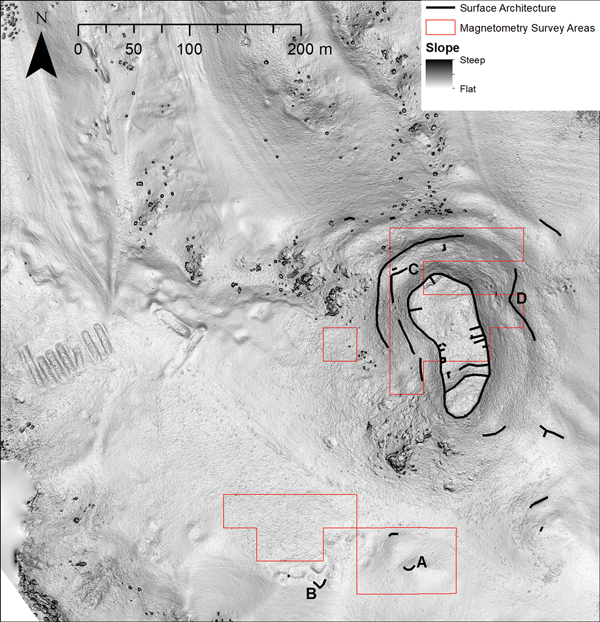
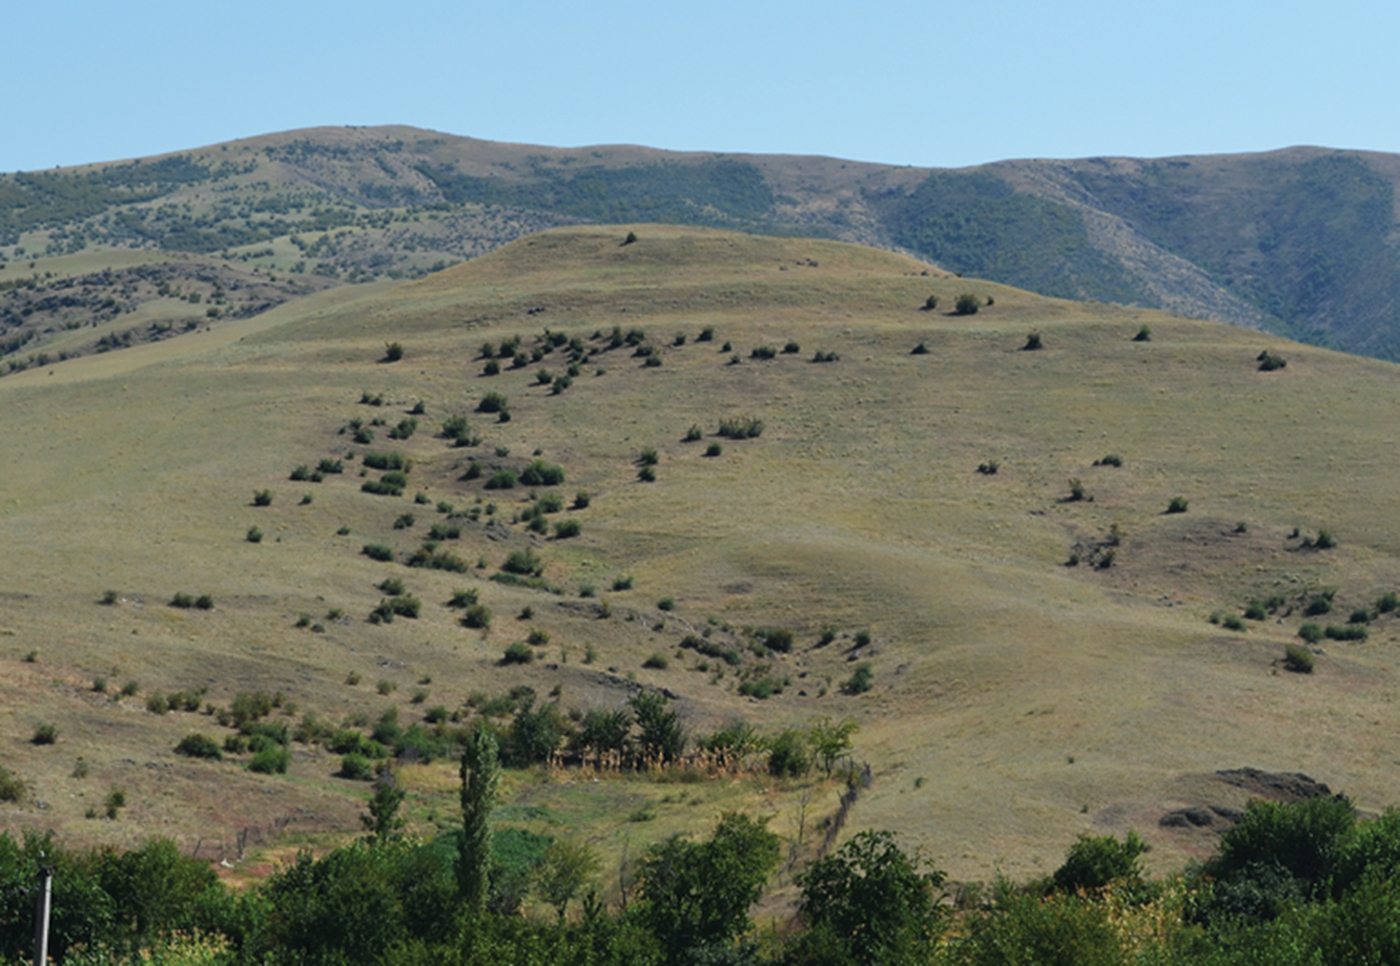
At Kavakh Tepe, surface mapping and UAV imaging identified a wide range of archaeological features comprising the fortress settlement complex (Figure 3). The main hill is dominated by a series of large terraces. Although these features are most clearly visible on the northern and western slopes (Figures 3–4), evidence for walls and terraces extends around virtually the entire hill. Up to five terraces are visible in places, although the lower ones are partial and do not extend around the whole hill.
Slope model of topography at Kavakh Tepe, with surface mapped features; letters show approximate positions of photographs in Figure 5.

Ground-level view of Kavakh Tepe from the north, showing topography of fortress terraces; areas of lower settlement are obscured from view.

Linear stone features at Kavakh Tepe.

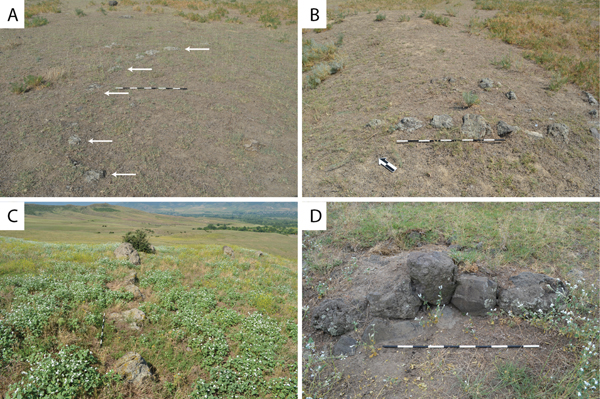
Linear stone features—the remnants of the fortress walls—were visible at the surface across the site (Figure 5). The stones used for these vary in size, in some places approaching 1m in diameter. Although most walls rarely survive above the ground surface, in one place multiple courses are visible (Figure 5D). A circular wall surrounding two topographic prominences, with a shallow saddle between them, demarcates the top of the fortress. Bedrock is exposed in places at the two high points, suggesting either that no structures were ever present there, or that no traces remain. Walls visible at the surface within the citadel—particularly in the saddle—reveal a linear arrangement of rooms built against the exterior fortress wall.
A DEM-derived slope model reveals a series of depressions to the south and south-west of the main hill at Kavakh Tepe (Figure 3). The larger rectangular depressions are clearly modern, the remains of collective farm buildings dating to the Soviet period. Other clusters of shallow depressions are also present in these areas, although less sharply defined than the collective farm ruins. It was difficult, from topography alone, to determine whether these depressions were ancient semi-subterranean houses, or the result of modern activity associated with the farm. Although linear stone walls were noted near the edge of one of these depressions (Figure 5B), modern digging may have disturbed ancient structures in this area. A lack of spatial correlation between the depressions and Late Bronze to Early Iron Age ceramics, along with their tendency to group close to the farm ruins, suggests a recent date for the pits.
Linear stone features visible at the surface are probably a better indicator of ancient activity off the main hilltop. These surface features are concentrated on a series of low rises to the south of the main hill, although indistinct stone structures were noted in one or two places near the farm ruins to the west. Sections of walls, corners of structures and a semi-circular feature were mapped on the surface. Scatters of stones and indistinct structures were also recorded in certain areas (Figure 6).
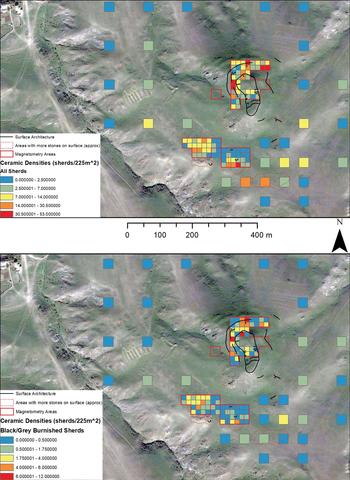
Results of surface collection at Kavakh Tepe, showing density (in sherds per 15 × 15m square) for all ceramics (top) and black/grey burnished wares (bottom).

Kavakh Tepe: surface collection
Systematic surface collection provided key information about the spatial organisation and chronology of the fortress settlement (Figure 6). On both the upper hill and in the lower areas, diagnostic ceramics dated overwhelmingly to the Late Bronze to Early Iron Ages. Diagnostic Late Bronze to Early Iron Age shapes or decoration include comb stamping, incised wavy or parallel lines, pattern-burnishing and one instance of a ‘zoomorphic’ handle (Figure S1 in the OSM). Due to the large number of body sherds with no diagnostic surface decoration or morphological features, sherds collected in the systematic survey (n = 1478) were classified by fabric type. Nevertheless, the majority of certain key fabric types, such as black/grey burnished wares (15 per cent of total assemblage, n = 221) and unburnished black/grey wares (49 per cent, n = 725), probably belong to the Late Bronze to Early Iron Ages. Ceramic assemblages from later Hellenistic and medieval sites in this region have a significant proportion of higher-fired reddish-orange ceramics, resulting in a harder, more vitrified ceramic. Only 18 (1 per cent) sherds of this type were found at Kavakh Tepe, and 10 of these were found in the nine north-westernmost 30m collection grids—near the ruined farm buildings, where evidence for Late Bronze to Early Iron Age occupation is minimal.
A distinctive ware with abundant inclusions of mica and a white mineral (quartz or feldspar) comprised a significant portion of the assemblage (21 per cent, n = 306) at Kavakh Tepe. Occasional diagnostic features, such as comb stamping and pattern burnishing on mica-tempered sherds, suggest that these ceramics also date to the Late Bronze to Early Iron Ages. Other ware types, such as red/brown burnished wares (2 per cent, n = 28) and generic buff/brown (7 per cent, n = 99), are present in small enough quantities that they probably reflect colour variation within the Late Bronze to Early Iron Age pottery assemblage. Red-painted wares typical of the late first millennium BC in the Kura Valley (Narimanishvili & Shatberashvili Reference Narimanishvili and Shatberashvili2004) are absent. No clearly diagnostic sherds from earlier periods were identified, although a few unusual obsidian-tempered coarse body sherds may be of earlier date.
As virtually all diagnostic ceramics from the site date to the Late Bronze to Early Iron Age (c. 1500–500 BC), the spatial distribution of ceramics (particularly black/grey burnished wares) should approximate the spatial extent of the contemporaneous settlement. Ceramic distribution in the lower area shows some particularly interesting patterns (Figure 6). Instead of forming a continuous zone of activity, the distribution forms a series of discontinuous hot spots. Colluvial redeposition from the main hill does not adequately explain this distribution in the lower area, as a low valley separates it from the main hill. Moreover, these areas of high ceramic densities correspond roughly to areas where stone walls and/or stone scatters were mapped on the surface. This strongly suggests that these structures date to the Late Bronze to Early Iron Ages. On the other hand, the lack of correlation between the shallow depressions and high densities of ceramics suggests that these are later in date and probably connected with the collective farm.
Kavakh Tepe: magnetometry
Magnetometry was successful in mapping buried structures on the upper fortress and the lower areas to the south (Figures 7–8). In several parts of the upper hill, surface features tentatively identified by surface survey, such as the arrangement of rooms along the fortress wall and the possible terrace house to the north, were confirmed and expanded upon by the magnetometry data. Surface walls were used to identify the characteristic magnetic signature of exposed anthropogenic structures and to guide the interpretation of sub-surface features.
Results of magnetometry survey at Kavakh Tepe overlain onto a DEM-derived slope model; positive anomalies in the magnetometry are darker, negative anomalies are lighter.

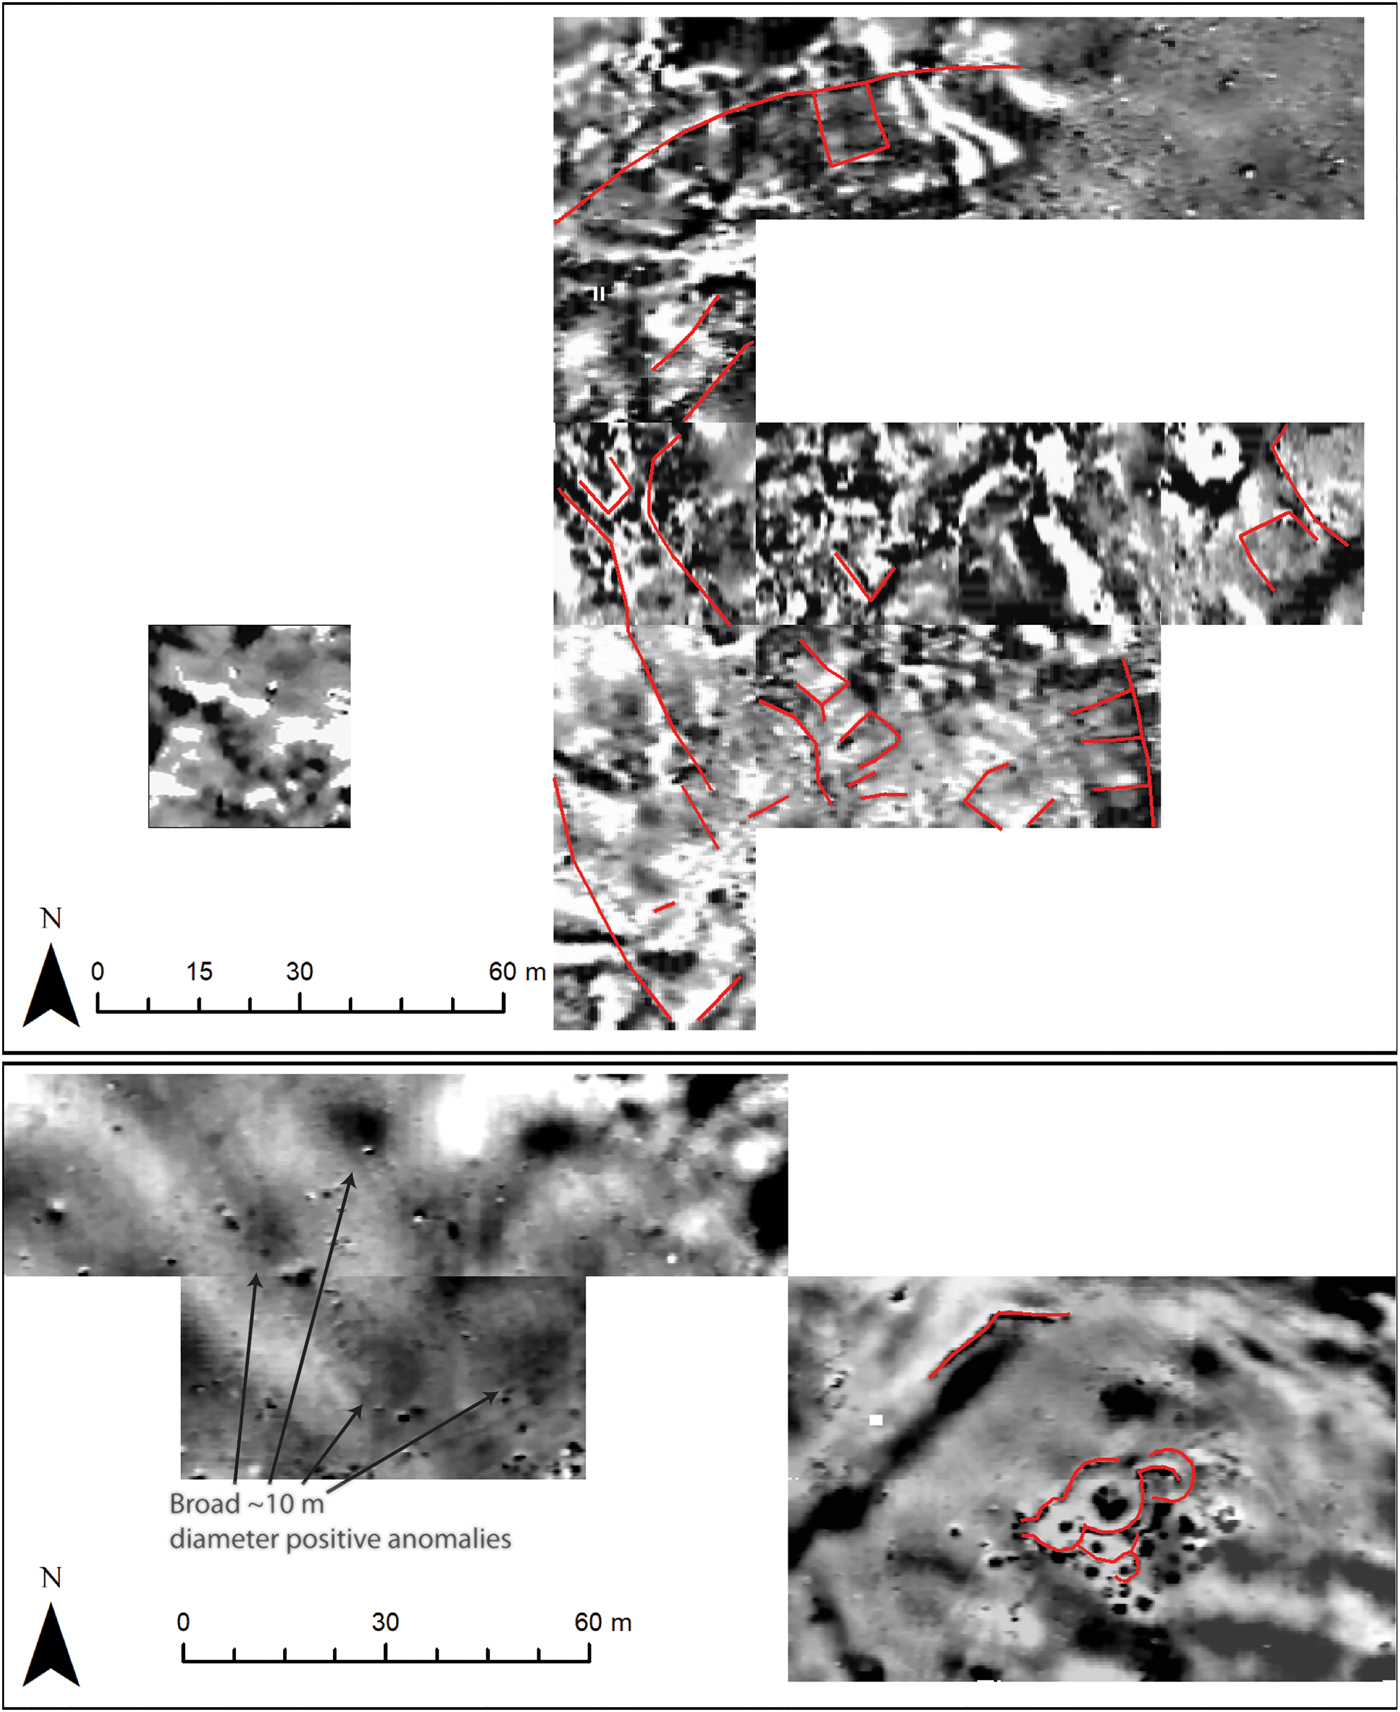
Annotated magnetometry data with possible anthropogenic features marked; positive anomalies are darker, negative anomalies are lighter.

In the lower area, the gradiometry survey revealed a compound of structures, only small parts of which were visible at the surface. Thin linear anomalies are interpreted as walls or otherwise intentionally arranged stones. These structures are situated on a low rise, which is partially demarcated by a wall to the north-west. This wall, which has one obtuse angle, parallels a broad linear area of high magnetism in an arrangement that may indicate that this latter feature is also anthropogenic. A series of compact, circular, strongly positive magnetic readings—some with negative halos that indicate the probable presence of buried round structures—are distributed within and around the compound of structures. The western half of the lower survey area lacks obvious curvilinear stone features, but includes several broad areas (~10m diameter) of positive magnetic anomalies appearing at somewhat regular intervals.
As cemeteries are often located in the areas surrounding hilltop fortresses, it is essential to consider whether these features represent burials or residential structures. Cromlech burials of the period often consist of stone circles with a central burial (Narimanishvili Reference Narimanishvili2006: 9–10; Smith et al. Reference Smith, Badalyan and Avetisyan2009: 107, pls 77C & 81B). Conversely, the shape of a central walled structure—with smaller, rounded oblong structures extending from it—is somewhat similar to residential compounds seen elsewhere, although these are not usually perfect circles (Lindsay et al. Reference Lindsay, Smith and Badalyan2010, Reference Lindsay, Leon, Smith and Wiktorowicz2014). One possibility is that the structures mapped in the magnetometry survey represent several superimposed cromlechs. Even if some of these structures are burials, however, other evidence suggests that activity in this lower area was not exclusively mortuary. The density of ceramics here equals that of the main hill, suggesting a level of activity consistent with habitation and its associated domestic discard. Indeed, some of the highest densities of ceramics in the lower area were recorded adjacent to the compound of structures. A cemetery is a strange location for discarding household waste, unless residential areas are located in quite close proximity. Finally, a denticulate chipped stone sickle-insert found in the western part of the lower settlement magnetometry survey further suggests the non-mortuary character of at least some of the activities in these areas.
At the same time, the area of high ceramic density in the western part of the lower area is not matched by unequivocal structures visible in the magnetometry data. Could these ceramics derive from the area immediately to the south, where a series of shallow depressions and sections of linear stone walls were recorded? Or could these high ceramic densities indicate that settlement in these areas was constructed using different (perhaps more ephemeral) materials that lack a strong magnetic signature? The broad 10m-diameter positive magnetic anomalies in this area—noted above—might be evidence for this. Without excavation, however, it is not possible to ascertain whether these features are anthropogenic or natural. Tentatively, one might explain the combination of high ceramic densities without clear associated structures visible in the magnetometry as the product of regular but non-permanent occupation.
Thus, the overall structure of the Late Bronze to Early Iron Age fortress settlement at Kavakh Tepe is one in which a series of smaller satellite areas—possibly encompassing both residential and mortuary areas—were constructed on low rises off the main hill. There seems to have been a clear spatial separation between the main fortress and the lower settlement, with a low valley between them. Within the lower settlement itself, there are hints that habitation was discontinuous and potentially less permanent than on the main hilltop.
Mtsvane Gora: surface mapping and UAV imaging
Mtsvane Gora is more modestly sized than Kavakh Tepe. Here, only one major encircling wall is visible (Figure 9), although other slight terraces are visible in a few locations. As at Kavakh Tepe, a number of depressions are visible outside the main walls of the fortress, some of which are clearly modern. Others are of unclear date. The shallow depressions on the northern slopes of the hill—arranged in roughly four lines—are difficult to interpret. The slope model shows that these depressions continue into a modern cemetery, suggesting that they pre-date its construction. A test pit excavated at the edge of one of these depressions in order to find the wall of the structure, however, yielded only colluvial deposits and much smaller quantities of ceramics than excavations within the main encircling wall. On balance, therefore, it seems unlikely that these depressions represent extramural Late Bronze to Early Iron Age settlement activity. A well-preserved, clearly identified circular cromlech was located to the north-west of the site, in an area that contained other indistinct scatters of stones—perhaps indicating the presence of other structures.
DEM-derived local relief model (LRM) of Mtsvane Gora; local depressions are darker, local prominences are lighter.

Mtsvane Gora: surface collection
Systematic surface collection carried out in 2014 is detailed elsewhere (Erb-Satullo Reference Erb-Satullo, Anderson, Hopper and Robinson2018). This revealed significant quantities of diagnostic Late Bronze to Early Iron Age ceramics. Surprisingly, given the prominence of the hill and its proximity to the main route of travel following the Debeda River, there is little evidence of significant later occupation. Only one fragment of glazed ceramic was found on the surface (outside of the systematic collection squares). One additional glazed sherd was found in the topsoil of a 2015 test trench. Excavations in 2015 and 2017 have confirmed substantial Late Bronze to Early Iron Age occupation on the hilltop. While systematic surface collection was not conducted around the cromlech to the north-west, it was clear from casual observation that there were far fewer ceramics at that location than on the hill itself. Given the lack of systematic survey in areas farther from the hill, and the closer proximity of modern settlement, we cannot rule out the existence of lower settlement in these more distant, outlying areas.
Mtsvane Gora: magnetometry
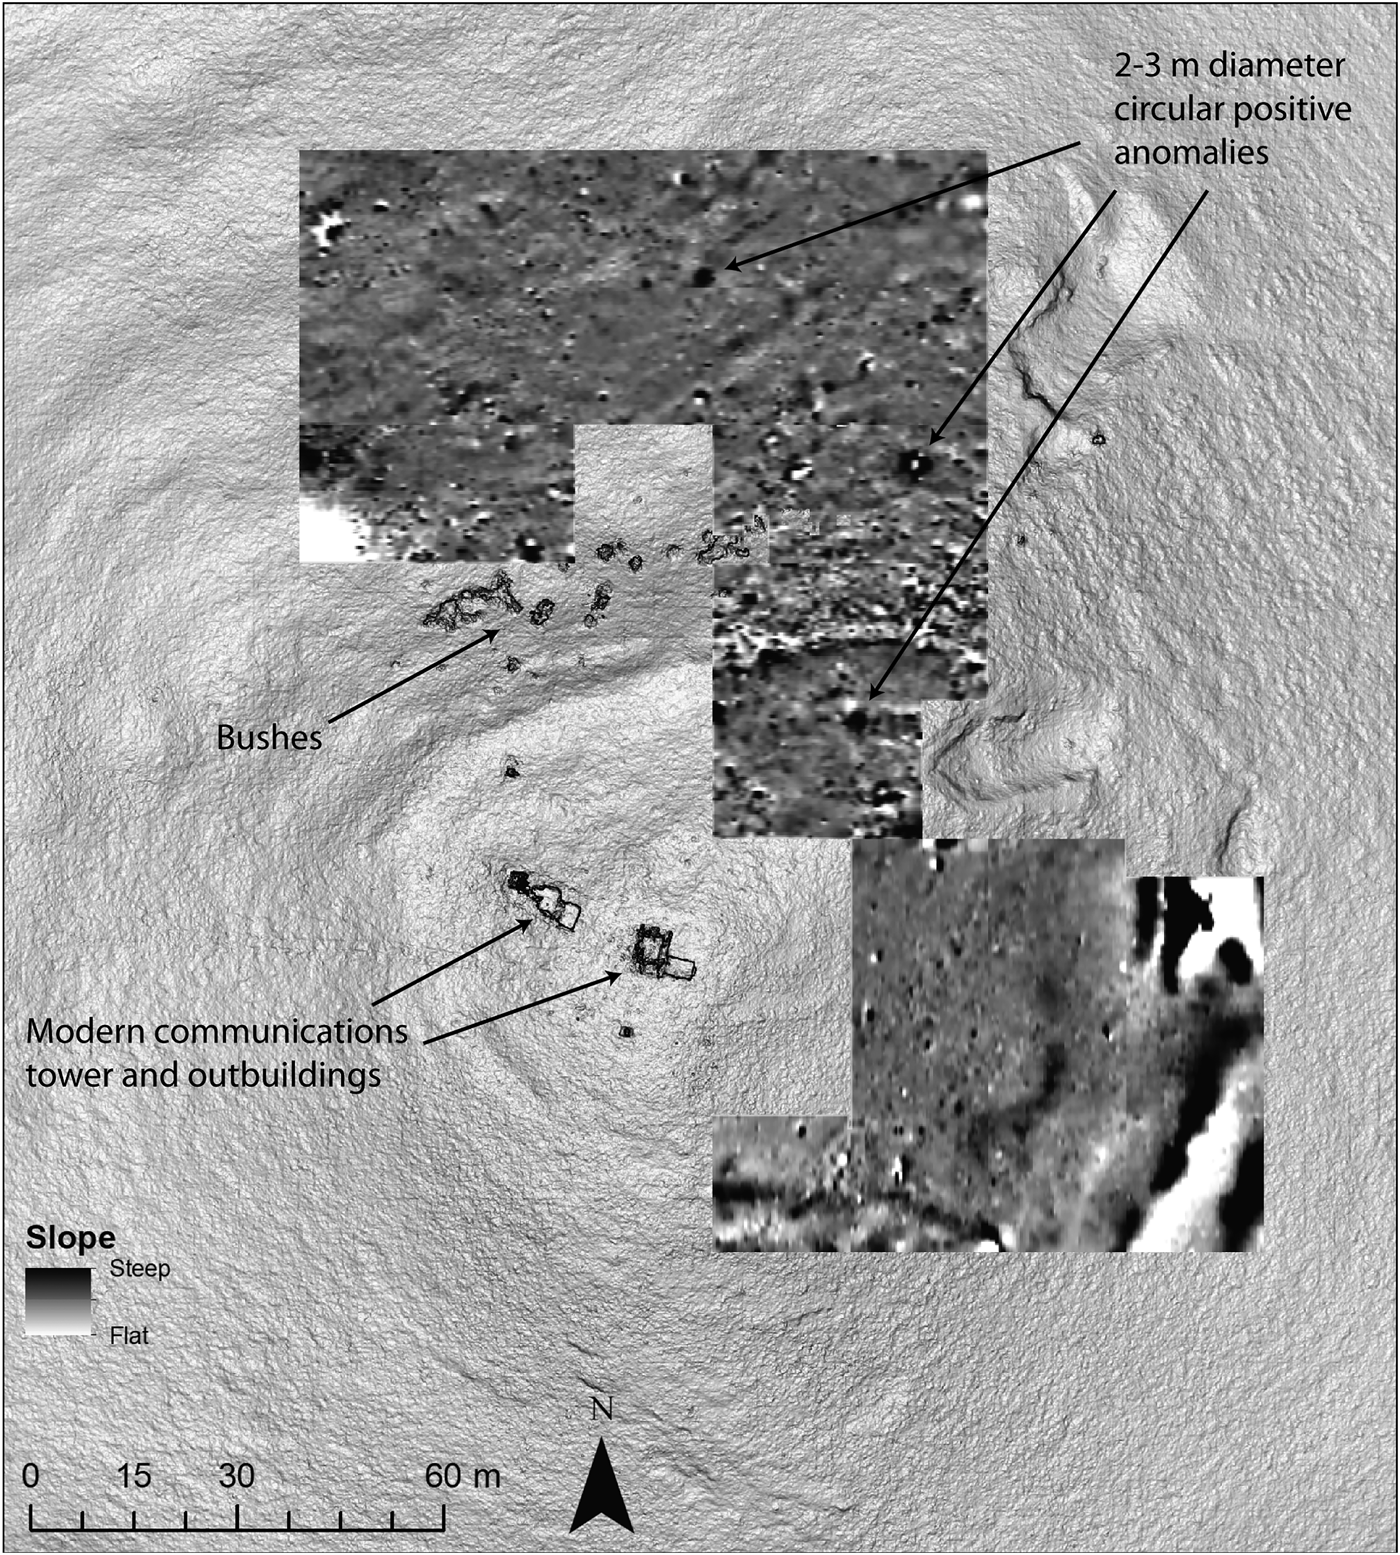
Relative to Kavakh Tepe, magnetometry at Mtsvane Gora (Figure 10) was less successful in identifying buried architecture and metallurgical features—perhaps because of the differing geology. The fortification wall is visible in the magnetometry data on the northern edge of the hill, but is significantly less clear on the south-eastern side, despite other indications that it extends around the whole hill. Although slag is visible on the surface, there appear to be no clear concentrations of sub-surface metallurgical debris. Several circular positive anomalies (2–3m in diameter) were noted, but as these do not correlate with surface slag finds, it is difficult to identify them as metallurgical. These results probably indicate that metal production activities were restricted to processes that produced small quantities of slag and/or that such activities took place in areas covered by a modern communications tower built on the summit of the hill (Figure 10). No clear extramural structures are visible in the magnetometry data on the hill slopes, including around the shallow surface depressions.
Magnetometry at Mtsvane Gora overlain onto a DEM-derived slope model; positive anomalies in the magnetometry are darker, negative anomalies are lighter.
Discussion
The combination of aerial drone mapping, magnetometry survey and surface collection provides important data on the socio-spatial organisation of fortress settlements in the South Caucasus, c. 1500–500 BC. At Kavakh Tepe, the data show that occupation beyond the main fortress was spread across a series of low rises to the south during this period. At the smaller site of Mtsvane Gora, extramural settlement was not identified, although survey was restricted to areas on the immediate hillslope; more distant zones were not examined systematically.
The development of ancillary settlement somewhat removed from the main fortress suggests that people living in these satellite areas maintained a degree of social distance from the fortress, even as they were drawn into its orbit. Perhaps mobile groups preferred this approach as a way of avoiding complete and irreversible incorporation into the social fabric of the fortress community. Other lines of evidence, such as areas where there is a mismatch between the amount of visible architecture and the high ceramic densities, are consistent with regular, although impermanent, habitation. Positioned along major routes between lowland and highland areas, sites such as Kavakh Tepe and Mtsvane Gora probably experienced seasonal fluctuation in population numbers.
While living in a fortress settlement might have offered added security, access to economic networks (Badalyan et al. Reference Badalyan, Smith and Khatchadourian2010: 268) and the ability to participate in ritual activities (Smith & Leon Reference Smith and Leon2014), it would have also presented a new set of social demands. It is difficult to assess the extent to which the spatial separation between lower settlement and the upper fortress at Kavakh Tepe reflected social boundaries, but it is certainly conceivable that there was a correlation. If fortresses such as Kavakh Tepe were indeed the product of political centralisation, the abandonment of mobile lifeways would have subjected previously mobile groups to the growing authority of fortress elites (Lindsay & Greene Reference Lindsay and Greene2013). Even if fortress communities lacked a single centralised authority, residence in such a community would have imposed new social obligations.
Placed into a wider regional framework, the data from Kavakh Tepe support a model of settlement aggregation in which previously mobile (and perhaps still partially mobile) segments of the population progressively settled around Late Bronze Age fortresses. Two caveats are worth noting, however. First, the poor resolution of the ceramic chronologies (see the OSM) means that we cannot distinguish between the initial construction of the fortress and the later settlement of the lower areas. Although settlement in earlier periods on the hilltop cannot be ruled out, the current evidence for it is weak. Second, the process of settlement growth was not necessarily a unidirectional trajectory—as earlier Marxist models imply. There are suggestions that the first millennium BC was punctuated by a period of settlement destruction and/or abandonment around the sixth to fourth centuries BC (Lordkipanidze Reference Lordkipanidze1989: 181–82; Narimanishvili et al. Reference Narimanishvili, Amiranashvili, Davlianidze, Murvanidze, Shanshashvili and Kvachadze2007: 19). While the reasons for this settlement decline are not entirely clear, it is consistent with what is seen at Kavakh Tepe, which displays little evidence of occupation from the second half of the first millennium BC. Farther south at Tsaghkahovit, excavations have shown that the Iron III (Achaemenid) settlement was re-founded after a hiatus in occupation, and followed a significantly different spatial organisation (Khatchadourian Reference Khatchadourian2016: 155–58).
To what extent can the model of settlement growth around hilltop fortresses be linked to the nucleation of larger settlements and towns in the late first millennium BC? The existing data make it difficult to address this question. While Kavakh Tepe itself lacks any significant late first-millennium BC occupation, there are numerous sites in the Kura Valley with settlement evidence during both the Late Bronze to Early Iron Ages and the Achaemenid/Hellenistic periods (Khakhutaishvili Reference Khakhutaishvili1964: 101, Reference Khakhutaishvili1970: 110; Gagoshidze Reference Gagoshidze1979; Sadradze Reference Sadradze2002; Licheli Reference Licheli2011). In many of these cases, however, later occupation obscures a full exploration of earlier settlement patterns. Furthermore, the lack of systematic surface collection at these sites precludes clarification of the timing of their spatial development. Kavakh Tepe, on the other hand, provides a snapshot of this early configuration, unobscured by later settlement.
In summary, the data gathered from the current project reveal more about the organisation and growth of Late Bronze to Early Iron Age fortress communities in the South Caucasus than about the emergence of larger towns and cities in the late first millennium BC. Indeed, there is a growing corpus of work suggesting that settlement aggregation and the growth of fortress settlements resulted in communities that were distinct from the traditional Near Eastern urban model (Smith Reference Smith2005: 230; Lindsay & Greene Reference Lindsay and Greene2013; for a slightly different perspective, see Hammer Reference Hammer2014: 758–59). Certainly, Late Bronze to Early Iron Age population aggregation differs in key ways from Chalcolithic and Early Bronze Age Mesopotamian urbanism. Whereas Late Bronze Age fortress communities emerged from a social landscape characterised by high levels of mobility, clear indicators of social inequality and a dearth of settlement, northern Mesopotamian urbanism grew from a more settled landscape, containing comparatively less evidence of extreme social inequality (Ur Reference Ur2010). It should also be noted that Kavakh Tepe—at about 10ha in size—is much smaller than many Mesopotamian Bronze Age urban sites. At the same time, these different models of population aggregation all share similar themes. These include the challenges of incorporating disparate groups into a durable social unit, as well as the tension between centripetal and centrifugal forces in the growth of settlements. There are numerous other examples of population aggregation at fortified settlement complexes in Greater Eurasia (e.g. Anthony Reference Anthony, Hanks and Linduff2009; Sharples Reference Sharples, Fernández-Götz, Wendling and Winger2014), some of which also arose in the context of highly mobile societies. The continued study of South Caucasian fortress complexes has an important role in building a comparative understanding of these processes.
Conclusions
The combination of the UAV photogrammetry, magnetometry, surface mapping and field collection provides a more complete picture of the spatial organisation of the Kavakh Tepe fortress settlement than any single method could. At Mtsvane Gora, remote sensing and magnetometry has proved less successful at identifying buried structures and metal-production activities. While data from Kavakh Tepe suggest that the clusters of shallow depressions were probably modern, they also reveal significant areas of ancient activity spread across the low rises to the south of the main hill. It is ironic that the features that initially drew our attention to the possibility of a lower settlement are probably modern, yet other evidence clearly demonstrates the presence of off-hill Bronze and Iron Age occupation. Combined topography, magnetometry and surface collection suggests that these lower areas may have included both residential and mortuary zones. High concentrations of ceramics—without associated structures visible in the magnetometry results—may indicate that settlement in the lower areas differed in character from those of the main hill, perhaps suggesting ephemeral or seasonal habitation. These lines of evidence support a model of settlement aggregation in which previously mobile groups settled around these fortresses, while maintaining a degree of spatial and perhaps social separation. Whether analogous processes drove the emergence of large towns and cities in the late first millennium BC remains uncertain. More broadly, the spatial investigations of fortress settlements, such as Kavakh Tepe and Mtsvane Gora, contribute to a comparative understanding of how large settlements can emerge from highly mobile societies.
Acknowledgements
The authors would like to thank the members of the 2016 ARKK field season, including Anthony Gilmour, Sarah Martini and Tinatin Bulashvili. This research was supported by a Junior Research Fellowship from the American Research Institute of the South Caucasus; the American School of Prehistoric Research; and a Spatial Archaeometry Research Collaborations (SPARC) Fieldwork Grant to Nathaniel Erb-Satullo. Funding for SPARC is provided by the National Science Foundation (BCS-1519660).
Supplementary material
To view supplementary material for this article, please visit https://doi.org/10.15184/aqy.2018.191.