I. INTRODUCTION
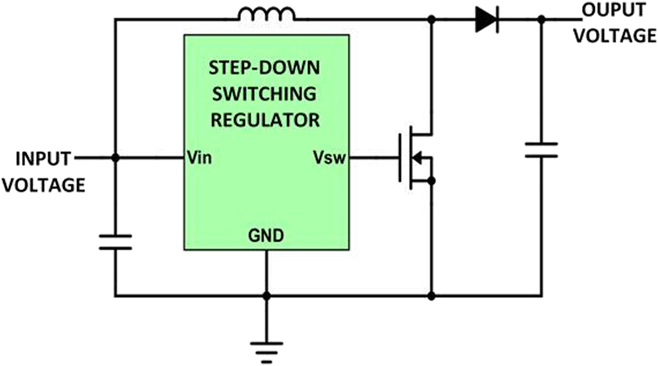
Switched mode power converters remain popular for battery-powered applications due to their higher efficiency as compared to linear regulators. This higher efficiency allows batteries to last longer and circuits to stay cooler. Pushing the ability of power converters to operate at higher frequencies allows for smaller external components, such as transistors, inductors, and capacitors, enabling smaller converter sizes and lowering component costs.Reference Keeping2 There has been a great deal of research lately in wide/ultra-wide band gap SiC, GaN, and AlN transistors for high power electronics. These switches enable great reductions in size and weight due to their material parameters, enabling larger voltages, greater currents, and higher frequencies. Unfortunately, scaling and performance of passive components, such as inductors and capacitors, have not kept pace with the advances made in these high-power transistors. These larger and heavier circuit elements ultimately limit the power densities, operation frequencies, and converter sizes that can be achieved. Inductors are particularly problematic as they are not as easy to microfabricate as transistors and are typically added as a separate discrete component. As much as circuit designers would love to eliminate inductors altogether, they perform a vital function as energy storage devices in switched mode power converters. In boost converters (Fig. 1), the inductor not only stores energy while the transistor is switched on but also boosts voltage and current to the load, recharging the capacitor in the process, when the transistor is switched off.Reference Keeping3 Increasing the switching frequency of the regulator allows the use of a smaller inductor. It turns out that the inductor value is inversely proportional to switching frequency for equal peak-to-peak ripple current. A lower inductor value means fewer loops and/or thinner wire for the coil, and a smaller core (area inside the coil) reducing the inductor’s volume.Reference Keeping3 Fewer wiring loops means reduced wiring loss, boosting inductor Q’s and enabling higher frequency operation. While higher switching frequencies are enabled by these wide band-gap transistors (100 kHz for SiC; 1 MHz or more for nitride-based devices), these improvements cannot be fully taken advantage of due to a variety of energy loss mechanisms in the inductors. A new effort is needed to explore next generation mesoscale (i.e., mm size) magnetic passive components that go beyond the limits of current technology. In addressing this need, a novel nanocomposite was recently developed, incorporating superparamagnetic nanoparticles as the magnetic core material.Reference Watt, Bleier, Romero, Hance, Bierner, Monson and Huber4 Superparamagnetic nanoparticles, by definition, possess no hysteresis and are too small to support eddy currents, thereby removing two of the major sources of loss. The novel nanocomposite was formed by first synthesizing gram-scale quantities of Fe/FexOy core–shell nanoparticles to be used as the magnetic fraction. Nanocomposites are typically formed by the organization of nanoparticles within a polymeric matrix. However, this approach can lead to high organic fractions and phase separation, both of which reduce the performance of the resulting material. To maximize the nanoparticle loading in the novel nanocomposite, a ligand exchange procedure was carried out to yield aminated nanoparticles that are then cross-linked using epoxy chemistry. The result is a magnetic nanoparticle component that is covalently linked and well separated. By using this “matrix-free” approach, the nanocomposite possessed a substantially increased magnetic nanoparticle fraction, while still maintaining good separation, leading to a superparamagnetic nanocomposite with strong magnetic properties. By combining this new, high performance, magnetic core material with microelectromechanical (MEMS) technology, it becomes possible not only to miniaturize but integrate microinductors with transistors on the same wide band-gap semiconductor chip. This provides a significant technological leap forward toward the ultimate scaling of power converter technology by achieving a fully integrated, monolithic, Power Supply on Chip (PSoC).Reference Mathuna, Donnell, Ningning and Rinne5,Reference Mathúna, Wang, Kulkarni and Roy6 Before jumping right into device design and microfabrication, it is both prudent and necessary to develop a working model that not only calculates basic inductance values but is sophisticated enough to handle the breadth of physics involving a nonlinear core material. This paper will cover initial modeling results for both a 2 μH and 500 nH microinductor, how this novel nanocomposite material impacts performance and possible directions for future model improvements that will ultimately lead to better microinductor designs.
Simplified switched mode boost converter circuit design. The inductor stores magnetic energy with current generated from the input voltage source when the switching transistor is in the “on” state and supplies boosted power to the load when the switching transistor is in the “off” state.

II. MODEL OVERVIEW AND THEORY
A. Overview
There are a number of different ways to model inductors ranging from simple analytical modelsReference Zhang and Foo7–Reference Green9 incorporated in commercial software such as SPICE (Analog Devices, Norwood, Massachusetts)Reference Rozanov and Ben-Yaakov10,Reference Taki, Bensetti and Sadarnac11 and MATLAB (Mathworks, Natick, Massachusetts)12–Reference Eroglu14 to more sophisticated finite element (FE) modelsReference Paoli, Biro and Buchgraber15–Reference Bi and Jiles17 such as Ansoft Maxwell field simulator’s magnetostatic solver (ANSYS, Inc., Canonsburg, Pennsylvania)Reference Salas and Pleite18–Reference Ammouri, Salah and Kourda20 and COMSOL Multiphysics (COMSOL, Inc., Stockholm, Sweden).Reference Mickey, Madsen, Knott and Andersen21–25 Each has their strengths and weaknesses depending on aspects such as the breadth of physics involved, type of the core material used (air, linear, or nonlinear), and geometrical complexity to the more practical, but still important, licensing costs. COMSOL Multiphysics 5.3 allows you to customize material properties, model complex geometries representative of realistic microfabricated features, and perform parametric sweeps of inductor geometry, number of turns, core material properties, etc., to explore the vast design space to obtain a specific, optimized inductance. COMSOL is also capable of multidomain simulation (i.e., static, frequency, and time domain), exploring temperature effects from Joule heating and leakage flux, and, finally, incorporating additional physics via customized equations if necessary. The author chose COMSOL Multiphysics to model our microinductors for all the above reasons.
B. Theory
Most inductors used for switched mode power converters are toroidal inductors. Toroidal inductors are heavily utilized for power electronics as they have closed magnetic paths for higher power density and do not produce significant external fields resulting in electromagnetic interference and losses in nearby conductors. MEMS toroidal inductors have been modeled and experimental results provided for embedded inductors with both silicon and air cores.Reference Araghchini and Lang13 Unfortunately, the lack of a magnetic power amplifying core limits the total inductance to 45 nH in this specific example. To first order, the inductance of a toroidal inductor with a rectangular cross section is given by the following equation:
 $$L = {{{\mu _{{\rm{eff}}}}{\mu _0}{N^2}h} \over {2\pi }}\ln \left( {{b \over a}} \right)\quad ,$$
where μeff is the effective permeability for gapped cores or simply the relative permeability for uncapped or distributed gap cores, μ0 is the vacuum permeability, N is the number of wire turns, h is the core height, a is the inner radius, and b is the outer radius. This simple equation clearly shows how inductance increases when μeff, N, h, and the ratio of b/a increase. This should remain true regardless of whichever model is used for designing toroidal inductors and provides a good reality check. However, while providing a good, first approximation under DC conditions, this equation falls quite short when considering effects due to nonlinear core materials, core losses, uneven magnetic flux distribution in the core, distributed wiring capacitance, and resistive wiring losses due to skin depth, proximity, and other effects over frequency due to AC currents. To capture all these effects in an analytical model is daunting to say the least but relatively easy using COMSOL Multiphysics.
Magnetic core issues that plague most inductors using existing ferrite, amorphous, or nanocrystalline materials include high hysteresis and eddy current loss. The key technological development behind our approach is a novel nanocomposite magnetic core material developed at Sandia that employs superparamagnetic iron nanoparticles as the magnetic fraction. An ensemble of superparamagnetic nanoparticles will align their magnetic moments with an external applied magnetic field much like paramagnetic materials (low, linear susceptibility). However, the magnetic susceptibility of the ensemble is much larger and more like a ferromagnet (high, superlinear susceptibility). A large susceptibility is important for improving inductance and switching performance. Equally important, this new core material has the potential for high magnetic flux saturation (1.0 T) that is in the mix of commonly used core materials including pure iron (2.15 T), SiFe alloy (1.87 T), and Metglas (1.60 T). This high saturation value allows for higher switching currents to be used, increasing the inductor power density.
Magnetic losses are often expressed in power density per cycle with units of J/m3. In the case of hysteresis, the equation describing this is the following:
 $${{{P_{{\rm{hys}}}}} \over V} = \oint {H\left( t \right){\rm{d}}B} \quad .$$
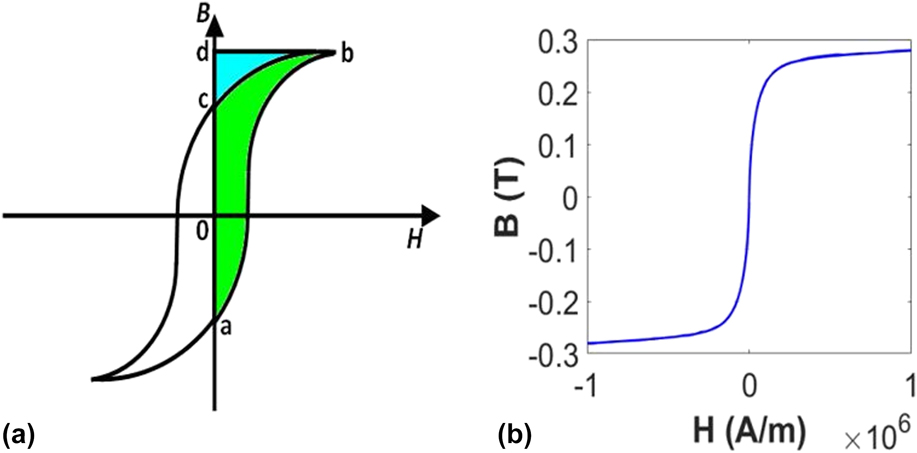
Thus, the power lost per unit volume of the core material over one switching period is given by the area traced out by the points a, b, and c shown in Fig. 2(a). Our nanocomposites will be designed so that the nanoparticles are always above their blocking temperature (temperature at which single domain nanoparticles become superparamagnetic), resulting in no hysteresis and therefore zero loss [Fig. 1(b)].
(a) Hysteresis loss (shaded area inside of curve) in a ferromagnetic material (exaggerated). (b) B versus H plot of the nanoscale-enabled composite core material showing zero hysteresis.

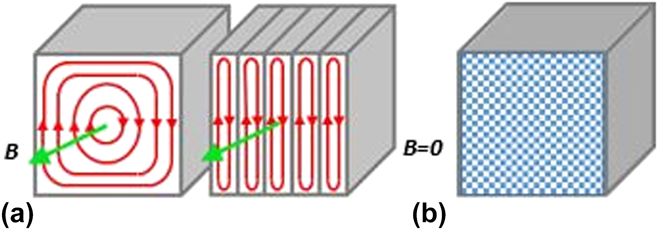
Figure 3(a) illustrates the formation of eddy currents, which are internal loop currents that oppose a time-varying magnetic field and result in additional magnetic energy loss.1 Eddy current loss can be expressed by the following:
 $${{{P_{{\rm{eddy}}}}} \over V} = {{\omega {B^2}A} \over {48\rho }}\quad ,$$
where A is the cross-sectional area of the core and ρ is the core resistivity. Laminated iron cores help to reduce this effect by shrinking the size of the loops. Nevertheless, they are still present and contribute to loss in laminated cores. Since the iron nanoparticles are uniformly and spatially separated by a nonconducting epoxy molecule in our novel core material, the matrix is a dielectric and cannot support the formation of eddy currents and, thus, an opposing B-field. Furthermore, as the nanoparticles will have diameters of 15 nm or less, they will be too small to support substantial eddy currents.
(a) Eddy current loss in a bulk and laminated core. (b) Nanocomposite matrix cannot support an opposing B-field due to electrical isolation of the particles. Modified from Ref. 1.

Researchers at UC Berkeley have tried developing a magnetic core with a nanoparticle medium for on-chip planar RF inductors.Reference Yang, Koh, Zhu and Lin26 A prototype design was constructed using a nickel-iron permalloy (Ni80Fe17Mo3) fill. This fill consists of commercially obtained permalloy ferromagnetic particles crudely mixed into regular photoresist which is spin-coated or selectively filled around the planar inductor for a fully closed magnetic path. An impressive 8 GHz frequency performance was achieved due to the low eddy current loss in the magnetically dispersed medium. Despite the low eddy current loss, this nanoparticle medium still possesses a significant hysteresis loop with a coercivity, H C, of 9.5 kA/m and a low 0.07 T magnetic flux saturation due most likely to its low packing fraction. Thus, only sub-nH inductance was achieved which may suffice for RF inductors but not power inductors.
The following section describes the COMSOL model for simulating the microinductor for establishing an initial device design. The section also outlines steps used to set up the model.
III. SIMULATION
A. Geometry and materials
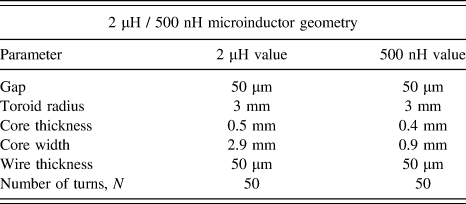
The author was tasked with modeling two different microinductors, a 500 nH input inductor and a 2 μH output inductor, that are part of a switched mode buck converter circuit. Both need to handle a switching frequency of 1 MHz. The output microinductor also needs to have an average power handling capacity of 8 W with a power density of at least 100 W/in3. Since parametric equations were used to model the geometry, the same model could be used to model both microinductor designs simply by changing the input parameters for each one. A rough design space was mapped out for both 500 nH and 2 μH microinductors using the analytical expression given in Eq. (1). Fabrication constraints were placed on things such as wire and nanocomposite core thickness while trying to make the overall form factor as small as possible.
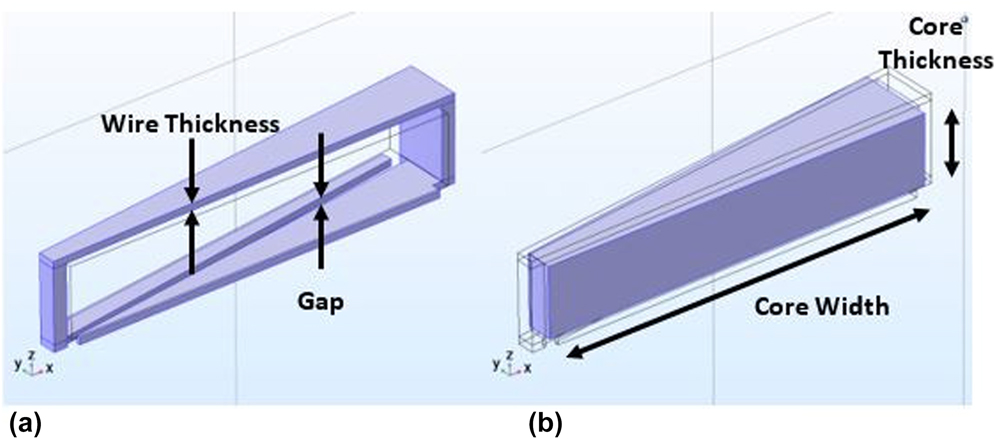
Only one single turn of the inductor, both copper coil and core segment, was used as a unit cell and periodic boundary conditions used to model the entire toroid. Exploiting this cylindrical symmetry reduces the size of the model by the number of windings greatly reducing the problem size and, thus, the computational requirements.23–25,Reference Chu27–Reference Frei31 The geometry of both the single, copper wire turn and the core segment was parameterized so that both can be easily changed and parametric sweeps performed to optimize the microinductor form factor. Unfortunately, due to the use of the Coil Geometry Analysis step in COMSOL that computes the path of the wires in complex coils with nonconstant cross section, this prohibits the use of built in optimization studies that might have made this analysis even easier. Figure 4 displays CAD renderings of both (a) single turn copper wire and (b) single turn core geometries. These shapes were made using rectangles, curves, and Bézier polygons with parametric equations that enable the modeler to adjust simply by inputting different values for the parameters listed in Table I. The choice behind using these shapes to build this rather complex single wire turn instead of using a much simpler spiral current was based on three reasons: (i) it captures the effects of resistive wiring losses due to skin depth and proximity effects and can be programmed to capture self resonance frequency due to distributed wiring capacitance, (ii) it captures effects related to real geometries produced using microfabrication and other additive manufacturing processes, and (iii) it can be used to automatically generate designs of optimized inductors for creating photomasks or 3D printing input files without having to redraw these structures again in separate CAD software.
(a) Computer rendering of a single turn rectangular copper coil geometry generated by parametric equations. (b) Single turn core segment.

2 μH and 500 nH microinductor geometrical parameters and values.

While the number of wire turns at both the inner radius and the outer radius must be constant, parametric design and microfabrication allow the designer to vary the size and shape of the wire turns to enable more flexibility when it comes to varying the number of turns as well as the outer/inner microinductor radius, b/a. Increasing both can help boost the inductance value, while keeping the overall microinductor size small. Additional benefits include lithographically defining finite gap spacings between turns that minimize this gap while increasing the overall degree of wire coverage of the microinductor core. In the work of Sullivan et al.,Reference Sullivan, Li, Prabhakaran and Lu32 it was shown that stray magnetic fields in the region containing the gaps lead to current crowding at the edges of the windings facing the gaps affecting the overall AC resistance. This is a consequence of AC current flowing in a skin-depth on the inner surface of a coil winding. Having a minimal slit width or gap between coil turns was conducive for reducing the AC resistance. Another high frequency consequence due to this skin effect involves the benefits of flat conductors versus round conductors. A flat conductor surface such as that achieved in Ref. Reference Phinney, Lang and Perreault33 will have less current crowding than the ridged surface of a wire-wound toroid. Flat coil turns defined by lithography with minimal gap spacing between turns help achieve a minimum AC resistance for a given size and number of turns by making maximal use of that surface (Fig. 4).
For materials properties, bulk copper wire was used for modeling the coil windings. The important parameter for the winding is the conductivity which is 6.0 × 10⁷ S/m for bulk copper. For the superparamagnetic iron nanocomposite, a first generation, nonoptimized formulation was used for the model. Material conductivity was measured using a four-point probe setup and a Keithley 2400 SourceMeter (Keithley Instruments, Cleveland, Ohio) on a 0.75″ long by 0.25″ wide molded epoxy sample. All four probes were spaced 0.125″ apart with the SourceMeter sourcing current through the outer two probes while measuring the voltage drop between the inner two probes. As suspected, the material was highly resistive and a calculated value of ∼1 μS/m was obtained for the material conductivity.
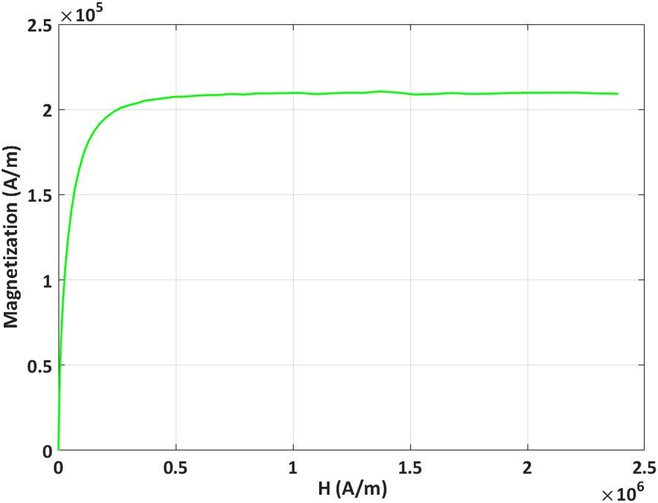
Figure 5 is a plot of the MH data taken using a Quantum Designs Versalab vibrating sample magnetometer (Quantum Design, Inc., San Diego, California) of the 1st generation superparamagnetic iron nanocomposite. This data plot was converted to a BH curve and then inverted to an HB curve for the magnetic fields (mf) interface used for this model. This curve provides the magnetic field inputs for the nanocomposite from which the model can generate H and μeff for an input value of magnetic flux, B.
MH curve for the 1st generation superparamagnetic iron nanocomposite material used in the FE model.

B. Physics interfaces
The single physics interface used in this model was the magnetic fields (mf) interface. The governing equations, initial conditions, and boundary conditions used are stated as follows:
Magnetic fields (mf):
 $$\nabla \times {\bi{H}} = {\bi{J}}\quad ,$$
 $${\bi{B}} = \nabla \times {\bi{A}}\quad ,$$
 $${\bi{J}} = \sigma {\bi{E}}\quad ,$$
where H is the magnetic field, J is the current density, B is the magnetic flux density, A is the magnetic vector potential, and σ is the electrical conductivity. Automatic values of A = (0, 0, 0) were applied for initial background flux conditions and a magnetic insulation condition, n × A = 0, was applied to the outer boundary of the spherical air volume applied but not shown in the previous images.
 $${\bi{H}} = f\left( {\left| {\bi{B}} \right|} \right)\left( {{{\bi{B}} \over {\left| {\bi{B}} \right|}}} \right)\quad .$$
Equation (7) illustrates how the model calculates the magnetic field, H, from the HB curve given a magnetic flux, B, from an applied current density, J.
 $${\bi{B}} = {\mu _0}{\mu _{\rm{r}}}{\bi{H}}\quad .$$
Equation (8) is used to determine the relative permeability, μr, of the nanocomposite material from the applied current density once H and B are known from Eq. (7).
 $$\left( {j\omega \sigma - {\omega ^2}{\varepsilon _0}} \right){\bi{A}} + \nabla \times \left( {\mu _0^{ - 1} \times {\bi{A}} - {\bi{M}}} \right) - \sigma {\bi{v}} \times \left( {\nabla \times {\bi{A}}} \right) = {{\bi{J}}_{\rm{e}}}\quad .$$
Finally, the full governing subset of Maxwell’s equations for the frequency domain is shown in Eq. (9), where ω is the angular frequency, ε0 is the vacuum permittivity, M is the magnetization, v is the velocity of the conductor, and Je is an externally generated current density.34 Again, COMSOL takes care of the core magnetization via the HB curve and the external generated current density via the current input by the modeler. At this point, all the necessary variables for solving Maxwell’s equations are satisfied.
A special coil domain setting is applied to the shapes comprising the single coil turn. In this setting, a current is applied consisting of a 1 A DC component with a 10 mA harmonic perturbation (AC) component. This enables a frequency sweep using a frequency-domain perturbation study step.
C. Meshing
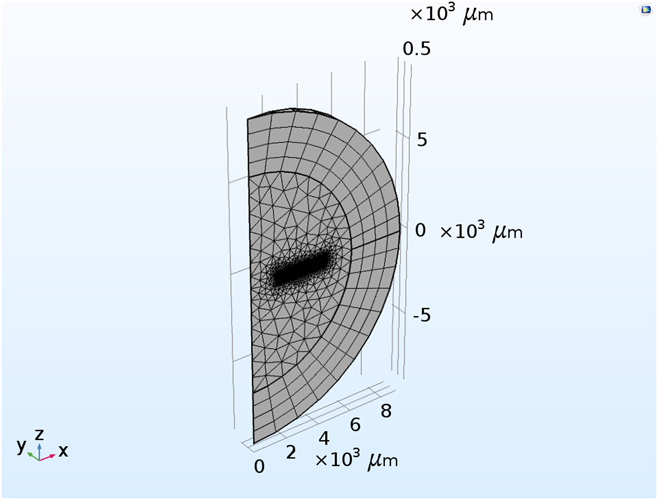
As mentioned previously, cylindrical symmetry was exploited to reduce the number of nodes. Thus, only a single coil turn with its associated core segment was meshed. An air volume with infinite element domains on the exterior was used to approximate a very large distance from the region of interest. This helps to increase both the accuracy of the model as well as to calculate the extent of the external poloidal field outside the coils that is ever present in toroidal inductors but seldom mentioned as it tends to be far less than the toroidal field inside the coils. The generated mesh is shown in Fig. 6. A user controlled mesh was applied to the model. Free tetrahedrals with a size set to “Extra fine” were applied to the copper wire shapes and the nanocomposite core segment while free tetrahedrals with a size set to “Finer” were applied to the surrounding air volume. A swept mesh was applied to the remaining infinite element domains. This configuration gives an average mesh quality of approximately 0.6.
Rendering of the mesh used for the 2 μH microinductor model. Tetrahedral elements are used for the core, wires, and air volume while swept quadrihedral elements are used for the infinite element domains.

D. Study
Three different study steps were used to model the microinductor. A coil geometry analysis was used for Step 1. This study step solves an eigenvalue problem for the current flow in a multiturn coil domain node that gives the current density produced by a bundle of conductive wires. A stationary study was used for Step 2. This step solves the stationary partial.
Differential equation (PDE) for the DC solution making it easier for the AC solution in the subsequent Frequency-Domain Perturbation study to reach convergence. For Step 3, a frequency-domain perturbation study was used as the regular frequency domain could not seem to handle the nonsymmetrical matrices involved. This study step is used to solve for studies of small harmonic oscillations about a bias solution by computing a perturbed solution of the linearized problem around the linearization point (or bias point) computed in the first stationary study step.34 As mentioned previously, a 1 A DC current is applied for computing the stationary study while a 10 mA harmonic perturbation (AC) component is used computing the frequency-domain perturbation study.
IV. SIMULATION RESULTS
Table I lists the various parameters used to model both 2 μH and 500 nH microinductors for a next generation, high performance, power converter to operate at 1 MHz switching speeds.
Both have the same 3 mm toroid radius, 50 μm wire thickness, 50 turns, and 50 μm wire-to-wire gap spacing. However, the 2 μH microinductor core is slightly thicker at 0.5 mm as compared to the 0.4 mm thick core of the 500 nH microinductor. The core width is also larger at 2.9 mm for the 2 μH versus 0.9 mm for the 500 nH microinductor.
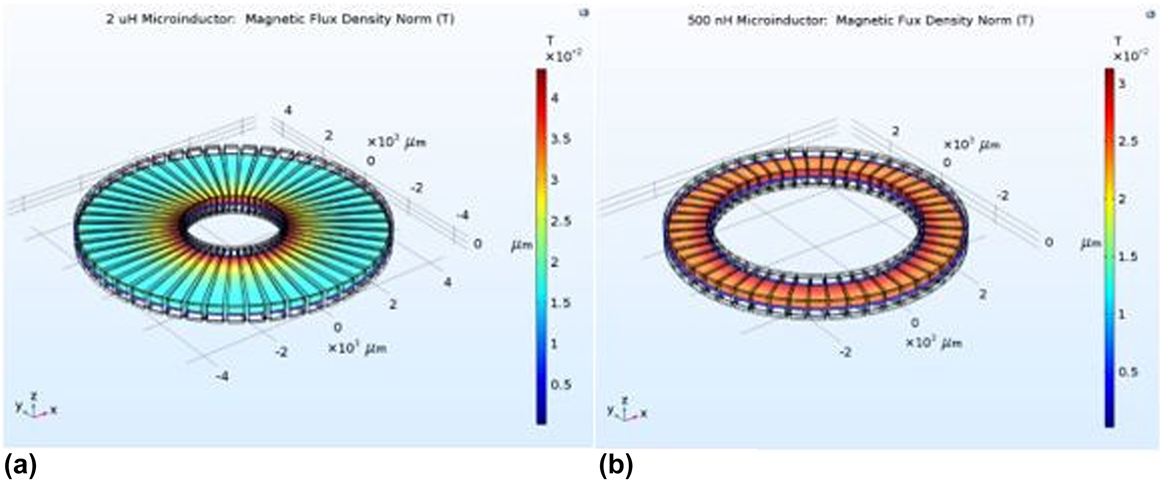
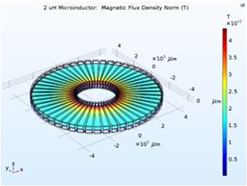
Figure 7 shows magnetic flux density normal plots for both the 2 μH and 500 nH microinductors. A slice through the center of the z-plane is shown with low to high normal flux density indicated by color ranging from blue (low) to red (high). As can be expected, the highest magnetic flux density of 0.04 mT in the core can be seen as an annular region closest to the inner radius of the 2 μH microinductor. This region experiences the highest current density due to both the density of wire turns at the inner radius and the narrowing of the wire turns themselves as they go from the outer toroid radius to the inner toroid radius. A maximum normal flux density of 0.03 mT can be seen at the inner region of the 500 nH microinductor. The 500 nH microinductor exhibits a more uniform flux distribution than the 2 μH microinductor due to the higher aspect ratio, thus, making more efficient use of the nanocomposite core material. Both, however, are less than 1 cm with regards to their outer diameters. Thus, both microinductors can be considered “chip scale” from the standpoint of their overall form factor and what is considered a reasonable chip size.
Plots of magnetic flux density normal for both (a) 2 μH and (b) 500 nH microinductors.

Table II provides some of the electrical parameters of interest for the two microinductors. The AC resistance at 1 MHz is on par with that of similar MEMS air core inductors of around 0.4 Ω along with higher values for quality factor, Q, of around 27.Reference Araghchini35 This is to be expected as the core helps to boost the stored energy, whereas many air core inductors tend to suffer from low values of Q. The average output power for the 2 μH output microinductor is around 7 W which is close already to the requested specification of 8 W just with the 1st generation superparamagnetic iron nanocomposite core material. The minimum power density specification of 100 W/in3 is already met and surpassed according to the model by these 2 μH microinductors at 3.9 kW/in3. This is also not surprising as magnetic devices based on currents tend to scale very well with miniaturization.
Modeled electrical parameters for 2 μH and 500 nH microinductors at 1 MHz.

To further improve the model, several more features need to be added that will capture physics that play an important role particularly at high frequencies. As mentioned earlier in Sec. II, zero hysteresis and eddy current loss are breakthrough features of this superparamagnetic nanocomposite over commercial ferrite materials in use today. However, that does not mean that other loss mechanisms are not present that will affect microinductor performance. To account for these loss mechanisms, measurements over frequency need to be made using a BH analyzer with each successive improvement in formulation. COMSOL handles magnetic losses using complex permeabilities:
 $${\bi{B}} = {\mu _0}\left( {\mu ' - {\rm{i}}\mu ''} \right){\bi{H}}\quad ,$$
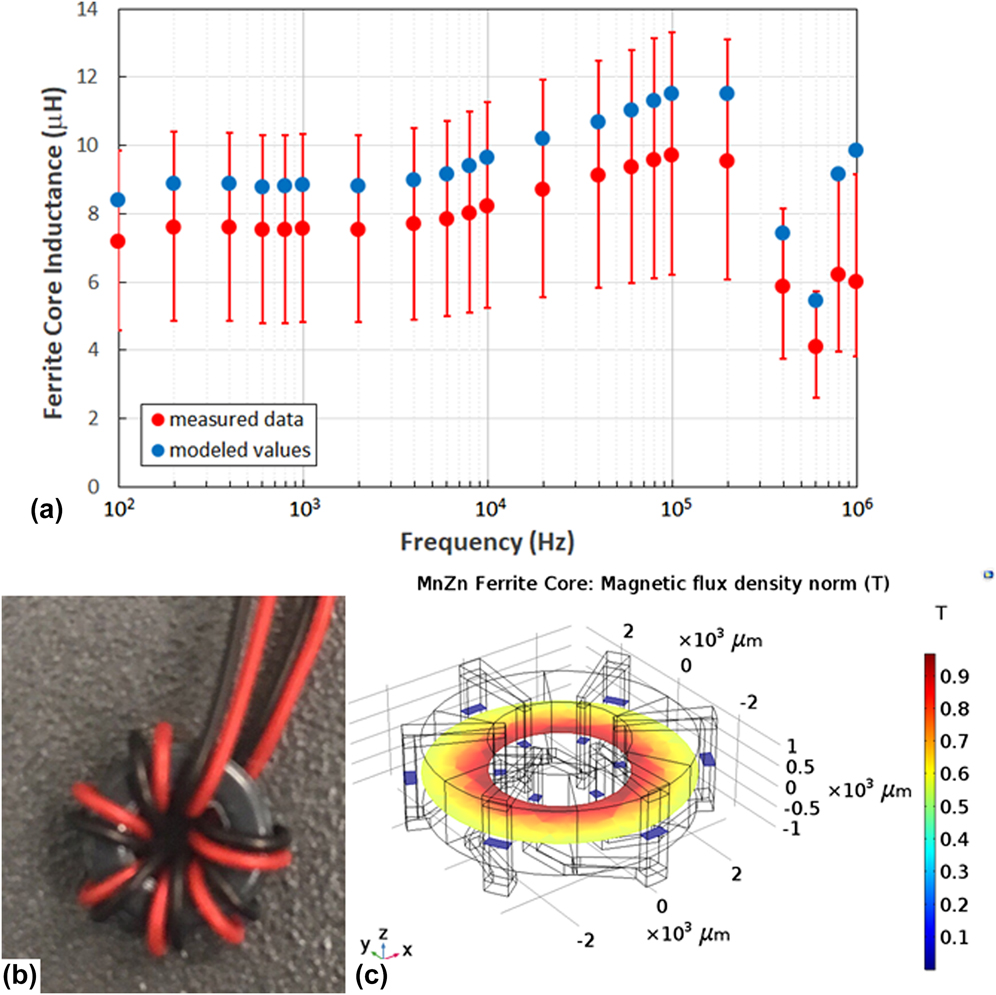
where μ′ is the real part of the relative permeability, μr, and μ″ is the imaginary part of the relative permeability that represents loss in the system. Benchmarking using a commercial MnZn ferrite toroidal core, Ferroxcube TC5.8/3.1/1/5-3B7, was used to validate the model using the above-mentioned technique. This core has a 6 mm outer diameter, a 3 mm inner diameter, and a height of 1.52 mm. 6 wire turns were used to measure values for μ′, μ″, and L on an Iwatsu B–H analyzer SY-8219. The measured values of μ′ and μ″ were inserted into the COMSOL model and used to model L. Figure 8 provides a comparison between measured values of L using the B–H analyzer and modeled values of L generated by the COMSOL model. The measured data and the modeled values for the ferrite core are close to one another with a point-to-point difference between 1.2 and 3.8 μH across the range of frequencies evaluated. While the difference between the model and the measurement may not seem small, this can be accounted for by the various uncertainties in our measurement. First, there is a manufacturing tolerance of ±0.18 mm in both the inner and outer core diameters as well as the thickness of the core. Second, upon inspection of the coil windings themselves, it appears that there are substantial air gaps between the wire windings and the ferrite core itself that were estimated to average around 0.3 mm. These gaps are a result of how small the ferrite core is and how difficult it is to keep the windings flush with the surface of the core. The model was run again with this additional average air gap and found to cause a reduction in inductance, particularly at higher frequencies, presumably to flux leakage. This error was assigned to the relative permeability, μ′, and ranged from 64 at 100 Hz to 328 at 1 MHz. Since μ′ can only get worse due to flux leakage, a skewed error distribution occurs with positive error bars being greater than negative ones. This leads to positive errors in inductance ranging from 2.6 to 3.2 μH from 100 Hz to 1 MHz and negative errors ranging from 2.6 to 2.2 μH from 100 Hz to 1 MHz. For this case, the modeled values of inductance fall within the margin of error for most of the range. With more precise core and coil dimensions and more numbers of turns afforded by microfabrication, one can assume that a better match will occur between modeling and measurement. The method used to determine the measurement uncertainty in inductance is described in the Appendix.
(a) Plot of measured inductance data versus modeled inductance values for the image of MnZn ferrite toroidal core, Ferroxcube TC5.8/3.1/1/5-3B7. (b) Image of MnZn ferrite toroidal core. (c) Plots of magnetic flux density normal for the MnZn ferrite toroidal core.

Another feature the current model lacks is a means of calculating the distributed capacitance in the coil windings themselves. This is necessary to calculate SRF to determine the operational bandwidth of the microinductors. While not included by COMSOL for coil modeling, incorporating this physics via customized equations is an advantage COMSOL has to perform this calculation. Analytical expressions for this have been used in Ref. Reference Sullivan, Li, Prabhakaran and Lu32 and will be incorporated in future model versions.
So far, the model addresses only the electromagnetic physics underlying these microinductors. Energy losses due to flux leakage to the underlying substrate and surrounding circuit elements as well as Joule heating losses are also possible by means of COMSOL’s thermomechanical multiphysics. Incorporation of these loss mechanisms will be included in future models to develop a more complete microinductor modeling solution.
Finally, significant improvements in modeled microinductor designs can be made through improvements in the magnetic performance of the iron nanocomposite material itself. At 1 A applied current, μr is around 8 for a material where J S is only 0.25 T. There is plenty of rooms available for improving both parameters in subsequent generations of iron nanocomposites. This will have a tremendous impact in terms of shrinking the size of the device even further as well as reducing the number of wire turns needed for a given value of inductance. This will have a cascade effect in terms of reducing coil resistance, both DC and AC, improving both copper loss as well as the Q value. It will also help improve both average output power as well as power density performance over frequency.
V. CONCLUSIONS
To create the next generation of switched mode power converters operating at MHz switching frequencies, smaller form factor, lower core loss, and high power density inductors are necessary. Commercially available inductors using current high-performance core materials with traditional copper wire coils are not up to the task for even board level power converter circuit architectures. The problem becomes even more intractable when considering next generation, fully integrated, monolithic, PSoCs. In this situation, it becomes infeasible to use macroscale inductors due to their form factors alone. It also negates the great reductions in size and weight of wide band-gap transistor technology that are making future converter miniaturization possible. Microinductors using next generation, low loss, nanoscale-enabled cores are a breakthrough in passive circuit elements needed toward achieving future power converter technologies. Even with the introduction of nanoscale-enabled core materials, microinductor designers must still develop sophisticated computer models that can capture most of the relevant physics involved with performance at MHz frequencies. This kind of predictive modeling will help reduce the multidimensional design space that determines device inductance and will ultimately lead to an optimized device from the standpoints of form factor, power, and manufacturability.
In this study, an overview of a model for designing microinductors using COMSOL Multiphysics FE software is given. The theory behind the various loss mechanisms and how superparamagnetic iron nanocomposite cores can eliminate them provides a path toward realizing these devices. Toroidal microinductors were simulated by modeling single coil turns and employing periodic boundary conditions for modeling an N-turn microinductor. Parametric equations were used to design the coil geometry providing a degree of design flexibility that enables the modeling of different inductances using the same design model. Designs for both a 2 μH output and a 500 nH input microinductor were created via the model for a high-performance buck converter. Both inductors had 50 wire turns, less than 1 cm3 form factors, less than 1 Ω AC resistance, and Q’s of 27 at 1 MHz. A modeled average output power of 7 W and power density of 3.9 kW/in3 are close to specification values of 8 and 100 W/in3 with the 1st generation iron nanocomposite core material. While not conclusive, these values provide confidence that these microinductors will work for their intended application. Experiments are planned to test real microinductors once they are fabricated to validate this.
One topic that has only been briefly mentioned in this paper but is of equal importance is ease of fabrication. By modeling real device geometries produced using microfabrication and other additive manufacturing processes, it allows the modeler to not only capture effects related to these geometries and generate design files, but it also provides fabrication constraints that limit designs to what is achievable by using existing or relatively mature process technologies. This will speed up the development process making the realization of these microinductors that much quicker. As discussed earlier, further improvements of the superparamagnetic iron nanocomposite core magnetic properties will help toward scaling these devices and reduce the degree of difficulty in creating features such as large core thicknesses and high numbers of wire turns. Understanding remaining loss mechanisms through advanced characterization will also help in this endeavor. Computer modeling of nanoscale-enabled microinductors will play a key role in pushing the limits of switched mode power converters even further.
Supplementary Material
To view supplementary material for this article, please visit https://doi.org/10.1557/jmr.2018.236.
ACKNOWLEDGMENTS
This project was supported by Laboratory Directed Research and Development (LDRD) Project number 17-0341. This work was performed, in part, at the Center for Integrated Nanotechnologies, an Office of Science User Facility operated for the U.S. Department of Energy (DOE) Office of Science. Sandia National Laboratories is a multimission laboratory managed and operated by National Technology and Engineering Solutions of Sandia, LLC, a wholly owned subsidiary of Honeywell International, Inc., for the U.S. Department of Energy’s National Nuclear Security Administration under contract DE-NA0003525. Special thanks to Robert E. Delaney and John O’Brien for their help with ferrite core testing.