Hypoplastic left heart syndrome is the most expensive birth defect managed in the United States; during the first hospitalization, an average child with hypoplastic left heart syndrome accumulates ∼$200,000 in direct medical charges,Reference Robbins, Bird and Tilford 1 a figure that has risen by more than 50% in the last 10 years.Reference Dean, Hillman and McHugh 2 Despite rapidly rising costs, our understanding of what drives costs for these children, and the association between changes in costs and changes in outcomes, remains limited.
Previous studies have generally described an inverse relationship between centre volume and mortality for children undergoing congenital heart surgeryReference Bazzani and Marcin 3 – Reference Welke, O'Brien and Peterson 8 and, in particular, for those undergoing higher risk procedures such as stage 1 single ventricle palliation.Reference Welke, O'Brien and Peterson 8 – Reference Pasquali, Jacobs and He 10 Limited data exist regarding the relative effects of institutional and surgeon volumes on clinical outcomes for these children.Reference Checchia, McCollegan and Daher 11 – Reference Tabbutt, Ghanayem and Ravishankar 15 To the best of our knowledge, no data exist regarding the effects of surgeon volumes on costs. This study was undertaken to elucidate the relative effects of surgeon and institutional volumes on outcomes and resource utilisation for infants with single ventricles undergoing stage 1 surgical palliation – Risk Adjustment for Congenital Heart Surgery (RACHS-1) score six – at tertiary-care paediatric hospitals in the United States.
Materials and methods
Study design
We conducted a retrospective study to determine the relative effects of surgeon and institutional volumes on hospital mortality, post-operative length of stay, and inpatient standardized direct medical costs for infants undergoing stage 1 palliation. This study was classified as non-human subjects research by the Columbia University Medical Center Institutional Review Board, under 45 CFR 46.102(f), and was exempted from further review.
Data source
Data for this study were obtained from the Pediatric Health Information System (PHIS) database, an administrative database that contains inpatient, emergency department, ambulatory surgery, and observation data from 44 not-for-profit, tertiary-care paediatric hospitals in the United States. These hospitals are affiliated with the Children’s Hospital Association (Overland Park, Kansas, United States of America). Data quality and reliability are assured through a joint effort between the Children’s Hospital Association and the participating hospitals. The data warehouse function for the PHIS database is managed by Truven Health Analytics (Ann Arbor, Michigan, United States of America). For the purposes of external benchmarking, participating hospitals provide discharge/encounter data including demographics, diagnoses, and procedures. In total, 40 of these hospitals submit billing data – including cost-to-charge ratios – to the database, allowing for the estimation of costs. All data are de-identified at the time of data submission, and the data are subjected to a number of reliability and validity checks before being included in the database.
Study population
The database was queried for all infants discharged between 1 January, 2004, and 31 December, 2013, undergoing stage 1 single ventricle palliation. Individuals were considered to have undergone stage 1 palliation based on a RACHS-1 score of six, which includes stage 1 repair of hypoplastic left heart syndrome/Norwood operation, stage 1 repair of non-hypoplastic left heart syndrome conditions, and the Damus–Kaye–Stansel procedure.Reference Jenkins, Gauvreau and Newburger 16 Patients were excluded if the procedure was performed after 90 days of age (n=9 patients). Centres performing fewer than 10 RACHS-1 risk category six procedures during the entire 9-year study period (n=1 centre) and those with >15% missing data for any pre-operative variable (n=4 centres) were excluded. Three centres submitted clinical but not charge data; these centres were excluded from cost analyses.
Outcomes
The primary outcomes were as follows: hospital mortality (not limited to 30 days), post-operative length of stay, and total inpatient standardized costs. Post-operative length of stay was defined as the total length of hospital stay after stage 1 palliation, not limited to the intensive care unit. Date of surgery was missing for two subjects (0.7%); these individuals were eliminated from the analyses of post-operative length of stay. We sought to use hospitalization costs as a surrogate for the volume of resources expended. Therefore, we used standardized costs, available through the PHIS database, to account for the high inter-hospital variability in item costs.Reference Keren, Luan and Localio 17 In brief, line-item charges and the number of billed units were tabulated for every resource in the PHIS database, classified using Truven Health Analytics’ Clinical Transaction Classification (CTC) system. The median costs were then computed per CTC code, using hospital- and department-specific cost-to-charge ratios. The charges listed in the database already adjust for costs of living by hospital location, using the Centers for Medicaid and Medicare Wage Index (http://www.cms.gov/Medicare/Medicare-Fee-for-Service-Payment/AcuteInpatientPPS/Wage-Index-Files.html). The median cost for each CTC code for each hospital was then calculated, and the medians of hospital median unit costs were used to define standardized costs. These standardized costs were used to calculate total hospitalization costs for each admission.Reference Keren, Luan and Localio 17 Costs were adjusted for inflation (to US 2013 dollars), using the Medical Consumer Price Index (http://www.bls.gov/cpi/#tables). In exploratory analyses, costs per day were also considered, calculated by dividing total inpatient hospital costs by the total length of hospital stay.
Predictors of interest
The primary predictors of interest were surgeon and institutional volumes. Surgeon volumes were defined as the total number of operations in the database performed by a provider or at an institution each year. This was used as a proxy for total case volume. The average numbers of operation performed over the entire study period, per surgeon and per institution, were also tested, with similar results. Coding methodology for surgeons in the database changed partway through our study period. Under both sets of coding, unique surgeon identifiers were used, but only using the second set of coding could these identifiers be linked to National Provider Index (NPI) numbers, allowing us to track surgeon movement across institutions within the database. Insufficient data existed to link the surgeon codes for 16.5% of patients to NPI numbers. Patients for whom there was either no coded surgeon, or for whom the billing physician performed fewer than three operations over 2 or fewer years and who could not be reliably linked to the NPI number of a cardiothoracic surgeon operating at a given institution during the study period, were considered to have missing surgeon data. These individuals were excluded from multivariable analyses (n=56, 1.9%, distributed evenly across 22 hospitals). Although the subjects were excluded, their contribution to the institutional volumes was retained. For the estimates of the number of cases performed per surgeon, a portion of the number of operations each year for whom surgeon was not defined was added to the number of operations known to have been performed by each surgeon each year. This portion was assigned proportionately to the known number of operations performed by each surgeon, at each institution. In multivariable models, including both institutional and surgeon volume, institutional volume was defined as the total, annual institutional volume less the annual volume of the operating surgeon, to account for collinearity between surgeon and institutional volumes. All but 2 institutions contributed data for the entire study period; these institutions contributed 6 and 8 years, respectively.
Data were also collected on sex, birth weight, prematurity, the presence of major non-cardiac co-morbid conditions (as previously defined by Feudtner et alReference Feudtner, Hays and Haynes 18 ), hypoplastic left heart syndrome, year of admission (to reflect surgical era), age on admission, prolonged pre-operative length of stay (>75%ile), insurance type (Medicaid versus non-Medicaid), and institution.
Missing data were rare. Data were only missing for sex (n=1, <0.1%), insurance type (n=5, 0.2%), and birth weight (n=102, 3.5%). Subjects for whom data were missing were excluded from the multivariable analyses. Neither the risk of mortality, nor post-operative length of stay, nor costs differed significantly between subjects with known versus missing sex, insurance type, or birth weight.
Data analysis
All statistical analyses were conducted in Stata software, version 13 (StataCorp, College Station, Texas, United States of America). Clinical and demographic variables were described with standard summary statistics, using means with standard deviations or medians with interquartile ranges for continuous variables, and frequencies and proportions for categorical variables. After carefully considering different transformations and assessing the relationships between surgeon and institution volumes and the outcomes of interest via non-parametric regression techniques, it was determined that, for all three outcomes of interest, both surgeon and institutional volumes were best modelled as continuous, linear, variables. For descriptive purposes, volumes were also considered as categorical variables, divided into low, medium, and high by tertile. Surgeon volume tertiles were defined as ⩽5, 5–8.7, and >8.7 cases per year; Institutional volume tertiles were defined as ⩽10, 10–19, and >19 cases per year.
To assess the magnitude of the associations between the primary predictors of interest and the measured outcomes, univariable and multivariable regression techniques were used. Logistic regression was used to estimate the relationships between the primary predictors of interest and mortality. Linear regression was used to estimate the relationships between the primary predictors of interest and the log of post-operative length of stay and the log of standardized total inpatient hospital costs. Institutional and surgeon volumes were first entered into the models in isolation, in order to assess their unadjusted effects on the measured outcomes. Co-variates for patient characteristics considered in previous studies to be significantly associated with clinical outcomes (sex, birth weight, prematurity, major co-morbid condition, dominant right ventricle, year of admission, long pre-operative time, and insurance type) were then added to these models. Finally, institutional and surgeon volumes were entered into the models jointly, along with the aforementioned patient characteristics. Model-based confidence intervals were constructed and hypothesis tests were performed using robust standard errors, with clusters corresponding to institutions.Reference Cameron and Trivedi 19 A p-value of <0.05 was considered statistically significant.
As some children undergoing stage 1 palliation die before discharge, and as neither post-operative days nor costs accrue post-mortem, standard linear regression can incompletely capture sources of variation in these two measures of resource utilization. Therefore, Tobit (censored regression) models were also fit.Reference Tobin 20 Tobit models retain information about all subjects while simultaneously accounting for the fact that the outcomes of interest are artificially truncated in subjects who die.
Uncensored models that included multi-level clustering (institution and surgeon) were also tested. Multi-level clustering had minimal effect on our standard errors. Therefore, to allow for the inclusion of censoring, clustering was included only on the highest level – institution.Reference Miglioretti and Heagerty 21 , Reference Neidell, Cohen and Furuya 22
To test the possibility that a small number of outliers might be driving our results, models were also tested, excluding first patients with costs or lengths of stay greater than the 95th percentile and then excluding surgeons and institutions with mortality rates, costs, or lengths of stay greater than the 95th percentile. Given that some patients are transferred post-operatively to other institutions and that these data do not account for mortality, costs, or hospital days accumulated after transfer, models were also tested excluding transferred patients. We also tested for interaction and effect modification.
To better understand the degree to which hospital volumes explain variation in outcomes and resource utilization between institutions, linear probability models were fit for mortality and censored linear regression models were fit for the log of post-operative length of stay and log of standardized total inpatient hospital costs, in which we included institutions as fixed effects, as well as important clinical characteristics (as above). These models were fit with and without institutional and surgeon volumes as co-variates. Gaussian kernel densities were constructed to show the relative distributions of the regression coefficients for the fixed institutional and surgeon effects from these models with and without institutional and surgeon volumes. A kernel density plot is essentially a smoothed version of a histogram. Such plots are sometimes preferred over their histogram counterparts because their construction does not depend upon a user-specified number of bins or upon the end points of those bins. Kernel density plots do require the selection of a bandwidth parameter, but can allow for easier visualisation of important features of the distribution of a variable. In our plots, we take the magnitude of the fixed effects (regression coefficients) of either the centres or surgeons from each of our multivariable models as the variables of interest.
Results
Patient, surgeon, and institutional characteristics
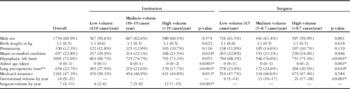
A total of 2880 infants at 35 institutions underwent stage 1 palliation during the 9-year study period. Cost data were available for 2724 individuals from 32 institutions. The median surgeon had an annual stage 1 palliation case volume of 3 procedures per year (IQR 2–6, range 1–32), and the median institution had an annual case volume of 8 procedures per year (IQR 4–14, range 1–45). The total number of procedures performed per year for the entire cohort was relatively constant across the 9-year study period. Sex, birth weight, and prematurity were similar across both institutional and surgeon volumes. Patients operated on at higher volume institutions were less likely to have major non-cardiac co-morbid conditions than those operated on at lower volume institutions (p=0.024). The prevalence of major non-cardiac co-morbid conditions did not differ by surgeon volume (p=0.946), although patients operated on by higher volume surgeons were more likely to have hypoplastic left ventricles (p<0.001). The median age on admission was 0 for all surgeon and institutional volume tertiles, but children at lower volume hospitals and children operated on by lower volume surgeons were more likely to have prolonged pre-operative lengths of stay (p<0.001 and p=0.010, respectively). Median age at operation was 6 days (IQR 4–9, 95%ile, 21 days). The proportion of patients on Medicaid insurance was also inversely associated with institutional volume (p=0.011), with a greater proportion of patients at low-volume centres covered by Medicaid than at medium- or high-volume centres (p=0.001 and p<0.001, respectively). There was no difference in Medicaid coverage by surgeon volume. More detailed patient characteristics are described in Tables 1 and 2.
Patient characteristics overall and by institution and surgeon volumes (n=2889).

Values are n (%), mean±SD, or median (IQR). Volumes are divided by tertile into low, medium, and high. p-values reflect associations with volumes, when volumes are considered as continuous variables
** Long pre-operative time is defined as >75%ile (>9 days)
*p<0.05
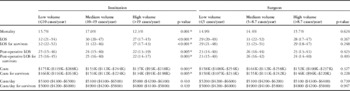
Unadjusted mortality, lengths of stay, and costs, by institution and surgeon volume tertiles.

LOS=length of stay
Values are percentages or medians (IQRs). Volumes are divided by tertile into low, medium, and high. All costs are reported in 2013 dollars
p-values reflect associations with volumes, when volumes are considered as continuous variables, clustering standard errors on institution
*p<0.05
Mortality
Overall mortality was 15.0% (n=432). In unadjusted analyses, for every 10 additional stage 1 palliation procedure performed per institution per year, the odds of mortality decreased by 16% (95% CI 6–24%; p=0.001). A similar effect was observed after adjusting for patient characteristics (18% decrease, 95% CI 10–26%; p<0.001). Surgeon volumes were not themselves significantly associated with the odds of mortality in either unadjusted or adjusted analyses. These results were insensitive to the presence of outliers or transferred patients. There was an interaction between the effects of surgeon and centre volumes, with slightly greater centre volume effects observed among higher volume surgeons.
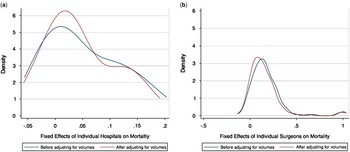
There was marked variation in mortality observed between institutions and between surgeons. Mortality rates per institution ranged from 7.2 to 29.6% (5th and 95th percentiles). Mortality rates per surgeon ranged from 0.0 to 40.0% (5th and 95th percentiles). This variation was similar before and after adjusting for either institutional or surgeon volumes. See Figure 1.
The effects of volumes on the variation in mortality between institutions and between surgeons: Kernel density plots graphically display differences in the distribution of hospital ( a ) and surgeon ( b ) fixed effects on mortality of infants undergoing stage 1 palliation. Blue lines show the distribution of fixed effects before adjusting multivariable models for institutional or surgeon volumes. Red lines show the distribution of fixed effects before adjusting multivariable models for institutional or surgeon volumes. Neither the variation between institutions nor the variation between surgeons changed substantially after adjusting for volumes.

Post-operative length of stay
The median overall length of stay was 30 days (IQR 19–50), with a median post-operative length of stay of 24 days (IQR 14–41). Both total length of stay and post-operative length of stay were significantly longer for survivors (medians 30 and 24 days, respectively) than for those patients who died before discharge (medians 27 and 18 days, respectively; p=0.002 and p<0.001). Surgeon volume was not associated with post-operative length of stay in either unadjusted or adjusted analyses.
In unadjusted analyses, for every 10 additional stage 1 palliation procedures performed per institution per year, the post-operative length of stay decreased by 8% (95% CI 3–13%; p=0.005). The magnitude of the association between institutional volume and post-operative length of stay was similar after adjusting for patient characteristics and surgeon volumes and after censoring for death. In the adjusted analyses, for every 10 additional stage 1 palliation procedures performed per institution per year, the post-operative length of stay decreased by 11% (95% CI 4–18%; p=0.004). These results were insensitive to the presence of outliers or transferred patients. There was no significant interaction between the effects of centre and surgeon volumes on post-operative length of stay.
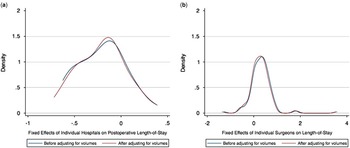
There was marked variation in post-operative length of stay observed between institutions and between surgeons. Median post-operative length of stay per institution ranged from 16 to 39 days (5th and 95th percentiles). Median post-operative length of stay per surgeon ranged from 12 and 49 days (5th and 95th percentiles). This variation was similar before and after adjusting for either institutional or surgeon volumes. See Figure 2.
The effects of volumes on the variation in post-operative length of stay between institutions and between surgeons: Kernel density plots graphically display differences in the distribution of hospital ( a ) and surgeon ( b ) fixed effects on post-operative length of stay for infants undergoing stage 1 palliation. Blue lines show the distribution of fixed effects before adjusting multivariable models for institutional or surgeon volumes. Red lines show the distribution of fixed effects before adjusting multivariable models for institutional or surgeon volumes. Neither the variation between institutions nor the variation between surgeons changed substantially after adjusting for volumes.

Costs
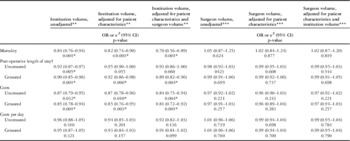
Median total, adjusted standardized costs per patient were $156,000 (IQR $108,000–$248,000), in 2013 dollars. In unadjusted analyses, for every 10 additional stage 1 palliation procedures performed per institution per year, the total hospital costs decreased by 13% (5–21%; p=0.003). The magnitude of this association was similar after adjusting for patient characteristics. The point estimates for the magnitude of the association was slightly more pronounced after adjusting for surgeon volume (16%, 95% CI 6–25%; p=0.004) and censoring for death (19%, 95% CI 8–28%; p=0.001). Surgeon volume was not significantly associated with hospital costs in either unadjusted or adjusted analyses. See Table 3. These results were insensitive to the presence of outliers or transferred patients. There was no significant interaction between the effects of centre and surgeon volumes on costs.
The relative effects of surgeon and institutional volumes on mortality, post-operative length of stay, and costs.

Models for mortality were constructed using logistic regression, clustering standard errors on institution; odds ratios (OR) are presented
Models for length of stay and costs were constructed using linear or censored linear regression, clustering standard errors on institution. Models were built using the natural log of length of stay and standardized costs, adjusted to 2013 dollars; for ease of interpretation, back-transformed coefficients (eβ) are presented
** Institution volume was considered as a continuous variable, with units of 10 operations per year
*** Surgeon volume was considered as a continuous variable, with units of 5 operations per year
*p<0.05
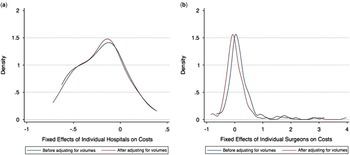
There was marked variation in total hospital costs observed between institutions and between surgeons. Median hospital costs per institution ranged from $111,000 to $292,000 (5th and 95th percentiles). Median hospital costs per surgeon ranged from $97,000 to $416,000 (5th and 95th percentiles). This variation also was similar before and after adjusting for either institutional or surgeon volumes. See Figure 3.
The effects of volumes on the variation in total inpatient hospital costs between institutions and between surgeons: Kernel density plots graphically display differences in the distribution of hospital ( a ) and surgeon ( b ) fixed effects on costs for infants undergoing stage 1 palliation. Blue lines show the distribution of fixed effects before adjusting multivariable models for institutional or surgeon volumes. Red lines show the distribution of fixed effects before adjusting multivariable models for institutional or surgeon volumes. Neither the variation between institutions nor the variation between surgeons changed substantially after adjusting for volumes.

Discussion
In this retrospective study of almost 3000 infants undergoing stage 1 palliation at tertiary-care paediatric hospitals, we found that institutional volume was inversely associated with mortality, post-operative length of stay, and costs, but that surgeon volume was not. We further found that neither institutional nor surgeon volumes explained much of the wide variation in outcomes and resource utilization that exists between institutions and between surgeons.
Institutional volume has consistently been shown to be inversely associated with mortality after congenital heart surgery, particularly for the most complex procedures.Reference Bazzani and Marcin 3 – Reference Pasquali, Jacobs and He 10 It stands to reason that there might also be institutional economies of scale and other improvements in efficiency that result in shorter lengths of stay and reduced costs for these institutions. Exploratory analyses of costs per day suggest that the majority of cost savings is derived from the shortened hospital stays.
Under a practice-makes-perfect theory, it has often been hypothesized that patients of higher volume surgeons have better clinical outcomes and require fewer resources. Our findings do not support this hypothesis. The effects of individual surgeon volume vis-à-vis institutional volume for stage 1 palliation in our study might make sense when considered in light of the physiological effect of this operation. Procedures such as the arterial switch and interrupted aortic arch repair are operations that restore normal physiology if performed correctly. On the other hand, even a perfectly executed stage 1 palliation is vulnerable to post-operative changes (both iatrogenic and physiologic) that might impact outcomes more than the, admittedly necessary, perfect technical execution of a stage 1 repair. Consequently, institutional factors such as the breadth of experience of nurses and cardiac intensivists might come to play in more significant ways for stage 1 palliation than for other biventricular repairs, where surgical expertise and volume might exhibit comparatively larger roles in determining outcomes.
The existing literature on the surgeon volume to mortality relationship for stage 1 palliation is somewhat inconsistent. In 2012, using The Society of Thoracic Surgeons-Congenital Heart Surgery Database, Hornik et alReference Hornik, He and Jacobs 13 found an inverse association between surgeon volume and mortality for neonates with single ventricles undergoing the Norwood operation. Other studies have found no such association. In 2005, Checchia et al,Reference Checchia, McCollegan and Daher 11 using the PHIS database, found no association between surgeon volumes and outcomes in the late 1990s (1998–2001). In 2010, Karamlou et al, using a data set derived from Congenital Heart Surgeons Society multi-institutional studies, found significant associations between surgeon volumes and mortality for infants with either transposition of the great arteries or interrupted aortic arch, but no significant association between surgeon volumes and mortality for children with single ventricles undergoing stage 1 palliation.Reference Karamlou, McCrindle and Blackstone 14 Finally, in 2012, Tabbutt et alReference Tabbutt, Ghanayem and Ravishankar 15 , in a secondary analysis of the Single Ventricle Reconstruction Trial (a prospective randomised trial assessing the effects of shunt type on stage 1 palliation outcomes), found that, while surgeon volume was significantly associated with mortality in univariable analyses, it was not associated with mortality after adjusting for institutional volume. There are no previous data regarding the effects of surgeon volume on resource utilisation.
One of the concerns of using administrative data for this type of study is that one is only able to control for a limited set of patient characteristics. Details on anatomical complexity are typically not available. We, therefore, conducted extensive secondary analyses to assess the possibility of incomplete risk adjustment. More specifically, we wanted to assess the possibility that higher volume surgeons might routinely select (or be assigned) more challenging cases, whose differences are not captured by the variables available in the PHIS database; failure to adjust for these differences could make the outcomes of surgeons performing these more complex cases appear worse than their peers. Our analyses suggest that it is unlikely that unmeasured differences in surgeon-specific case-mix exert significant effects on our results. First, when adding incrementally all of the patient characteristics measurable within the data set, minimal change was seen in the point estimates for the magnitude of the associations between volumes and any of the measured outcomes. Second, in exploratory analyses, individual surgeons were added as fixed effects to our models, which also generated minimal change in the point estimates for the effects of institutional and surgeon volume on outcomes (data not shown). This statistical technique controls for unmeasured differences in surgeon-specific case-mix not included in the measured covariates. Third, the addition of surgeon volumes to our models explained almost none of the wide variation observed between surgeons.
The PHIS database, the Congenital Heart Surgeons Society data set, and the Single Ventricle Reconstruction Trial include primarily tertiary-care paediatric hospitals. In contrast, The Society of Thoracic Surgeons-Congenital Heart Surgery Database also captures data from non-tertiary-care centres. We hypothesize, therefore, that the differences in the existing literature might be the result of differences in the individual institutions captured within the databases rather than differences in database structure, as has been previously hypothesized. Although surgeon volumes might predict outcomes for some procedures at some institutions, they might be less important than differences in peri-operative care for children at tertiary-care children’s hospitals undergoing stage 1 palliation.
Also, of note, repeating our analyses using methodology similar to that employed by Hornik et al, and including only patients operated during or before 2009 (as was done in their study), resulted in point estimates for the magnitude of the coefficients for surgeon volumes that were similar to those in their (although, in our data, these estimates still did not meet statistical significance). This raises the possibility that surgeon volume might have been a more important factor for children undergoing stage 1 palliation in a previous era, with institutional factors taking precedence as cumulative experience with this procedure has grown.
Conclusions
In summary, increased institutional – but not surgeon – volumes are associated with reduced mortality, post-operative length of stay, and costs for infants undergoing stage 1 palliation at tertiary-care paediatric hospitals. Neither significantly explains the wide variation in both clinical outcomes and resource utilisation between institutions and between surgeons. As we strive to improve care for this high-risk population, further investigations are needed to determine more accurate markers of quality and to identify appropriate targets for future improvement.
Acknowledgements
None.
Financial Support
Dr Anderson received grant support for this study from the Andrew King Research Award from Colin’s Kids, Inc. This publication was also supported by the National Center for Advancing Translational Sciences, National Institutes of Health, through Grant Number UL1 TR000040, formerly the National Center for Research Resources, Grant Number UL1 RR024156. The content is the sole responsibility of the authors and does not necessarily reflect the official views of Colin’s Kids or the NIH.
Conflicts of Interest
None.