


Introduction
Glaciers were discovered in the Polar Ural Mountains in the late 1920s and immediately provoked a sensation. Many scientists could not believe the Polar Urals could support glaciers, because of their low elevations and continental climate. Subsequent studies suggested why glaciers existed in the Polar Urals. Snow precipitation rates are lower than ablation rates over most of the region, making it unlikely that snow precipitation contributes directly to accumulation. However, persistent strong winds during the cold season result in snow redistribution and its local accumulation in amounts exceeding snowfall by as much as 1.5–2 times (Reference KhodakovKhodakov, 1964).
After Polar Ural glaciers were discovered, the question was raised of whether they were the relict degraded fragments of larger Pleistocene ice masses or whether they had developed more recently, for example during the ‘Little Ice Age’. Until recently, this question has remained largely unanswered. To answer it, the glacial history of the area needs to be known. Since glacier mass balance has only been measured on a few glaciers in the area between 1957 and 1981, proxy data are required to reconstruct the longterm glacial history of the region. Fortunately, two main sets of proxy data are available: (1) climate data extending back to the late 19th century; and (2) tree-ring data extending back to the 9th century.
The main aims of this paper are two-fold: first, to establish statistical relationships between glacier mass balance and climate and to use these to extend the glacier mass-balance record back through the 20th century; second, to develop statistical relationships between tree-ring and climate data in order to stretch the glacier mass-balance record back through the last millennium.
The Study Region
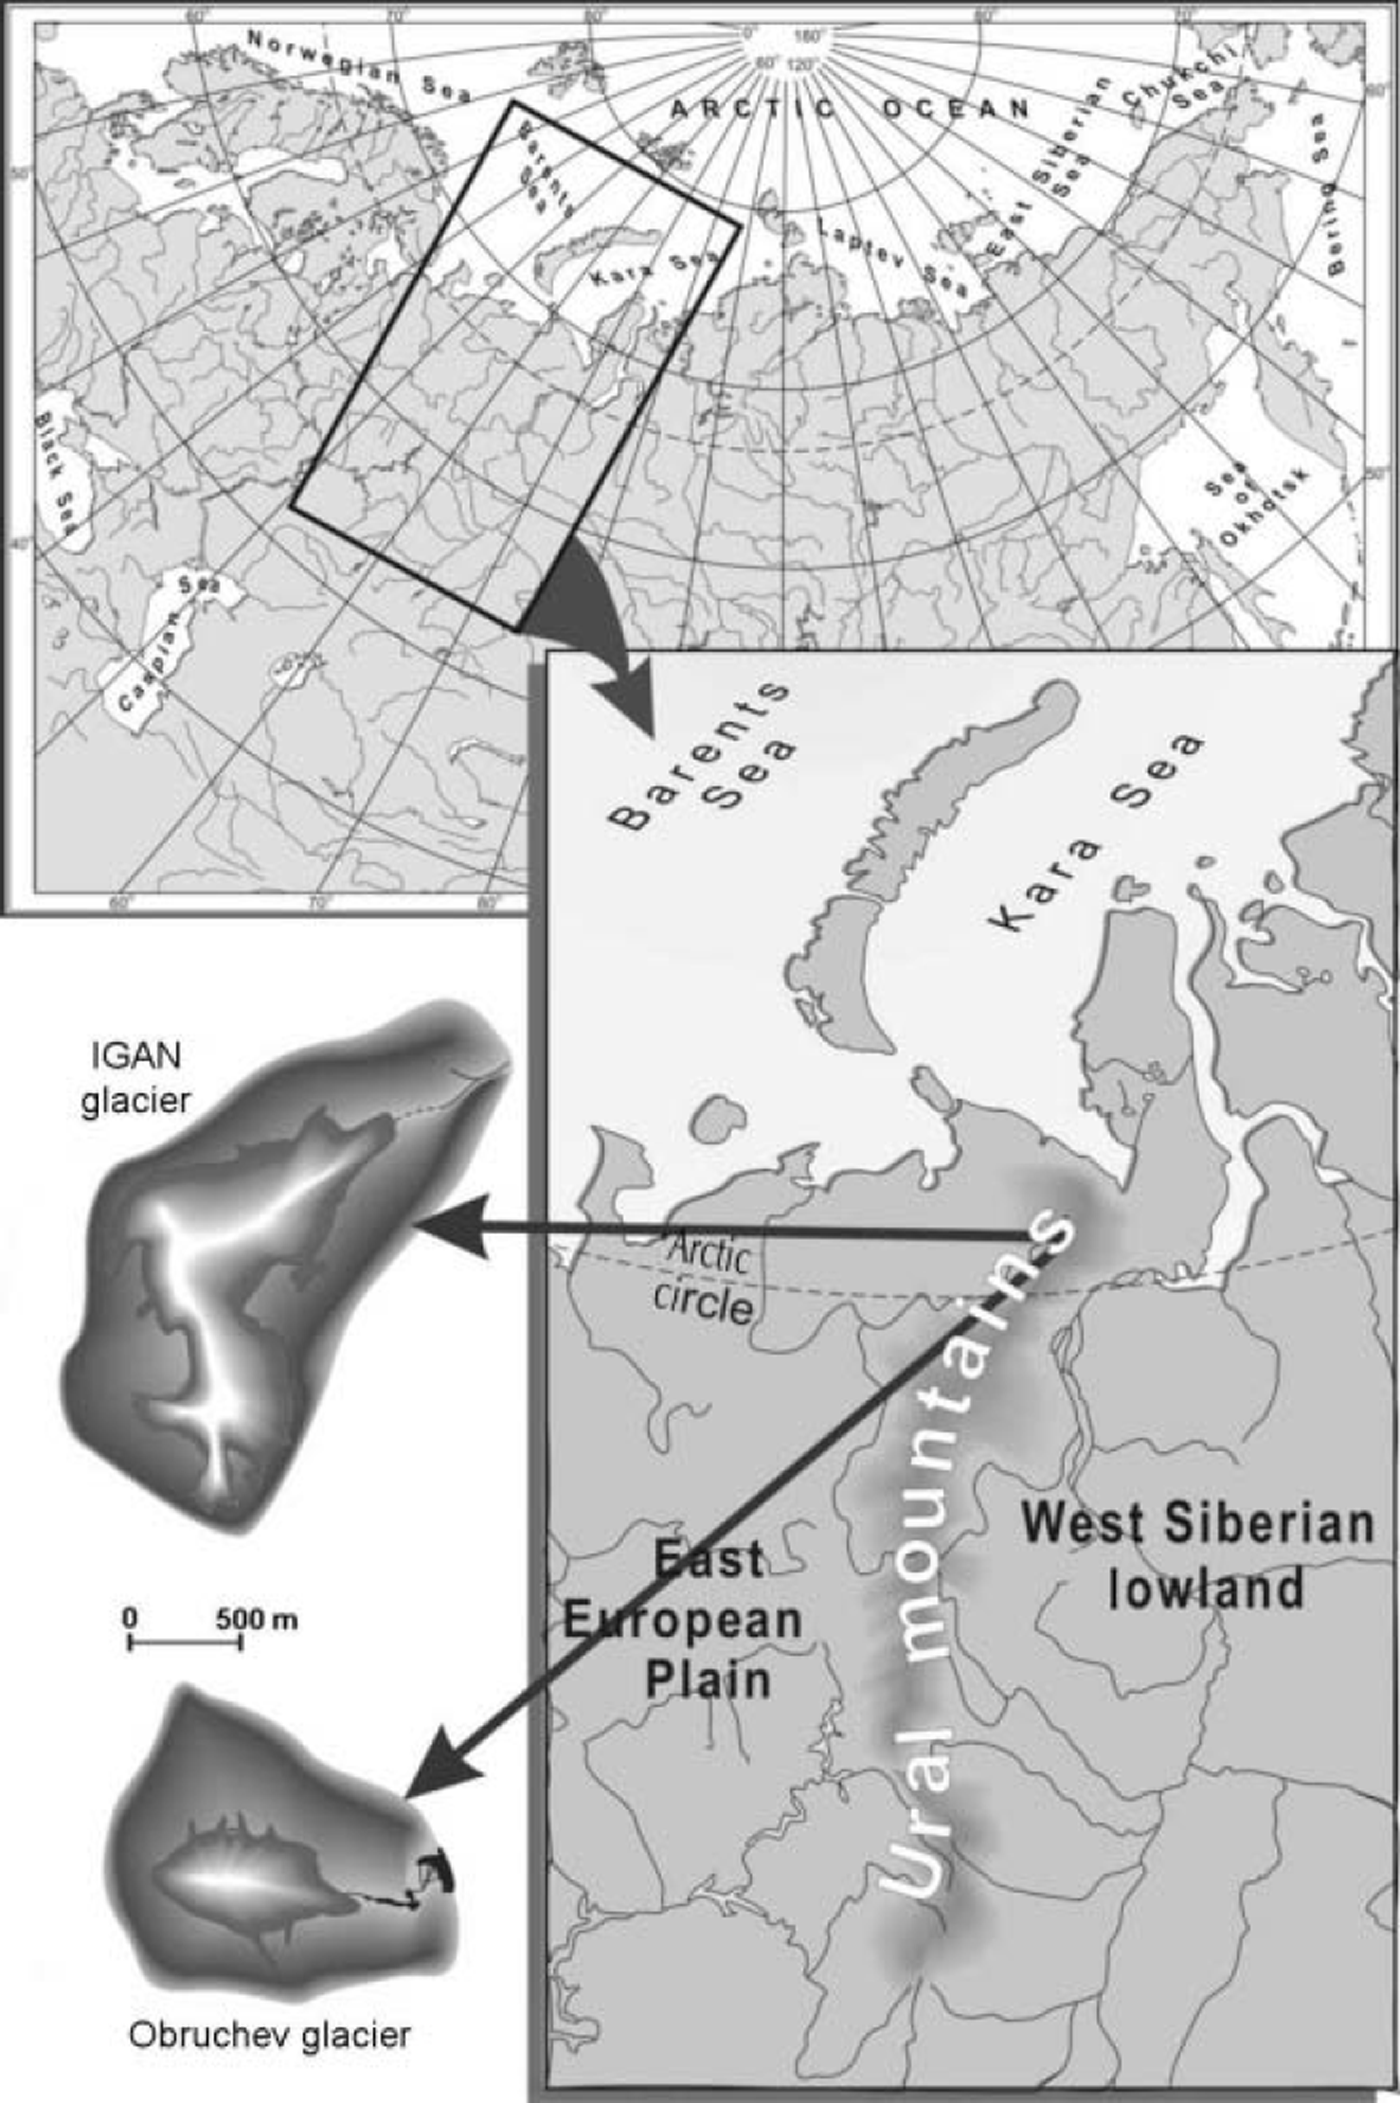
The Ural Mountains are a 2000 km long, north–south-aligned mountain chain between the Russian Plain and the West Siberian lowlands (Fig. 1). The northern part of the chain (north of the Arctic Circle) is known as the Polar Urals. There are up to 143 glaciers in the region, covering a total area of 28 km2 (Reference VinogradovVinogradov, 1978). Most glaciers are smaller than 1km2. Measurements in 1958–60 showed only two glaciers were larger than this: MGU glacier (1.16 km2) and IGAN glacier (1.25 km2).
The region of study.
Winters are remarkably severe: temperatures drop as low as –50˚C in the north, and mean January temperatures are –16˚C in the foothills and –22˚C and lower in the mountains. Winter lasts 4–9 months. In summer, it is cooler in the mountains (mean July temperature is <8˚C) than at the same latitude in the neighbouring foothills. Annual precipitation in the mountains almost everywhere exceeds 550– 600 mm. The western slopes face the humid air masses and receive more precipitation than the eastern slopes, the difference reaching 200 mma–1.
Westerly synoptic winds prevail in the winter, whereas northwesterly and northerly winds dominate in the summer. These are also the directions of the strongest winds. Storm winds sometimes reach speeds of 40–50 m s–1, mostly during the winter. Furthermore, local valley-scale winds can often be observed under high-pressure conditions and low temperatures during the winter. At that time, wind speeds can reach 15–20 ms–1 in the valleys, in contrast to calm conditions on the adjacent plateaus. Strong winds, of mainly westerly direction, cause extensive snow redistribution within the mountains and its accumulation on windward slopes and depressions. This feature allows many glaciers to exist in the Polar Urals (Reference Troitskiy, Avsyuk and KemmerikhTroitskiy and others, 1966).
Mass-balance studies were carried out in the Polar Urals between 1957 and 1981, IGAN and Obruchev glaciers being under continuous observation throughout the period. These two glaciers were chosen as representative on the basis of large-scale glaciological observations performed on many glaciers in the region between 1958 and 1963 (Reference Troitskiy, Avsyuk and KemmerikhTroitskiy and others, 1966). The glaciers are located within the most heavily glacierized zone, north of the Arctic Circle and at a distance of 150-200 km from the Arctic Ocean (Fig. 1). A description of the glaciers based on observations made between 1958 and 1961 is given below (Reference TroitskiyTroitskiy, 1962).
IGAN glacier, the largest in the region, is situated on the eastern slope of the 1245 m Khar-Naurdy-Keu peak. The glacier length is ∼1.5 km, its area is ∼1.25 km2, it faces east-northeast and it lies between 830 and 1270ma.s.l. The slope of the glacier surface varies from ∼35˚ in the upper zone to 8-12˚ in the middle and 12-15˚ in the lower part. Mountain peaks rise >200m above the upper and middle sections of the glacier. High lateral and terminal ice-cored moraine ridges surround the lower part. The lateral moraines are 20–40 m high and 100 m wide at the base. Beyond the ice-tongue limits, they merge and form a large terminal moraine ridge about 400 m long. The open ice ends in a small lake 150-200 m wide.
Obruchev glacier is located in a typical deep, 1.5 km diameter glacial cirque facing east-southeast. The cirque walls rise steeply as high as 500 m above the glacier surface, the back (western) wall being 200 m lower than the southern and northern walls. The latter borders a small plateau (1075 ma.s.l.). Obruchev glacier is one of the lowest glaciers in the Urals, with an altitude range of 390-660 m. It is ∼1.0 km long with a maximum width of ∼500 m. A steep frontal part of the glacier gradually passes upwards into a more gently sloping (4-7˚) central part. Within the firn basin, the surface slope varies from 12-15˚ in the bottom part to 30-35˚ near the walls. The northeastern part of the glacier is hidden under a lateral moraine ridge 40 m high and 600 m long. Radio-echo soundings in 1974 and 1976 showed the mean glacier thickness was 64 m, and the maximum was 120 m (Reference Macheret and ZhuravlevMacheret and Zhuravlev, 1981).
Data
Mass-balance data
The mass balance of IGAN and Obruchev glaciers was measured between 1957 and 1981 using the glaciological method. For each glacier, measurements were made along one longitudinal profile and four or five transverse profiles. The number of measurements varied between years from 20 to 50 stakes. Spring-summer snow/firn refreezing, calculated from borehole thermistor data (Reference TsykinTsykin, 1962; Reference Troitskiy, Avsyuk and KemmerikhTroitskiy and others, 1966) was assumed to equal 0.20 mw.e. for IGAN glacier and 0.15 mw.e. for Obruchev glacier. Annual net balance b n was obtained as the sum of winter balance bw and summer balance bs, which were measured annually at the end of the cold and warm seasons respectively. A high correlation between the bw data of IGAN and Obruchev glaciers (R = 0.86) allowed this parameter to be reconstructed for one glacier when data were missing for the other. Values of bs were reconstructed in the same way when necessary, as there was a high correlation between the bs data of the two glaciers too (R = 0.89) (Reference VoloshinaVoloshina, 1987).
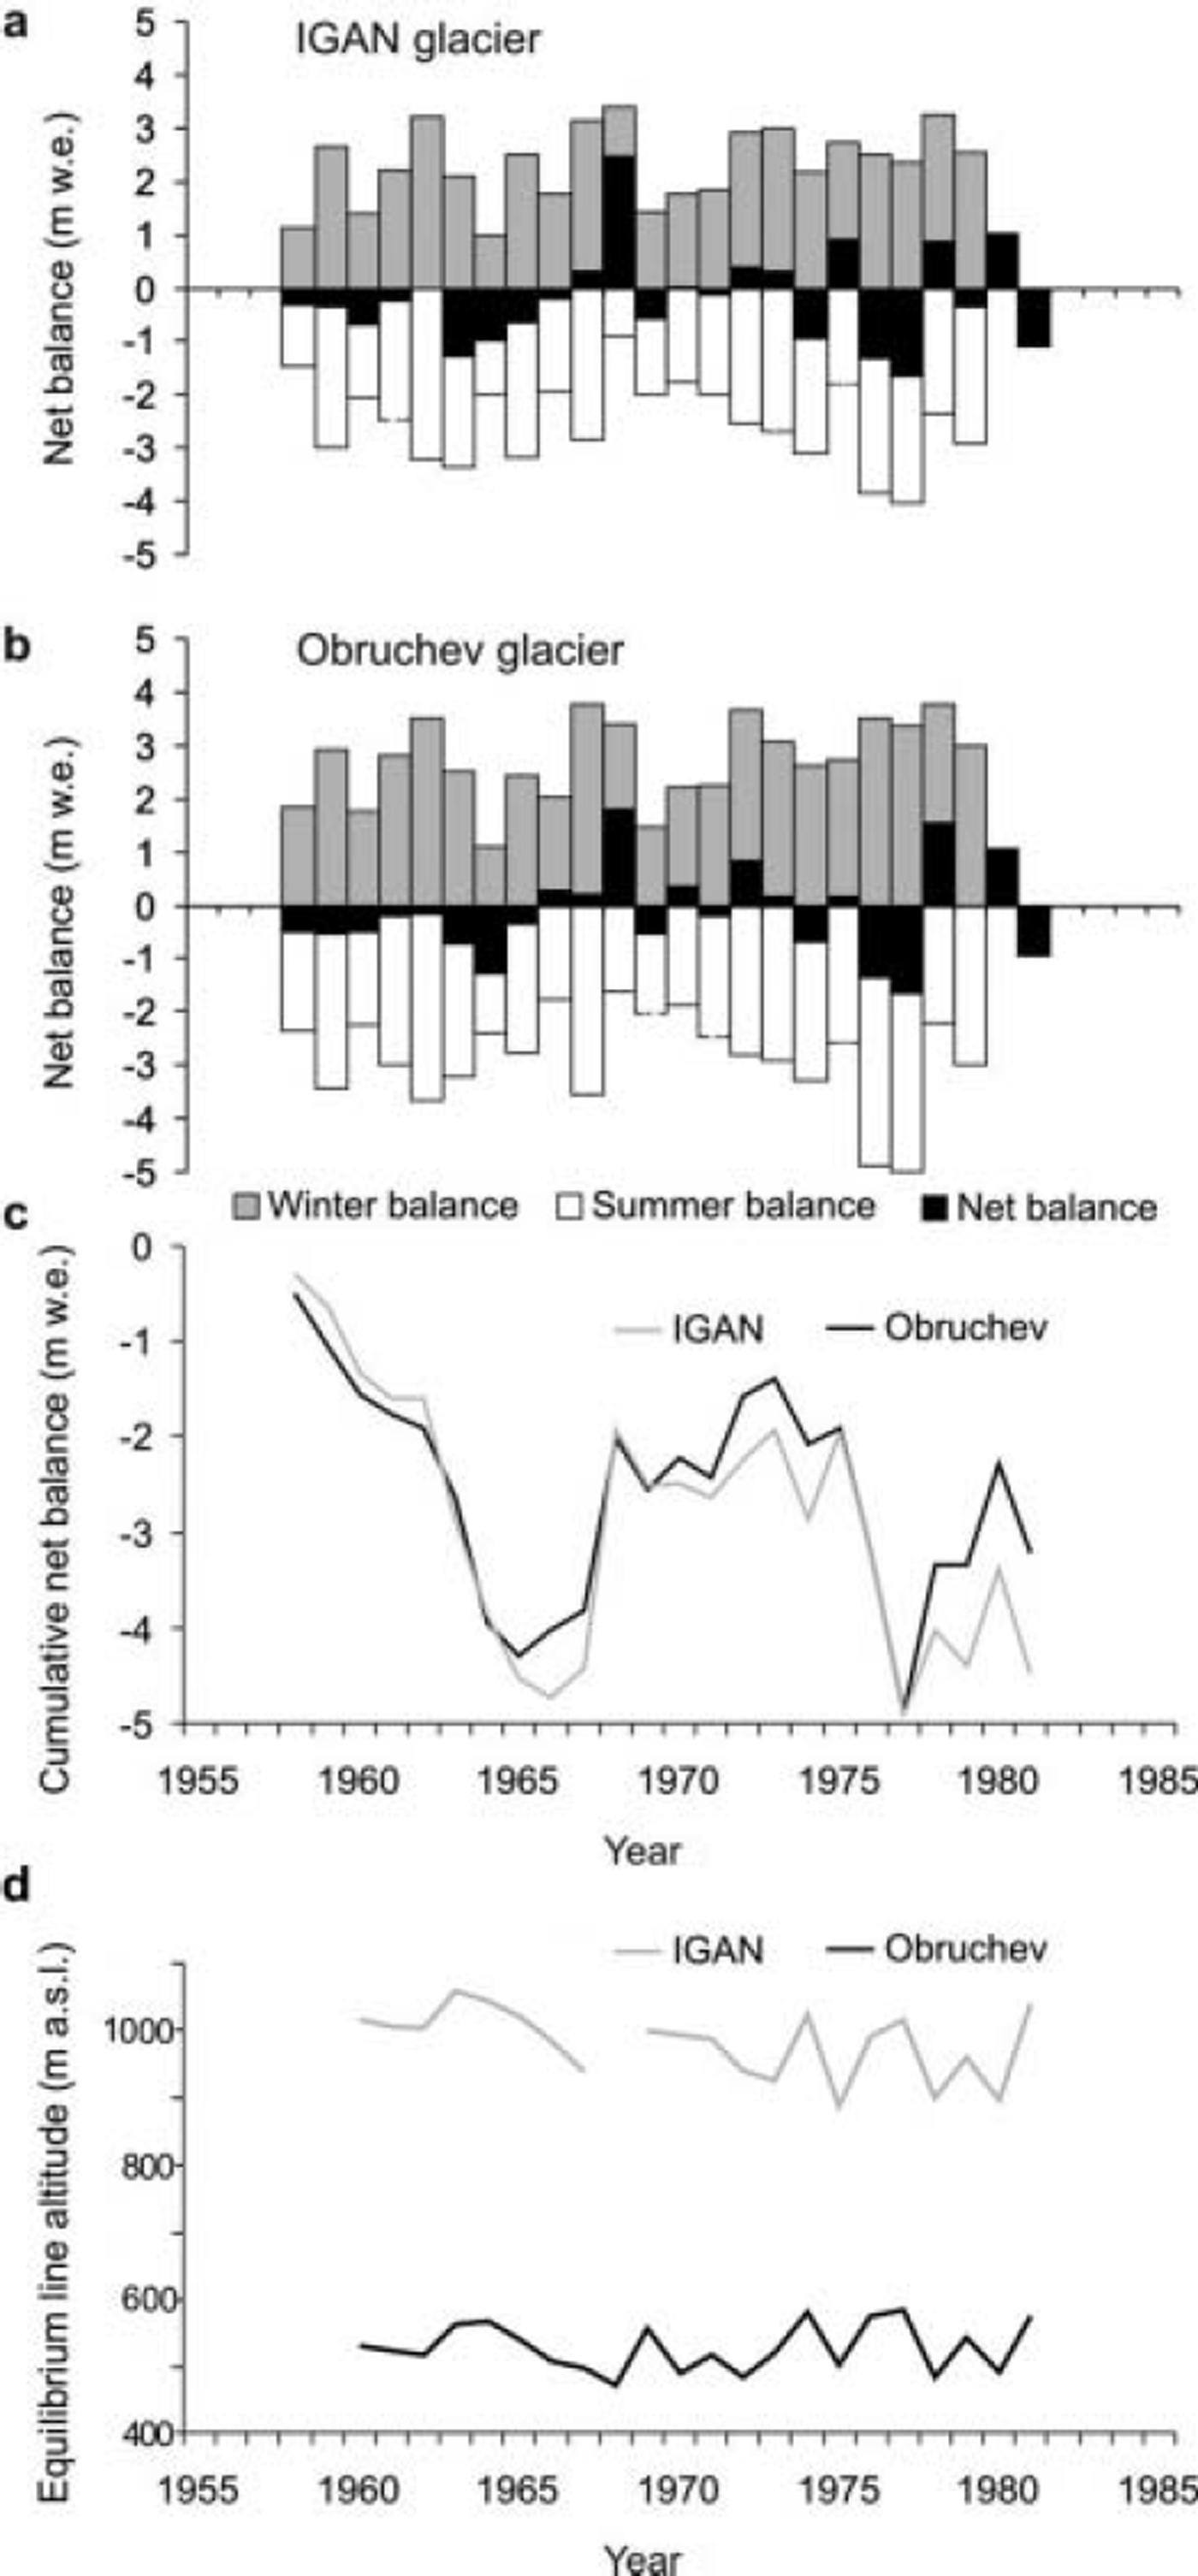
During the entire period of continuous observation, the mass-balance components of the two glaciers showed significant variations (Fig. 2). Judging from the equilibriumline altitudes at the end of the balance year, their variations cover a major part of the altitude intervals occupied by the glaciers. Accordingly, in the extreme cases, the glaciers remain covered with snow for the entire year (highly positive mass balance) or the seasonal snow is removed almost completely (highly negative mass balance).
(a, b) Winter, summer and net balances of IGAN (a) and Obruchev (b) glaciers, and (c, d) cumulative net balances (c) and equilibrium-line altitudes (d) of the two glaciers, according to direct measurements, 1957–81 for (a–c) and 1960–81 for (d).
Meteorological data
Monthly air-temperature and precipitation data were obtained from weather stations located close to the Polar Urals, supplemented as necessary by gridded (2.5˚) US National Oceanic and Atmospheric Administration/US National Centers for Environmental Prediction (NOAA/NCEP) reanalysis data. The re-analysis data are essentially modelling results, and are therefore not entirely reliable for our purposes. Furthermore, they are only available for the period 1950-2000.
The most representative weather station for the region is Bolshaya Khadata, located about 1 km from IGAN glacier. Although its observation period was short (1957-63), the records are in very good agreement with those of two other stations, Vorkuta and Salekhard, located respectively 80 km east and 110km southeast of the glacier. The Salekhard weather station has the longest and most complete observation record. Thus, we use the monthly average air-temperature records and precipitation sums from this weather station, which extend back to 1883 and 1892 respectively. Records from the other stations (supplemented by the re-analysis data) served to fill the few gaps in the observations.
Dendrochronology data
Tree rings provide useful proxy climate data that can extend climate records back hundreds of years. For trees growing near the limits of their range, climate exerts a particularly important control on tree-ring width. Thus, all trees in a particular region show the same tree-ring width variations, which may be used to infer variations in summer and winter climate. Tree-ring width is usually most strongly correlated with summer temperature and, more rarely, with cold-season precipitation (e.g. Reference Briffa, Jones, Schweingruber, Karlén, Shiyatov, Jones, Bradley and JouzelBriffa and others, 1996). Thus, tree-ring chronologies may be used as a basis for reconstructing the long-term glacier mass balance, provided robust relationships between tree-ring characteristics, summer and winter climate and summer and winter mass balance can be established. In this respect, it is important to have data on tree-ring width measured separately for early and late wood. Early wood forms at the beginning of the summer (during snowmelting) and is used to transfer moisture from the ground to the treetop. This wood contains wide vertical pores, making it less dense and lighter-colored. Early-wood ring width should be directly related to the precipitation during the previous accumulation period. Denser thin, porous and dark-colored wood grows towards the end of the summer and is responsible for strengthening the tree. Since this wood grows in summer, late-wood ring width should be related to ablation period temperature.
A number of tree-ring chronologies from several hundred to >1000 years long have been compiled for the Polar Urals (Reference ShiyatovShiyatov, 1986; Hantemirov and Surkov, 1996; Reference Shiyatov, Hantemirov, Schweingruber, Briffa and MoellShiyatov and others, 1996). Empirical data of some chronologies can be found in the World Tree-Ring Data Bank (www.ncdc.noaa.gov/paleo/treering.html). In our study, we used the tree-ring dataset for Larix Sibirica compiled by F. Schweingruber. The dataset spans the period AD 778–1990 and contains a wide assortment of data, including tree-ring width measurements for individual trees. Individual chronologies thus obtained may be combined into a general chronology, which may be processed statistically using indexation/standardization procedures that are most suitable for a particular task.
Mass-Balance Reconstruction
To reconstruct b n for periods when no direct mass-balance measurements were made, we performed statistical computations aimed at finding dependence between mass-balance components and climatic variables (Fig. 3). Numerous glaciological studies (e.g. Reference Khodakov and AvsyukKhodakov, 1965; Reference BraithwaiteBraithwaite, 1981; Reference KrenkeKrenke, 1982) suggest that ablation is strongly correlated with summer air temperature (T s), while accumulation depends directly on total solid precipitation (P sol).
Correlation between (a) summer balance and air temperature and (b) winter balance and precipitation. Grey bars indicate monthly values, and black bars show (a) air temperature averaged over period with highest correlation, and (b) precipitation sum for the same period.

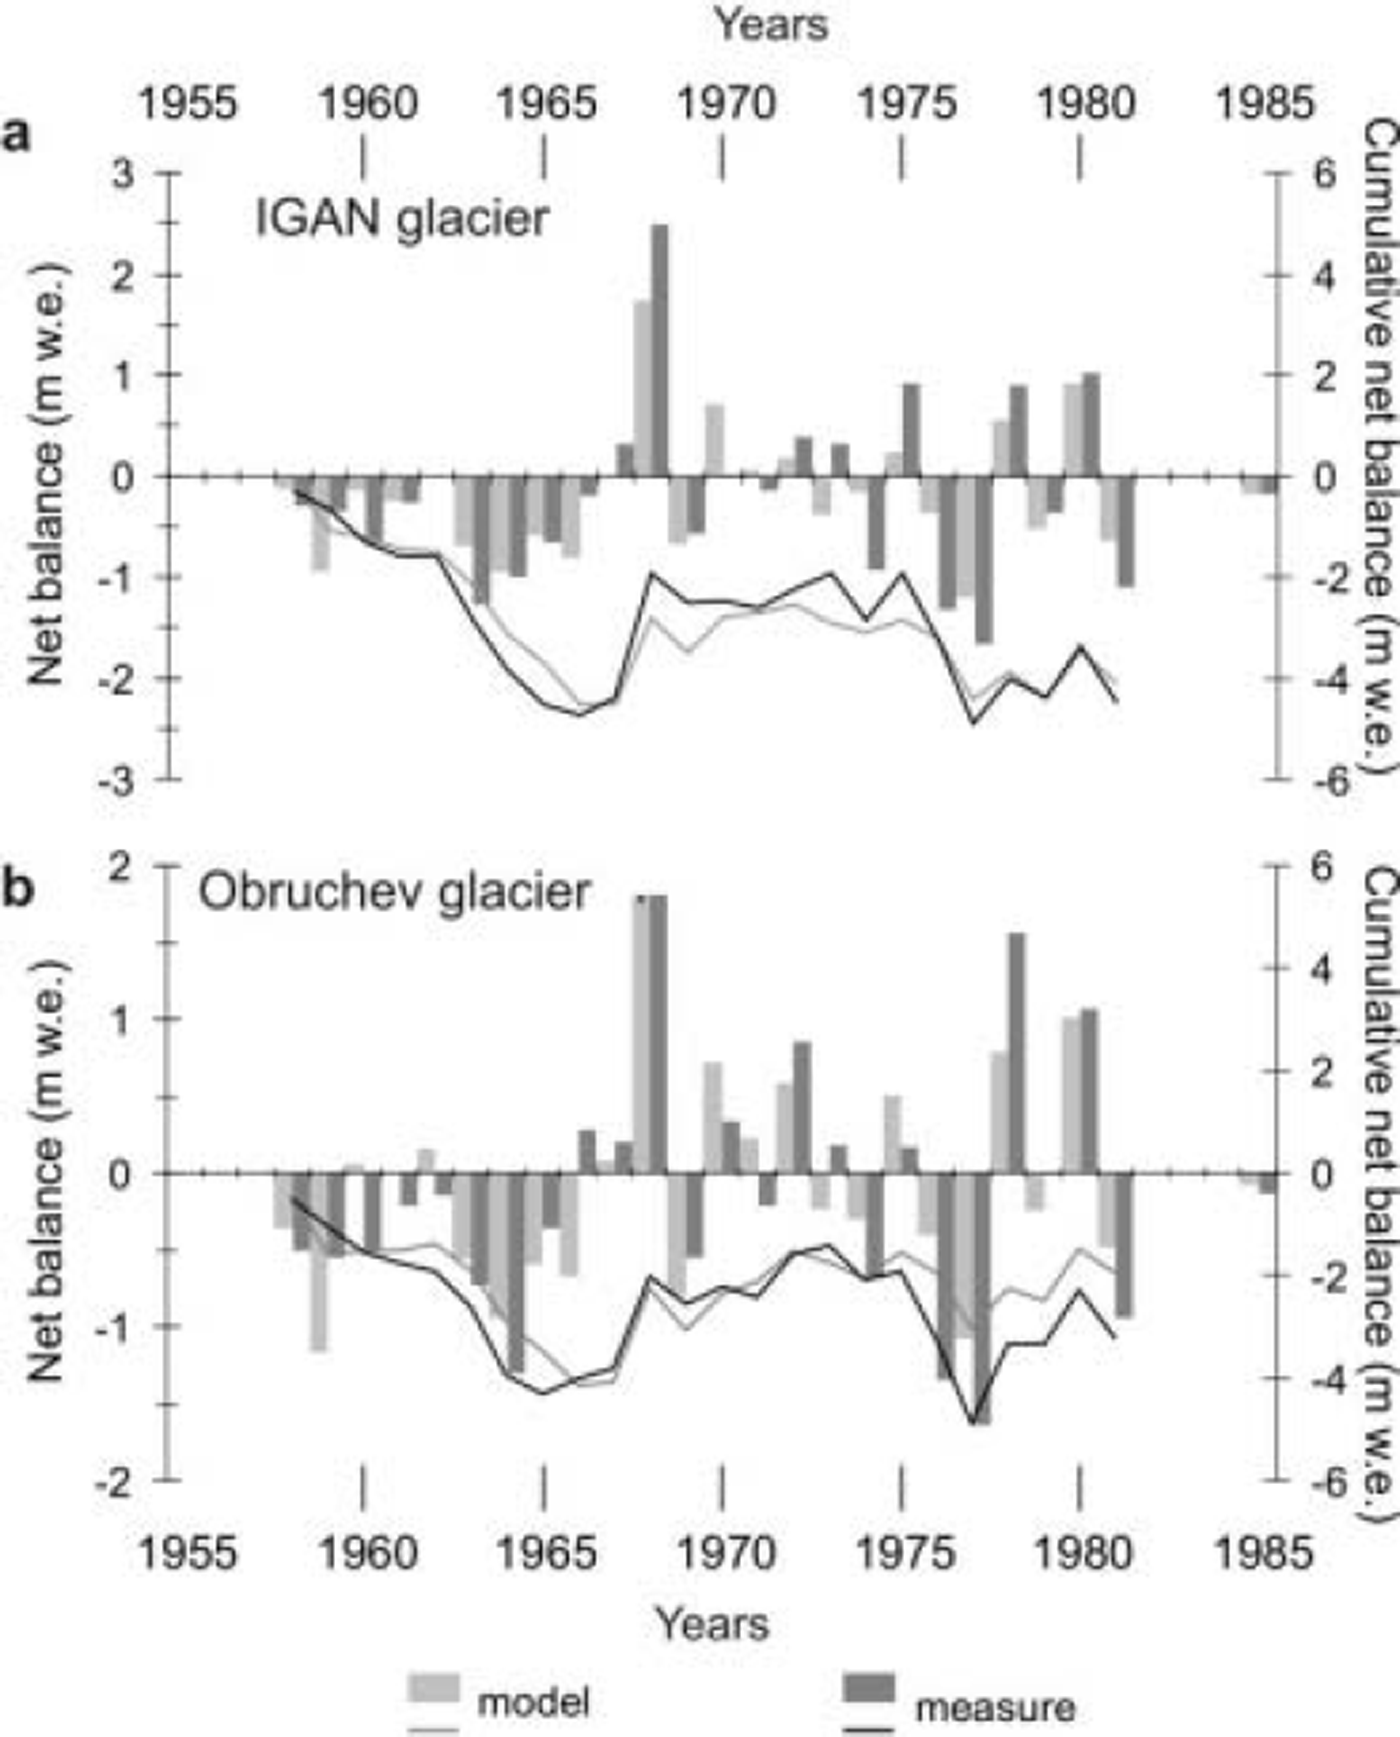
Using the glacier mass balance and the meteorological data, we found close relationships between b s (which depends primarily on ablation) and June–September T s for both IGAN glacier (R = 0.82) and Obruchev glacier. (R = 0.86). The connection between cold-period (October– May) P sol and b w appeared to be less pronounced (R = 0.59 and 0.53 for IGAN and Obruchev glaciers respectively). This may be attributed to snow redistribution over the surface by wind and avalanches. Regression equations were used to reconstruct glacier mass-balance data from the meteorological records. Figure 4 demonstrates an agreement between the calculated and observed mass-balance data. For further calculations we used the arithmetic mean values of mass balance for IGAN and Obruchev glaciers. With the help of obtained regression equations we found the variation of b s from T s (R 2 = 0.75) and b w from P sol (R 2 = 0.35). The standard error of the net mass-balance estimate is 0.47 mw.e.
Comparison of measured and modelled net balance of IGAN and Obruchev glaciers. The bars show annual net balance; the lines show cumulative net balance.
To model the glacier mass-balance variations for the last millennium, we reconstructed the climate of the region from the tree-ring chronology data. As mentioned above, the rate of tree-ring growth depends on climate. However, it is not possible to infer climate fluctuations directly from tree-ring width data, since width also depends on biologically controlled effects (e.g. tree rings are wider at the earlier stages of tree growth and become thinner during later stages) (Reference Cook, Briffa, Shiyatov, Mazepa, Cook and KairiukstisCook and others, 1990). To exclude, or at least reduce, the non-climatic signal, we used the regional curve standardization procedure. Reference Briffa, Jones, Schweingruber, Karlén, Shiyatov, Jones, Bradley and JouzelBriffa and others (1996) describe this procedure in more detail.
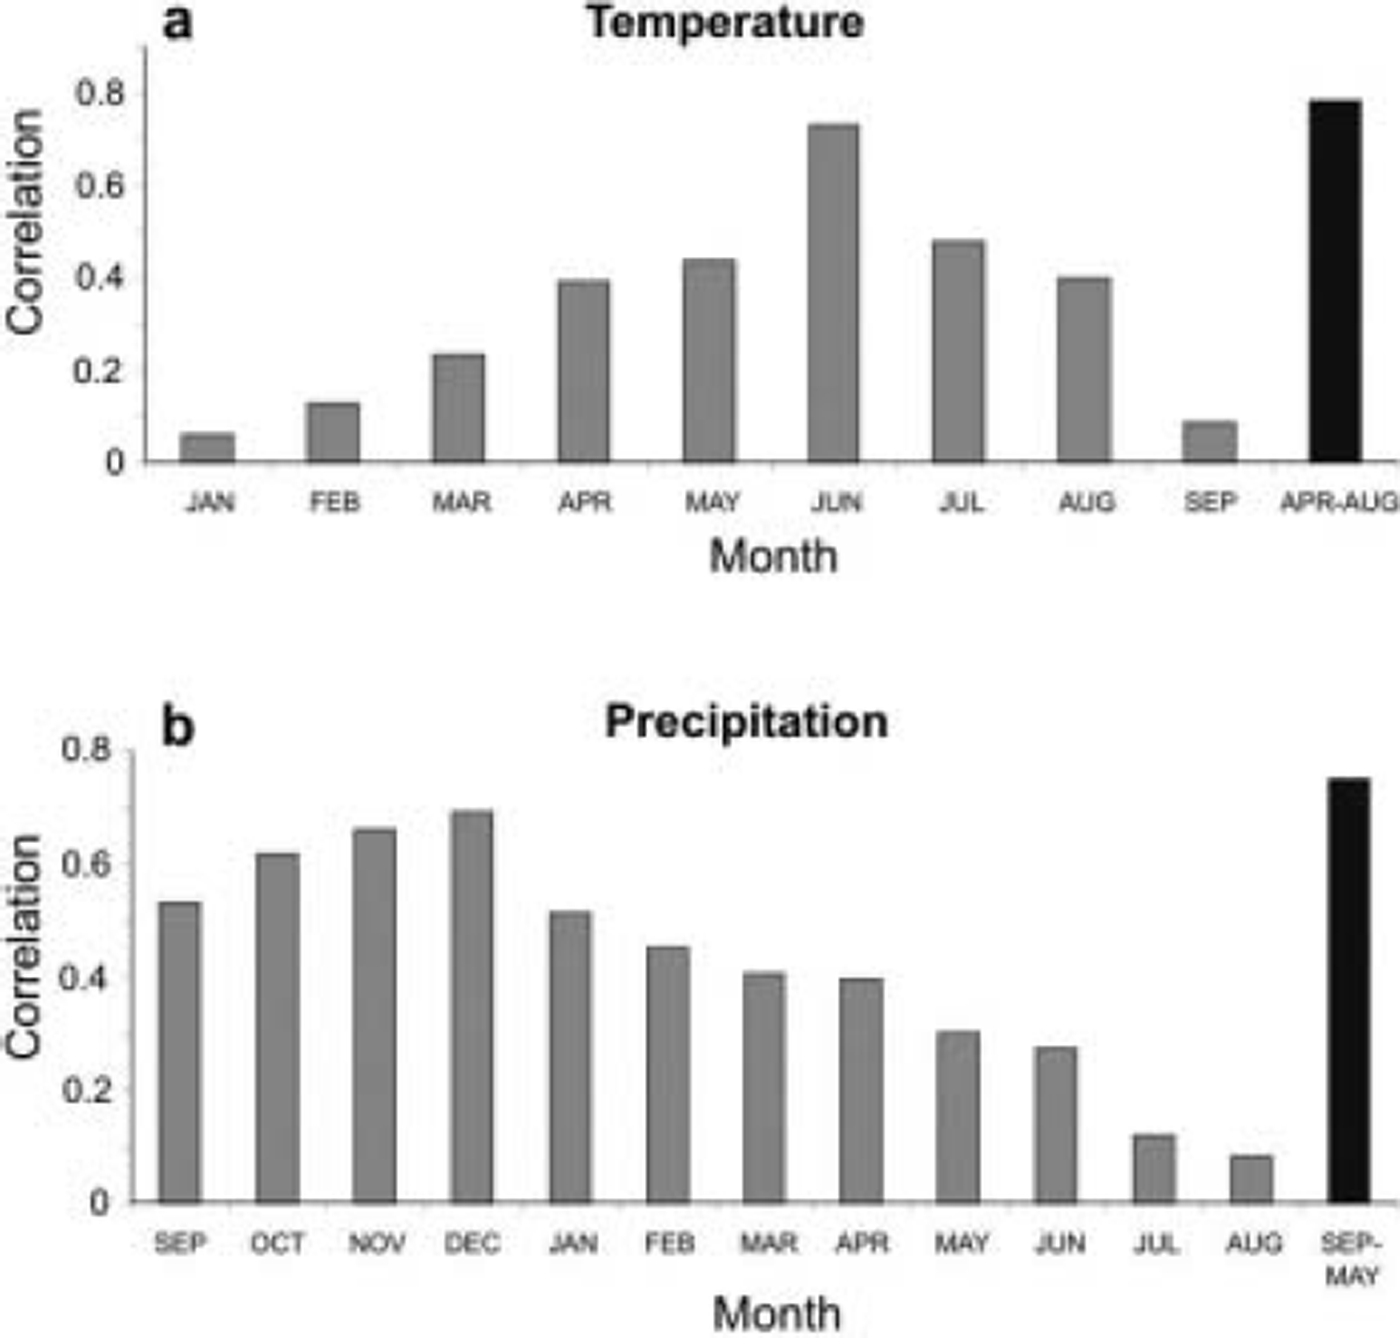
Having obtained time series of tree-ring width for both early and late wood with a strengthened climatic signal, our next step was to correlate tree-ring width (including early and late wood, as well as annual ring width) with the meteorological variables most closely related to glacier mass-balance components. The corresponding correlation coefficients are given in Figure 5. The highest correlation (0.78) is found between annual tree-ring width and average April–August air temperature (Fig. 5a). This temperature is a crucial factor for ablation and b s (Fig. 3). Cold-period (September–May) precipitation shows a good correlation (0.75) with the width of early wood (Fig. 5b).
Correlation between (a) annual ring width and air temperature, and (b) early-wood width and precipitation. Grey bars indicate monthly values, and black bars indicate (a) air temperature averaged over period with highest correlation, and (b) precipitation sum for the same period.
Results and Discussion
Mass change of the Polar Ural glaciers in the 20th century
The reconstructed mass balance of IGAN and Obruchev glaciers for the last century is shown in Figure 6. Within the last century, the mass balance varied greatly from year to year. For example, b n in 1923 was –1.3mw.e for IGAN glacier and –1.5mw.e. for Obruchev glacier, 2 years later it was +1.7 and +1.9m w.e. respectively, and another 3 years later it was –0.6 m w.e. for both glaciers. Such variations may be traced throughout the century. Despite these short-term variations, several longer periods of glacier mass-balance fluctuations can be recognized.
Variations of net balance (bars) and cumulative net balance (lines) of IGAN and Obruchev glaciers in the 20th century.

The period 1900–29 was generally not favourable for glacier growth: mean b n was –0.19mw.e. for IGAN glacier and –0.13m w.e. for Obruchev glacier. The period 1930–52 was more favourable for glacier growth: the mass balance of IGAN glacier compensated for the loss in the previous period, while that for Obruchev glacier more than compensated for the earlier loss. Overall, the cumulative mass balance from 1900 to 1952 was +0.84 and +5.98mw.e. for IGAN and Obruchev glaciers respectively.
The period 1953–68 is remarkable for its abrupt return to conditions unfavourable for glacier growth. Mean b n for this period was –0.67mw.e. for IGAN glacier and –0.49mw.e. for Obruchev glacier. From 1969 to 1986, b n is characterized by significant interannual variability but the glacier is generally in balance on average over the whole period. After 1987, the glacier shrank rapidly. From 1987 to 2000, b n was, on average, –0.21 and –0.18mw.e. for IGAN and Obruchev glaciers respectively. Generally, the second part of the 20th century shows a clear tendency towards glacier shrinkage: mean b n between 1953 and 2000 was –0.25mw.e. for IGAN glacier and –0.20mw.e. for Obruchev glacier.
Our mass-balance reconstructions for the 20th century are supported by results from several other studies in the Polar Urals (Reference Troitskiy, Avsyuk and KemmerikhTroitskiy and others, 1966; unpublished data). According to these studies, most of the Polar Ural glaciers, including IGAN and Obruchev glaciers, did not significantly change size during the first part of the 20th century. Many glaciers started to shrink and retreat after the 1950s. Field-based studies between 1958 and 1981 showed that the rate of shrinkage and retreat was not too high, except for the above-mentioned MGU glacier. Obruchev glacier lost only 0.06 km2 of its area while IGAN glacier was reduced by 0.10 km2. Instrumental observations over this period show that b n of IGAN glacier averaged over this period was -0.19mw.e. Our calculations gave an average value of -0.17 m , which is in a good agreement with the measurements.
Analysis of Advanced Spaceborne Thermal Emission and Reflection Radiometer (ASTER) satellite images (provided by G.A. Nosenko, Institute of Geography, Russian Academy of Sciences, Moscow) confirms that there has been considerable reduction in glacier extent over the last two decades. Since 1981, Obruchev and MGU glaciers have shrunk by as much as 30%, while nearby Chernov glacier lost ∼ 4 0% of its area.
Comparison of mass-balance change for Polar Ural glaciers with analogous data for some Alpine and Scandinavian glaciers obtained from direct observations (Reference Dyurgerov, Meier and ArmstrongDyurgerov and others, 2002) shows both similarities and differences (Fig. 7). The Polar Ural glaciers have more in common with Alpine glaciers located in the mid-latitudes than with Scandinavian glaciers located in the Arctic and sub-Arctic. The reason may lie in different impacts of decadal-scale atmospheric circulation features, such as North Atlantic Oscillation and El Nino-Southern Oscillation events (Reference Reichert, Bengtsson and OerlemansReichert and others, 2001; Reference Voskresenskaya and AnanichevaVoskresenskaya and Ananicheva, 2006).
Comparison of cumulative net balance of Polar Ural glaciers (grey line) with some Alpine (a–d) and Scandinavian (e, f), glaciers (black line). For the Polar Ural glaciers, the average values for Obruchev and IGAN glaciers are used.

Mass change of Polar Ural glaciers for the last millennium
According to numerous studies, based on interpretation of various proxies of past climate conditions (historical evidence, ice cores, lake sediments, annual tree rings), a number of coolings and warmings of more or less global occurrence took place during the Late Holocene (Reference LambLamb, 1977). There are two climatic events recognizable within the last millennium. The first was a warming, around AD 1000, known as the Medieval Warming Period (MWP) that probably began in the 8th century and lasted into the second millennium AD. This was followed by a colder period, the so-called ‘Little Ice Age’ (LIA) characterized by glacier advance in many mountain countries. After the LIA, the most intensive warming on a global scale has been observed during the second half of the 20th century (Reference BradleyBradley, 2001). Previous work has suggested that the timing and magnitude of climate change in general, and the MWP and LIA in particular, vary between regions (Reference Hughes and DiazHughes and Diaz, 1994; Reference SolominaSolomina, 1999).
To gain an insight into the Polar Ural glacier extent through the Late Holocene, we analyzed the cumulative curve of reconstructed bn, averaged for IGAN and Obruchev glaciers (Fig. 8). Major climatic changes produced large fluctuations in glacier mass balance. The period 776-1043 is remarkable for its steady glacier mass loss associated with the MWP: b n decreased by − 6 .4 m w.e. over this period at an average rate of -0.02 mw.e. a-1 . From the middle of the 11th century, b n became more positive. Changes were cyclic, but the trend was an increase in b n, for ∼150years, up to the beginning of the 13th century. Between 1043 and 1221, b n increased by +13.4mw.e. at an average rate of +0.07 m w.e. a-1.
Cumulative net balance (line) of Polar Ural glaciers in the Late Holocene. White bars mark the periods when mass loss prevails (warmings); grey bars mark the periods when mass gain prevails (coolings). For the Polar Ural glaciers, the average values for Obruchev and IGAN glaciers are used.

The trend then changed, and for the subsequent ∼100years, mass volume reduced by -14.9mw.e. at an average rate of -0.14 m w.e. a-1 . The next period was marked by conditions favourable for glacier growth, and up to the end of the 14th century b n increased by +14mw.e. Throughout the 15th and 16th centuries, changes in b n were cyclic, although b n was around zero on average. From the beginning of the 17th century to 1644, b n increased rapidly by +10.2mw.e. Until the middle of the 19th century, b n generally remained positive. The glaciers reached their maximum volume for the entire millennium by 1838.
On the whole, the period from the mid-11th century to the mid-19th century was characterized by positive glacier balance and may be considered as the LIA. Considering the cyclic character of the way the LIA is manifested in the studied area, the most favourable conditions for glaciers occur after the early 18th century and may be identified with the final, maximum, phase of the LIA. The period from the mid-19th century to the end of the millennium was remarkable for glacier mass loss, which is consistent with existing views on modern global warming. There were some intervals within this period when glaciers gained mass (e.g. b n increased by +10.1mw.e between 1880 and 1952). Such positive phases, however, could not make up for total mass loss in the Late Holocene.
To gain a better understanding of regional variations in glacier response to climate change, we compared our reconstructions for Polar Ural glaciers with modelled variations of Grosser Aletschgletcher, Switzerland, over the last 2000 years (Reference Haeberli and HolzhauserHaeberli and Holzhauser, 2003). On a qualitative level (favourable and unfavourable periods for glacier growth) the comparison showed more agreements than disagreements, especially for the 50 year (as opposed to the 100 year) resolution model (cf. Reference Haeberli and HolzhauserHaeberli and Holzhauser, 2003, fig. 5). The closer to the modern time, the better the agreement.
As mentioned above, the mid-11th century marks a period of rapid and sustained glacier growth in the Polar Urals. At that time, Grosser Aletschgletcher was increasing slightly in volume. This serves as a good foundation for marking this time as the LIA onset in the Polar Urals. After this time, however, glacier fluctuations varied slightly between regions. For example, between 1150 and 1250, Grosser Aletschgletcher shrank while in the Polar Urals the glaciers continued to grow, shrinking between 1221 and 1321. The next wave of cooling in the Polar Urals began in the early to mid-14th century. In the Swiss Alps, this phase also corresponds to a marked advance of Grosser Aletschgletcher, although there it started about half a century earlier and at a slower rate. It is this advance that is considered to mark the onset of the LIA in the Alps. The onset of the final stage of the LIA also appears to vary slightly between regions: the beginning of the 17th century in the Polar Urals, and the end of the 16th century in the Alps. The most favourable conditions for glacier advance occurred simultaneously in both regions, in the middle of the 18th century.
Conclusions
Air-temperature and precipitation data obtained from weather stations situated ∼100km away (supplemented by global re-analysis data) can be used to reconstruct glacier mass-balance variations during the 20th century providing there is sufficient overlap between the climate and mass-balance datasets for robust statistical relationships to be defined.
Tree-ring data may be used to extend glacier mass-balance data back through the last millennium providing early-wood and annual ring widths can be measured, and correlated with winter precipitation and summer air-temperature data respectively over part of the time period.
Reconstructed mass-balance changes for the Polar Ural glaciers during the 20th century show that glaciers tended to lose mass between 1900 and ∼1920, gain mass until the mid-1950s, lose mass through the late 1950s and through the 1960s, attain mass equilibrium during the 1970s and then lose mass until the end of the century. The mass-balance changes appear to have more in common with those in the Alps than those in northern Scandinavia.
Reconstructed climate and mass-balance changes for the Polar Ural glaciers during the last millennium were, in general, consistent with the main phases of Late Holocene climate and glacier fluctuations observed in the Alps, although there were some subtle differences in the timing and magnitude of changes in the Polar Urals compared with those in the Alps.
The magnitude of negative mass balance for Polar Ural glaciers during the Medieval Warm Period and during the period of modern global warming is similar, although caution is needed here since it is likely that our reconstruction does not cover the entire MWP.
Glaciers have persisted in the Polar Urals throughout the Late Holocene, although currently they appear to be close to their minimum extent for over 1000 years. Glaciers in the region should continue to be monitored for continued evidence of climate change (cf. Reference Haeberli, Cihlar and BarryHaeberli and others, 2000; Reference Haeberli, Huber, Bugmann and ReasonerHaeberli, 2004).
Acknowledgements
We are very grateful to D. Tsvetkov and G. Nosenko for providing data about the modern positions of Polar Ural glaciers. We also thank the organizers of the World Tree-ring Data Bank (http://www.ngdc.noaa.gov/paleo/treering.html), and F. Schweingruber for the material that he placed in this bank. Finally, we thank W. Haeberli and an anonymous referee who reviewed the paper and provided many extremely useful comments and ideas.



