


I. Introduction
Stocks with economic connections (such as the customer–supplier relationship) exhibit positive cross-autocorrelation in returns, also known as the momentum spillover effect. Starting with the early work by Moskowitz and Grinblatt (Reference Moskowitz and Grinblatt1999), Hou (Reference Hou2007), and Cohen and Frazzini (Reference Cohen and Frazzini2008), a vast amount of research explores various settings of stock linkages, including, upstream–downstream industries (Menzly and Ozbas (Reference Menzly and Ozbas2010)), conglomerate firms (Cohen and Lou (Reference Cohen and Lou2012)), alliance partners (Cao, Chordia, and Lin (Reference Cao, Chordia and Lin2016)), text-based peers (Hoberg and Phillips (Reference Hoberg and Phillips2016), (Reference Hoberg and Phillips2018)), technological closeness (Lee, Sun, Wang, and Zhang (Reference Lee, Sun, Wang and Zhang2019)), geographic links (Parsons, Sabbatucci, and Titman (Reference Parsons, Sabbatucci and Titman2020)), and shared analyst coverage (Ali and Hirshleifer (Reference Ali and Hirshleifer2020)).Footnote 1
Despite the literature’s explosion in discovering new stock linkages, the proposed mechanisms remain largely coarse. The prevailing explanation typically describes a single-period scenario where investors overlook value-relevant information conveyed by peer stocks’ returns, leading to an initial underreaction of prices. It remains unclear, however, how these shocks translate into prices (i.e., a characterization of who trades on what). This article takes a different approach by linking return and trading behavior. I show that the interaction between professional and retail investors’ trading generates both return continuation and reversal across stocks. Consequently, realized prices exhibit substantial fluctuations rather than smoothly converging to their fundamental values. As such, this study yields insights into how demand shocks contribute to predictability among economically linked firms and elucidates the process of information diffusion in financial networks.
My starting point is to decompose price movements into the intraday component and the overnight component. This approach builds on the large literature showing that the clientele and information environment differ substantially between intraday and overnight periods (e.g., French and Roll (Reference French and Roll1986), Barclay and Hendershott (Reference Barclay and Hendershott2003), Boudoukh, Feldman, Kogan, and Richardson (Reference Boudoukh, Feldman, Kogan and Richardson2019), and Lou, Polk, and Skouras (Reference Lou, Polk and Skouras2019), (Reference Lou, Polk and Skouras2024)). The point-in-time and simple-to-measure construction allows me to dissect the generating process of momentum spillover effects while being applicable to various linkage settings.
Specifically, intraday returns are mainly driven by professional trades. Recent work such as Lou et al. (Reference Lou, Polk and Skouras2019), Akbas, Boehmer, Jiang, and Koch (Reference Akbas, Boehmer, Jiang and Koch2022), and Bogousslavsky (Reference Bogousslavsky2021) provides evidence that informed arbitrageurs operate during the daytime, whereas less sophisticated investors mainly trade at the market open; Lou et al. (Reference Lou, Polk and Skouras2024) show that overnight clientele have features associated with households, whereas intraday clientele are typically characterized by institutions. Aligning with sophisticated investors’ dominant role in intraday trading, French and Roll (Reference French and Roll1986) and Boudoukh et al. (Reference Boudoukh, Feldman, Kogan and Richardson2019) suggest that daytime order flows and intraday price fluctuations reflect private information to a larger extent than public news.
By contrast, overnight returns (price changes from the prior close to the next day’s open) are driven by orders entered overnight and around market open, plausibly reflect retail investors’ demand and attention-grabbing news. For example, overnight returns reveal the impact of salient and widespread events that attract retail investor attention (Berkman, Koch, Tuttle, and Zhang (Reference Berkman, Koch, Tuttle and Zhang2012), Engelberg, Sasseville, and Williams (Reference Engelberg, Sasseville and Williams2012), and Aboody, Even-Tov, Lehavy, and Trueman (Reference Aboody, Even-Tov, Lehavy and Trueman2018)). Earnings and economic news are typically announced overnight (Jiang, Likitapiwat, and McInish (Reference Jiang, Likitapiwat and McInish2012)), and retail participation in after-hours trading is heightened on days with scheduled corporate events (Cui, Gozluklu, and Haykir (Reference Cui, Gozluklu and Haykir2025)). Ahn, Fan, Noh, and Park (Reference Ahn, Fan, Noh and Park2024) identify a positive relationship between retail trading intensity and the inflation of opening prices. In addition, Boudoukh et al. (Reference Boudoukh, Feldman, Kogan and Richardson2019) show that public news plays a more crucial role in driving overnight return volatility than in driving intraday return volatility.
These facts suggest the feasibility of disentangling the channels of cross-stock return predictability by examining i) the difference in the predictive ability of peer stocks’ intraday and overnight returns and ii) the realization of focal stocks’ subsequent returns during the intraday and overnight periods. In this article, I use the shared analyst coverage of Ali and Hirshleifer (Reference Ali and Hirshleifer2020) as my primary empirical setting (i.e., two stocks are defined as connected peers if they share at least one common analyst coverage).Footnote 2
I start by decomposing peer stocks’ monthly returns into the intraday and overnight components and testing their predictive ability for focal stocks’ future close-to-close returns. The connected-firm portfolio intraday return (CF Day) exhibits positive and significant predictive power, with the long-short strategy generating a value-weighted return of 0.72% and a 7-factor alpha of 1.01% per month. In sharp contrast, the connected-firm portfolio overnight return (CF Night) does not predict focal stocks’ subsequent close-to-close price changes, and the average return of the CF Night strategy is small in magnitude (−0.14%). This pricing pattern is also confirmed in a series of Fama and MacBeth (Reference Fama and MacBeth1973) regressions.
I proceed by decomposing focal stocks’ monthly returns to examine how strategy profits materialize. While CF Night does not predict future close-to-close returns, higher peer stocks’ overnight returns are associated with elevated opening prices for focal stocks, which fully reverse during the daytime period. Specifically, the CF Night strategy generates an overnight return of 1.40% and an intraday return of −1.43% per month. While I also find that CF Day positively (negatively) predicts future intraday (overnight) returns, its negative predictive ability for overnight returns is minor and unstable. The value-weighted CF Day strategy earns an intraday return of 0.96% per month, whereas the overnight return spread is only −0.31%. The correlation between CF Day and future overnight returns even becomes marginally positive after controlling for other variables in regressions.
In other words, an asymmetric tug-of-war (Lou et al. (Reference Lou, Polk and Skouras2019)) emerges in the context of cross-stock predictability: i) an inter-firm continuation of overnight and intraday returns, where high CF Night (CF Day) is followed by high overnight (intraday) returns for the focal stock in the next month; ii) an inter-firm daytime reversal effect, evidenced by low subsequent monthly intraday returns after high CF Night; and iii) minor inter-firm overnight price reactions, as indicated by the weak relationship between CF Day and future monthly overnight returns. Figure 1 provides a graphical summary of the main findings.
Figure 1 depicts the decomposition of cross-firm return predictability. We partition both peer- and focal-firms’ monthly returns into the overnight and the intraday components. Peer firms’ average overnight return in month
$ t $
 positively (negatively) predicts focal firms’ overnight (intraday) return in month
$ t+1 $
 ; peer firms’ average intraday return positively predicts focal firms’ intraday return in month
$ t+1 $
 , while displaying only a weak association with focal firms’ subsequent overnight return.

This asymmetric cross-firm tug-of-war pattern reveals a deeper mechanism than what is suggested by the inattention story. Consider two types of investors (Lou et al. (Reference Lou, Polk and Skouras2019), (Reference Lou, Polk and Skouras2024)): the intraday clientele (characterized by professional traders) and the overnight clientele (characterized by individuals). Since individuals are prone to over-extrapolation and tend to pursue glamour stocks (Lakonishok, Shleifer, and Vishny (Reference Lakonishok, Shleifer and Vishny1994), Barber and Odean (Reference Barber and Odean2008)), their persistent trading distorts prices, generating the inter-firm continuation of overnight returns.Footnote 3 In other words, the focal stock’s opening price continues to deviate from the fundamental value due to overnight clientele’s persistent preferences.Footnote 4 Intraday investors, aware that overnight returns are sensitive to noise trading, disagree with the opening price. Consequently, intraday returns tend to reverse as the effective demand during the daytime does not align with the opening price. The opposing reactions of focal stocks’ overnight and intraday returns thus lead to the absence of predictive power of CF Night for close-to-close returns.
For peer stocks’ intraday price variations, investors face constraints in executing instantaneous arbitrage due to market friction and restrictions (Mitchell, Pedersen, and Pulvino (Reference Mitchell, Pedersen and Pulvino2007), Duffie (Reference Duffie2010)). Daytime investors trade with a delay, leading to the inter-firm continuation of intraday returns. Anomaly returns result as focal stocks’ prices are gradually corrected by arbitrageurs. In contrast, overnight investors do not significantly trade on peer stocks’ intraday returns due to the greater salience of overnight news (Berkman et al. (Reference Berkman, Koch, Tuttle and Zhang2012), Engelberg et al. (Reference Engelberg, Sasseville and Williams2012)). Therefore, the focal stock’s overnight return does not react strongly to peers’ intraday returns. The asymmetric responses of focal stocks’ overnight and intraday returns thus contribute to the positive predictive ability of CF Day for close-to-close returns.
I conduct a series of tests to validate this mechanism. First, I show that CF Day positively and significantly forecasts future changes in the breadth of institutional investor ownership (Chen, Hong, and Stein (Reference Chen, Hong and Stein2002), Lehavy and Sloan (Reference Lehavy and Sloan2008)) and future changes in institutional holding. Crucially, peer stocks’ overnight returns are unrelated to institutional investors’ subsequent recognition and trading. This result supports the story that the price correction from professional traders’ behavior leads to the positive predictive ability of peer stocks’ intraday returns, while the insufficiency in the effective demand in response to peer stocks’ overnight returns contributes to the cross-stock daytime reversals.
Second, the magnitude of CF Night positively and significantly correlates with subsequent retail attention (Da, Engelberg, and Gao (Reference Da, Engelberg and Gao2011)). On the contrary, CF Day does not attract retail attention. CF Night also positively predicts retail investors’ net purchase, whereas the effect of CF Day is minor. This finding aligns with prior work that overnight news attracts attention, and the trading preference of retail investors is persistent. In contrast, peer stocks’ intraday price movements are largely underrated by individuals. As a result, overnight returns tend to continue across stocks, while the reaction of future overnight returns to peer stocks’ intraday returns is marginal, as individuals’ attention is drawn more to overnight price variations.
Third, I compare variations in different types of order imbalance. I show that CF Night positively predicts retail order imbalance, whereas CF Day does not. In sharp contrast, the predictive ability of peer stocks’ intraday and overnight returns undergoes a notable shift for total order imbalance, where professional traders are more likely to dominate. Specifically, CF Day positively and significantly predicts the focal stock’s total order imbalance, while CF Night displays a slightly negative correlation with subsequent total order imbalance. This finding provides further evidence of the distinction between retail and professional trades in response to peer stocks’ overnight and intraday returns.
Fourth, I examine the time variation in the cross-firm tug-of-war by analyzing flows to mutual funds and hedge funds (Akbas, Armstrong, Sorescu, and Subrahmanyam (Reference Akbas, Armstrong, Sorescu and Subrahmanyam2015)). The intuition behind this test is that an influx of “dumb money” would exacerbate price distortions, while an increase in “smart money” facilitates price correction. Consistently, I show that aggregate mutual fund flows are associated with stronger overnight return continuation and daytime reversals, whereas hedge fund flows imply a more pronounced continuation of intraday returns.
What drives the observed discrepancy between professional and retail investors’ trading? Differences in the information content between peer stocks’ intraday and overnight returns shed light on this question. It turns out that CF Day is positively associated with the future profitability of focal stocks, whereas CF Night exhibits a negative correlation with subsequent profitability. Moreover, CF Night is positively related to growth in total assets, sales, and revenues, whereas the relationship between CF Day and fundamental growth is minor. This pattern is consistent with the tendency of retail investors to be drawn to salient signals and to chase glamour stocks. Overall, these findings support my earlier results on trading metrics, suggesting that persistent speculative trading by individuals distorts opening prices, while slow-moving arbitrage by professional investors gradually corrects mispricing.
Finally, I explore intraday patterns of cross-firm tug-of-war. Bogousslavsky (Reference Bogousslavsky2021) suggests that institutions primarily trade on mispricing early in the day, and they tend to unwind positions before market close to mitigate the costs and risks associated with overnight periods. Consequently, anomaly returns typically accrue throughout the day but get attenuated at the end of the day. Consistent with this channel, the positive (negative) intraday returns of the CF Day (CF Night) strategy are concentrated in the early trading sessions and reverse during the last 15-minute interval before market close. I conduct a battery of additional tests to evaluate the robustness of the main results and the mechanism.
This article contributes to the existing literature that explores the explanations for cross-firm return predictability. Building on the inattention channel, Huang, Lin, and Xiang (Reference Huang, Lin and Xiang2021) highlight the role of anchoring bias (George and Hwang (Reference George and Hwang2004)), whereas Huang, Lee, Song, and Xiang (Reference Huang, Lee, Song and Xiang2022) focus on information discreteness (Da, Gurun, and Warachka (Reference Da, Gurun and Warachka2014)). Burt and Hrdlicka (Reference Burt and Hrdlicka2021) show that the return predictability of economically linked firms could also come from their commonality in momentum. Different from these studies, I focus on the role of investor composition and the driving force underlying the realization of anomaly returns. The coexistence of cross-momentum and reversal is an important complement to existing explanations, which predominantly focus on variations in anomaly signals without systematically examining investors’ trading behavior.Footnote 5
I also complement growing work on asset pricing implications of the overnight–intraday price dynamics.Footnote 6 The pioneering work by Lou et al. (Reference Lou, Polk and Skouras2019) propose a clientele perspective on the tug-of-war predictability of overnight and intraday returns. Follow-up studies include the pricing effect of tug-of-war intensity (Akbas et al. (Reference Akbas, Boehmer, Jiang and Koch2022)), heterogeneous liquidity providers (Lu, Malliaris, and Qin (Reference Lu, Malliaris and Qin2023)), and equity premium forecasts (Lou et al. (Reference Lou, Polk and Skouras2024)). Hendershott, Livdan, and Rösch (Reference Hendershott, Livdan and Rösch2020) study the capital market line with beta estimated during different time periods, whereas Bogousslavsky (Reference Bogousslavsky2021) finds that mispricing gradually corrects over the day but worsens at the end of the day. Barardehi, Bogousslavsky, and Muravyev (Reference Barardehi, Bogousslavsky and Muravyev2025) propose to use the overnight/intraday decomposition to distinguish between public and private information flows.
This article differs from prior research in two key aspects: i) I focus on cross-stock return predictability rather than own-autocorrelations, and ii) I decompose and study both the formation and holding period returns. Importantly, I document an asymmetric inter-firm tug-of-war pattern that shows how demand shocks from different clientele create return spillover in economic links. The findings suggest that investor heterogeneity and demand variations, beyond inattentiveness, play a significant role in generating the intricate cross-predictability patterns in stock returns.
The rest of this article is organized as follows: Section II describes the data sources and variable constructions. Section III presents the results of decomposing peer stocks’ returns. Section IV further studies the intraday and overnight returns of focal stocks. Section V examines the mechanisms and provides additional robustness tests. Section VI concludes.
II. Data and Variables
The main sample used in this article covers nonfinancial common stocks (share code 10 or 11) listed on NYSE, Nasdaq, and AMEX. Stock returns and price data are obtained from CRSP, and accounting information is from Compustat. I exclude stocks with a share price below $5 at the end of each month and require stocks to have at least 10 trading day records during the month. Constrained by the availability of opening prices data, the sample period is from July 1992 to December 2021.Footnote 7
The analyst forecast data come from the unadjusted detail history file of the IBES. I obtain quarterly data on institutional investor (13F) holdings and the number of institutional investors from Thomson Reuters. Data on retail trades are acquired from the WRDS – TAQ Millisecond Tools database. The time series of monthly risk-free rates and Fama–French factor returns are downloaded from Ken French’s website.
A. Intraday and Overnight Returns
Following prior studies, for each firm
$ i $
 , the intraday return (
$ {r}_{i,s}^{Day} $
 ) and overnight return (
$ {r}_{i,s}^{Night} $
 ) on day
$ s $
 are defined as

in which the daily close-to-close return
$ {r}_{i,s}^{close- to- close} $
 is the holding-period return adjusted for corporate events such as dividend distributions or stock splits. Then, I calculate monthly intraday and overnight returns by cumulating daily returns over each month:

where
$ {S}_{i,t} $
 is the number of trading days of stock
$ i $
 in month
$ t $
 .
B. Shared Analyst Coverage Signals
I follow the same procedure as Ali and Hirshleifer (Reference Ali and Hirshleifer2020) in constructing the shared analyst coverage. Each month, two stocks are defined as connected if at least one analyst has issued FY1 or FY2 earnings forecasts for both stocks over the previous 12 months. Then, the connected-firm portfolio return (CF RET) of focal firm
$ i $
 in month
$ t $
 is calculated by

where
$ {n}_{i,j} $
 is the number of shared analysts between focal firm
$ i $
 and peer firm
$ j $
 ,
$ {N}_{i,t} $
 is the total number of peer stocks (
$ j $
 ) connected to each focal firm (
$ i $
 ) as of the formation date, and
$ {Ret}_{j,t} $
 is the total return of peer stock
$ j $
 during month
$ t $
 . Analogously, I define the connected-firm portfolio intraday return (CF Day) and connected-firm portfolio overnight return (CF Night), respectively, as the following:

in which
$ {r}_{j,t}^{Day} $
 and
$ {r}_{j,t}^{Night} $
 are the cumulative intraday return and cumulative overnight return of peer firm
$ j $
 during month
$ t $
 , respectively, as defined in equation (2).
While my main analysis leverages the shared analyst coverage setting, this article does not assume that investors, particularly retail investors, trade specifically along analyst connections. A large literature shows that retail investors hold underdiversified portfolios (Goetzmann and Kumar (Reference Goetzmann and Kumar2008), Balasubramaniam et al. (Reference Balasubramaniam, Campbell, Ramadorai and Ranish2023)) and, even without recognizing it, tend to trade stocks that share economic links. For example, retail investors exhibit positive-feedback trading within industries (Jame and Tong (Reference Jame and Tong2014)), purchase stocks with similar characteristics due to categorical thinking (Kumar (Reference Kumar2009)) or personal experiences (Huang (Reference Huang2019)), display preferences for local stocks (Seasholes and Zhu (Reference Seasholes and Zhu2010)), and follow analysts’ recommendations in their trades (McLean, Pontiff, and Reilly (Reference McLean, Pontiff and Reilly2025a)). Since shared analyst coverage unifies many forms of economic connections (Ali and Hirshleifer (Reference Ali and Hirshleifer2020)), it provides a parsimonious proxy for the set of firms investors are likely to track. For robustness, I also consider several alternative definitions of economic links.
C. Other Lead–Lag Settings and Control Variables
In addition to the shared analyst coverage, I examine five alternative economic linkage settings, including industry links, text-based links, geographic links, technological links, and conglomerate firms. For industry links, I use the Fama–French 49 industry classification and the 3-digit SIC codes industry classification. For text-based links, I use the text-based industry classification developed by Hoberg and Phillips (Reference Hoberg and Phillips2010), (Reference Hoberg and Phillips2016). For geographic links, I use each firm’s headquarters location based on the ZIP code in Compustat. The geographic peer firms are identified using the first 3-digit ZIP codes. For technological links, I use the patent data provided by Kogan, Papanikolaou, Seru, and Stoffman (Reference Kogan, Papanikolaou, Seru and Stoffman2017) and define technology-linked firms following the methodology of Lee et al. (Reference Lee, Sun, Wang and Zhang2019). For conglomerate firms, I rely on firms’ industry segment data extracted from Compustat segment files and calculate pseudo-conglomerate portfolio returns for each conglomerate firm, following Cohen and Lou (Reference Cohen and Lou2012). For the sake of brevity, I leave the details of data and signal constructions in Supplementary Material Appendix B.
In baseline regressions, I control for each stock’s past performance, including the 1-month return and the 12-month return (skipping the most recent month). Second, I control for firm size, calculated as the logarithm of market capitalization, and the logarithm of the book-to-market ratio. Finally, I control for idiosyncratic volatility (Ang, Hodrick, Xing, and Zhang (Reference Ang, Hodrick, Xing and Zhang2006)) and illiquidity. Idiosyncratic volatility is calculated using 1-month daily returns relative to the Fama–French 3-factor model; illiquidity is measured using the average daily ratio of the absolute return over dollar trading volume in the past month (Amihud (Reference Amihud2002)).
D. Institutional and Retail Investor Variables
For institutional investor-related variables, I measure institutional recognition by calculating quarterly changes in the breadth of institutional investor ownership (
$ \Delta $
 BD), as in Chen et al. (Reference Chen, Hong and Stein2002) and Lehavy and Sloan (Reference Lehavy and Sloan2008). Specifically,
$ \Delta $
 BD measures the change in the proportion of 13F filers holding a stock:

where
$ {Num}_{i,q} $
 and
$ {Num}_{i,q-1} $
 are the number of 13F filers holding stock
$ i $
 during quarter
$ q $
 and quarter
$ q-1 $
 , respectively;
$ {TotalNum}_{q-1} $
 is the total number of 13F filers in quarter
$ q-1 $
 . I also measure institutional investors’ trading (
$ \Delta $
 INST) using quarterly changes in institutional ownership (Edelen, Ince, and Kadlec (Reference Edelen, Ince and Kadlec2016)).Footnote
8
For retail investor-related variables, I use Google search volume to capture retail investor attention (Da et al. (Reference Da, Engelberg and Gao2011)). Specifically, I define abnormal Google search volume as the logarithm difference between the Google search volume in the current month and the average of Google search volume over the past year. I also obtain daily retail trading volume from the WRDS – TAQ Millisecond Tools database, in which retail trades are identified based on the Boehmer, Jones, Zhang, and Zhang (Reference Boehmer, Jones, Zhang and Zhang2021) algorithm. Then, I calculate daily retail trading as retail buys volume minus retail sells volume, scaled by shares outstanding (McLean et al. (Reference McLean, Pontiff and Reilly2025b)). For each stock, the monthly net purchase of retail investors is computed by aggregating daily retail trading within the month.Footnote 9
E. Order Imbalance and Fund Flows
Order imbalance is calculated based on the number of trades, trading volume, and dollar value. Trade imbalance is calculated by the difference in the number of buys and the number of sells divided by the total number of buys and sells. Volume imbalance is shares of buy trades minus shares of sell trades divided by the total volume of buys and sells. Value imbalance is the difference in the dollar value of buys and the dollar value of sells divided by the total dollar value of buys and sells. Then, for each stock, the monthly order imbalance is computed by averaging the daily order imbalance within the month. Retail order imbalance is constructed analogously using the Boehmer et al. (Reference Boehmer, Jones, Zhang and Zhang2021) method.
I follow the procedure of Akbas et al. (Reference Akbas, Armstrong, Sorescu and Subrahmanyam2015) to calculate flows to mutual funds (MFFLOW) and flows to hedge funds (HFFLOW). Specifically, the monthly aggregate fund flows are calculated as

where
$ {TNA}_{i,t} $
 is the total net assets of fund
$ i $
 , and
$ {MRET}_{i,t} $
 $ {HRET}_{i,t} $
 denote the net-of-fee returns of a mutual fund and a hedge fund, respectively. Mutual fund data are obtained from the CRSP Survivor-Bias-Free US Mutual Fund Database, whereas hedge fund data are obtained from the Lipper TASS database.
F. Summary Statistics
Table 1 reports summary statistics for the main variables used in my analysis. Panel A reproduces the post-1992 statistics for shared analyst coverage. On average, each firm is connected to 77 other stocks through common analyst coverage, with more than half of the firms having analyst-linked stocks of at least 68. Over the period from 1992 to 2021, stocks with shared analyst coverage represent 82% of the total number of stocks and account for 98% of the total stock market capitalization. Regarding the returns of peer firms, the distributions of signals using close-to-close return (CF RET), intraday return (CF Day), and overnight return (CF Night) are comparable. Overall, CF Night exhibits slightly higher values compared with CF RET and CF Day, while also displaying a smaller standard deviation. Similarly, Panel B reports that the focal stock’s intraday returns are more volatile than its overnight returns.

Table 1 Long description
The table contains 10 columns: Item, Mean, Std. Dev., Min, P 1, P 10, Median, P 90, P 99, and Max.
* Panel A. Shared Analyst Coverage: Includes No. of connected firms (Mean 77, Median 68), No. of stocks covered (Mean 0.820), Market capitalization covered (Mean 0.980), C F R E T (Mean 1.214), C F Day (Mean 0.237), and C F Night (Mean 1.550).
* Panel B. Focal Firms Own Returns: Includes Ret C C (Mean 2.102), Ret Day (Mean 1.476), and Ret Night (Mean 1.047).
* Panel C. Institutional and Retail Investors: Includes Institutional recognition Delta B D (Mean 0.075), Institutional trading Delta I N S T (Mean 0.560), Retail investor attention (Mean minus 0.104), and Retail investor net purchase (Mean 0.004).
* Panel D. Order Imbalance: Covers Total and Retail imbalances for trade, volume, and value. Means range from minus 0.006 to minus 0.027.
* Panel E. Fund Flows: Includes M F F L O W (Mean 0.067, Median 0.013) and H F F L O W (Mean 0.317, Median 0.421).
Panels C and D present variables related to investor activity and order imbalance. Institutional recognition (
$ \Delta \mathrm{BD} $
 ) and institutional trading (
$ \Delta \mathrm{INST} $
 ) have positive means (Lehavy and Sloan (Reference Lehavy and Sloan2008), McLean et al. (Reference McLean, Pontiff and Reilly2025b)), whereas the average net purchase by retail investors is close to zero (McLean et al. (Reference McLean, Pontiff and Reilly2025b)). Order imbalance is negative on average, particularly for retail order imbalance. This pattern is consistent with the evidence documented in previous studies (Boehmer et al. (Reference Boehmer, Jones, Zhang and Zhang2021), Charles (Reference Charles2025)). Panel E reports flows to mutual funds and hedge funds. In line with Akbas et al. (Reference Akbas, Armstrong, Sorescu and Subrahmanyam2015), average hedge fund flows exceed mutual fund flows, and both MFFLOW and HFFLOW exhibit substantial time-series variation.
III. Lead–Lag Relationship from Decomposing Peer Stock Returns
A. Portfolios Based on Peers’ Intraday and Overnight Returns
This section examines the predictive ability of peer stocks’ intraday and overnight returns. Figure 2 presents the baseline results graphically. Each month, stocks are separately sorted into quintile portfolios based on CF RET, CF Day, or CF Night. Then, value-weighted and equal-weighted portfolios are formed and held for 1 month. Table 2 reports the average returns and alphas of portfolios formed by different return signals. First, it confirms that shared analyst coverage continues to deliver significant returns in the post-1992 sample period. Panel A reports that the long-short strategy based on value-weighted portfolios generates a 4-factor alpha of 76 bps (
$ t $
 = 2.62) and a 7-factor alpha of 93 bps (
$ t $
 = 3.89) per month. The result based on equal-weighted returns is stronger. For instance, Panel B reports that the CF RET strategy earns a return of 1.53% per month during the 1992–2021 period, with a
$ t $
 -statistic of 4.50. The risk-adjusted alphas are larger than 1.68% and highly significant.
Graphs A and B of Figure 2 plot the average returns and Carhart (Reference Carhart1997) alphas of the shared analyst coverage strategies based on the 24-hour signal (CF RET), the intraday return signal (CF Day), and the overnight return signal (CF Night), respectively. Each month, two stocks are defined as connected if at least one analyst covered both stocks in the previous 12 months. CF RET is the connected-firm portfolio return constructed following Ali and Hirshleifer (Reference Ali and Hirshleifer2020). CF Day and CF Night are respectively intraday and overnight return signals, calculated using the same procedure as CF RET by replacing peer stocks’ monthly close-to-close returns with monthly intraday and overnight returns. Each month, stocks are sorted into quintile portfolios based on peer firm returns. Portfolios are held for 1 month. The blue bars represent equal-weighted returns, whereas the gray bars represent value-weighted returns. The strategy is the hedge portfolio that longs stocks in the top quintile and shorts stocks in the bottom quintile. The sample period is from July 1992 to December 2021.

Figure 2 Long description
The figure consists of two panels, Graph A and Graph B.
Graph A, titled Average return, has a y-axis labeled Average return percentage ranging from minus 1.0 to 2.0. The x-axis lists three categories: C F R E T, C F Day, and C F Night.
* For C F R E T, the blue equal-weighted bar is 1.53 and the gray value-weighted bar is 0.63.
* For C F Day, the blue bar is 1.47 and the gray bar is 0.72.
* For C F Night, the blue bar is minus 0.23 and the gray bar is minus 0.14.
Graph B, titled Carhart alpha, has a y-axis labeled Carhart alpha percentage ranging from minus 1.0 to 2.0. The x-axis lists the same three categories.
* For C F R E T, the blue equal-weighted bar is 1.69 and the gray value-weighted bar is 0.75.
* For C F Day, the blue bar is 1.71 and the gray bar is 0.95.
* For C F Night, the blue bar is minus 0.53 and the gray bar is minus 0.44.
A shared legend at the bottom of both panels indicates that blue bars represent Equal weighted and gray bars represent Value weighted.

Table 2 Long description
The table is divided into two main sections: Panel A (Value-Weighted) and Panel B (Equal-Weighted). Each panel contains rows for quintiles Low, 2, 3, 4, High, and a High-low difference row. The columns are grouped into three main performance metrics: Excess Return, Carhart Alpha, and F F 7 Alpha. Each metric is further subdivided into C F R E T, C F Day, and C F Night.
In Panel A (Value-Weighted):
* The High-low row shows an Excess Return of 0.634 for C F R E T (t-stat 2.11) and 0.715 for C F Day (t-stat 2.71).
* Carhart Alpha for the High-low row is 0.764 for C F R E T (t-stat 2.62) and 0.948 for C F Day (t-stat 3.53).
* F F 7 Alpha for the High-low row is 0.929 for C F R E T (t-stat 3.89) and 1.013 for C F Day (t-stat 4.11).
In Panel B (Equal-Weighted):
* The High-low row shows significantly higher returns: Excess Return of 1.526 for C F R E T (t-stat 4.50) and 1.473 for C F Day (t-stat 5.31).
* Carhart Alpha for the High-low row is 1.689 for C F R E T (t-stat 5.55) and 1.710 for C F Day (t-stat 6.80).
* F F 7 Alpha for the High-low row is 1.862 for C F R E T (t-stat 6.45) and 1.695 for C F Day (t-stat 6.83).
Across both panels, C F Night values for the High-low difference are generally negative or statistically insignificant, such as -0.526 (t-stat -2.46) for Carhart Alpha in Panel B.
Regarding the intraday component of peer stocks’ returns, I find that CF Day positively and significantly predicts focal stocks’ future returns. The long-short CF Day strategy earns a higher and more robust return than the 24-hour signal (CF RET) under the value-weighting scheme. For instance, the Carhart alpha of the CF Day strategy in my sample period is 0.95% (
$ t $
 = 3.53), surpassing the return of the CF RET strategy by 19 bps. For equal-weighted returns, strategies based on CF Day and CF RET exhibit a similar performance and attain statistical significance at the 1% level.
The relationship between CF Night and the future returns of focal stocks differs sharply. In particular, the long-short strategy based on CF Night fails to generate positive profits. If any, the average monthly return is negative and statistically insignificant, regardless of whether value weighting or equal weighting is applied. Moreover, CF Night even generates a significantly negative return after adjusting for the Carhart factors. The 4-factor alpha of the CF Night strategy is −0.44% (
$ t $
 = −1.85) for value-weighted portfolios and −0.53% (
$ t $
 = −2.46) for equal-weighted portfolios.Footnote
10 The 7-factor alpha exhibits a small magnitude, with
$ t $
 -statistics less than 1 in absolute value.
As a robustness test, Figure 3 presents portfolio returns under alternative inter-firm connection specifications. Consistent with the shared analyst coverage setting, cross-firm return predictability emerges only when the signal is based on intraday returns. For instance, when firms are linked by the Fama–French 49 industry classification (INDFF), the long-short strategy constructed with INDFF Day earns an average close-to-close return of 68 bps per month (
$ t $
 = 3.68), whereas the strategy return based on INDFF Night is −0.002% (
$ t $
 = −0.01). Similar patterns obtain across the other linkage specifications.
Figure 3 presents the lead–lag returns relationship of settings based on the Fama–French 49 industry classification (INDFF), the 3-digit SIC codes industry classification (INDSIC), the text-based industry classification (INDTIC), geographic links (GEO), technological links (TECH), and conglomerate firms (CONGLM). For each setting, stocks each month are divided into five groups based on the 24-hour signal, the day signal, and the night signal, respectively. Then, equal-weighted portfolios are formed and held for 1 month. This figure reports profits of the long-short strategy measured by close-to-close returns. The sample period is from July 1992 to December 2021.

Figure 3 Long description
The Y axis represents Close-to-close return in percentage, ranging from 0.0 to 1.0. The X axis lists six categories: I N D F F, I N D S I C, I N D T I C, G E O, T E C H, and C O N G L M. A legend at the bottom identifies three bars for each category: 24-hour signal in gray, Day signal in light blue, and Night signal in dark blue.
* I N D F F: Gray bar at approximately 0.75, light blue at 0.68, and dark blue is negligible near 0.
* I N D S I C: Gray bar at 0.85, light blue at 0.81, and dark blue at 0.14.
* I N D T I C: Gray bar at 0.96, light blue at 0.85, and dark blue at 0.18.
* G E O: Gray bar at 0.44, light blue at 0.32, and dark blue shows a slight negative return below 0.
* T E C H: Gray bar at 0.57, light blue at 0.50, and dark blue at 0.08.
* C O N G L M: Gray bar at 0.34, light blue at 0.31, and dark blue at 0.11.
Across all categories, the 24-hour signal consistently yields the highest returns, followed by the Day signal, while the Night signal yields the lowest returns.
B. Fama–MacBeth Regressions
Table 3 reports the Fama–MacBeth regression results of shared analyst coverage signals. In particular, I control for the focal stock’s own past monthly return using two specifications: I use the focal stock’s monthly close-to-close return (Ret CC) in columns 3 and 4, whereas I use the focal stock’s monthly intraday return (Ret Day) and monthly overnight return (Ret Night) in columns 5 and 6. Consistent with the portfolio analysis, CF RET is positively associated with future returns. The average slope is above 0.50 and highly significant.

Table 3 Long description
The table presents regression results for six models, labeled 1 through 6.
* C F R E T: Model 1 shows 0.556 with a t-statistic of 4.40. Model 3 shows 0.514 with a t-statistic of 5.03. Model 5 shows 0.518 with a t-statistic of 5.06.
* C F Day: Model 2 shows 0.615 with a t-statistic of 5.63. Model 4 shows 0.563 with a t-statistic of 6.30. Model 6 shows 0.573 with a t-statistic of 6.36.
* C F Night: Model 2 shows 0.073 with a t-statistic of 0.68. Model 4 shows 0.090 with a t-statistic of 1.06. Model 6 shows 0.084 with a t-statistic of 1.01.
* Ret C C: Indicated as Yes for models 3 and 4.
* Ret Day and Ret Night: Indicated as Yes for models 5 and 6.
* Controls: Indicated as Yes for models 3, 4, 5, and 6.
* Intercept: Values range from 1.023 to 1.048 across all models, with t-statistics between 3.38 and 3.46.
* Average R-squared percentage: Increases from 1.773 in model 1 to 5.909 in model 6.
* Average number of observations: 2,458 for models 1 and 2; 2,268 for models 3 through 6.
* C F Day minus C F Night: Model 2 shows 0.542 with a t-statistic of 5.21. Model 4 shows 0.473 with a t-statistic of 5.79. Model 6 shows 0.490 with a t-statistic of 6.06.
The predictive ability of CF Day remains robust after controlling for the focal stock’s own past intraday and overnight returns. Column 6 reports that a 1-standard-deviation increase in CF Day implies an increase in focal stocks’ future returns of 0.57% (
$ t $
 = 6.36). By contrast, CF Night is unrelated to focal stocks’ returns in the next month. The magnitude of the estimated coefficient on CF Night is minor and insignificant across all specifications.
It is worth noting that the findings in this section do not lead to a conclusion that the pricing of peer stocks’ overnight returns is more “correct” nor that intraday returns are more informative about fundamentals. I will show that the underlying mechanism is more complicated than a single-period narrative when it comes to cross-predictability. To elucidate this complexity, the analysis proceeds as follows: First, I decompose focal stocks’ subsequent returns to examine the realization process of predictability. Second, I investigate the demand and impact of professional and retail investors to characterize the dynamic formation of momentum spillovers. Finally, I examine the information content of peer stocks’ intraday and overnight returns to further substantiate the earlier findings. These tests provide a more comprehensive understanding of the intricate predictability patterns.
IV. The Cross-Firm Tug-of-War
This section examines when the strategy profit materializes to further investigate the source of cross-predictability. In particular, I separately track focal stocks’ future intraday and overnight returns based on peer stocks’ past price changes. I first construct one-sort portfolios to study the return performance during the two periods. Then, I conduct Fama–MacBeth regressions to control for other variables that potentially predict subsequent daytime and overnight performance. In particular, I control for focal stocks’ own past intraday and overnight returns (Lou et al. (Reference Lou, Polk and Skouras2019)) to assess the robustness of my findings. Finally, I summarize the results and discuss the decomposition of the cross-firm return predictability.
A. Portfolio Analysis
To examine the predictive ability of return signals from peer stocks for focal stocks’ future intraday and overnight performance, I begin by constructing one-sort portfolios. Specifically, stocks are sorted into five groups based on CF RET, CF Day, and CF Night, respectively. I then track future 1-month intraday and overnight returns of the quintile portfolios. Average returns and alphas of the long-short strategy are also computed for different return types.
Figure 4 illustrates the main findings discussed in this section. More detailed results are presented in Table 4. First, I find that the profitability of the CF RET strategy is mainly generated intraday. For value-weighted portfolios, the intraday return spread between the top and bottom CF RET quintiles is 49 bps (
$ t $
 = 2.10), whereas the overnight return spread is only 0.09% and insignificant. However, the relationship between CF RET and future intraday/overnight returns is not monotonic, despite the return difference between extreme quintiles being significant.
Figure 4 plots the average intraday and overnight returns of the shared analyst coverage strategies based on CF Day (Graph A) and CF Night (Graph B), respectively. Each month, two stocks are defined as connected if at least one analyst covered both stocks in the previous 12 months (Ali and Hirshleifer (Reference Ali and Hirshleifer2020)). CF Day and CF Night represent the intraday and overnight returns, respectively, of the connected-firm portfolio. Each month, stocks are sorted into quintiles based on CF Day (Graph A) and CF Night (Graph B). The return of the long-short strategy of buying stocks within the top quintile and selling those within the bottom quintile is calculated. Blue bars represent equal-weighted returns, whereas gray bars represent value-weighted returns. The sample period is from July 1992 to December 2021.

Figure 4 Long description
The figure consists of two side-by-side bar charts. Both charts use a y-axis representing Average return in percent, ranging from negative 2 to positive 2, with a zero baseline. The x-axis for both charts lists Intraday return and Overnight return. A legend at the bottom indicates blue bars for Equal weighted and gray bars for Value weighted.
Graph A, titled C F Day strategy, shows:
* For Intraday return, the blue bar is at 2.12 and the gray bar is at 0.96.
* For Overnight return, the blue bar is at negative 0.87 and the gray bar is at negative 0.31.
Graph B, titled C F Night strategy, shows:
* For Intraday return, the blue bar is at negative 2.00 and the gray bar is at negative 1.43.
* For Overnight return, the blue bar is at 2.08 and the gray bar is at 1.40.

Table 4 Long description
The table is divided into Panel A (Value-Weighted) and Panel B (Equal-Weighted). Each panel contains two main sections: Intraday and Overnight returns.
Panel A. Value-Weighted:
* Intraday C F R E T: Ranges from -0.466 (Low) to 0.027 (High), with an Excess Return of 0.493 and F F 7 Alpha of 0.682.
* Intraday C F Day: Ranges from -0.618 (Low) to 0.346 (High), with an Excess Return of 0.964 and F F 7 Alpha of 1.146.
* Intraday C F Night: Ranges from 0.648 (Low) to -0.784 (High), with an Excess Return of -1.431 and F F 7 Alpha of -1.271.
* Overnight C F R E T: Ranges from 0.844 (Low) to 0.934 (High), with an Excess Return of 0.090 and F F 7 Alpha of 0.201.
* Overnight C F Day: Ranges from 0.990 (Low) to 0.679 (High), with an Excess Return of -0.311 and F F 7 Alpha of -0.195.
* Overnight C F Night: Ranges from 0.177 (Low) to 1.573 (High), with an Excess Return of 1.397 and F F 7 Alpha of 1.528.
Panel B. Equal-Weighted:
* Intraday C F R E T: Ranges from -0.692 (Low) to 0.582 (High), with an Excess Return of 1.274 and F F 7 Alpha of 1.425.
* Intraday C F Day: Ranges from -1.081 (Low) to 1.043 (High), with an Excess Return of 2.123 and F F 7 Alpha of 2.205.
* Intraday C F Night: Ranges from 1.035 (Low) to -0.962 (High), with an Excess Return of -1.997 and F F 7 Alpha of -1.843.
* Overnight C F R E T: Ranges from 1.031 (Low) to 1.157 (High), with an Excess Return of 0.125 and F F 7 Alpha of 0.309.
* Overnight C F Day: Ranges from 1.509 (Low) to 0.640 (High), with an Excess Return of -0.868 and F F 7 Alpha of -0.742.
* Overnight C F Night: Ranges from 0.020 (Low) to 2.099 (High), with an Excess Return of 2.080 and F F 7 Alpha of 2.141.
T-statistics are provided in parentheses below each coefficient throughout the table.
My focus is on the cross-stock interaction between intraday and overnight returns. First, there is a tendency of continuation for overnight and intraday returns among connected firms: The past overnight (intraday) returns of peer stocks positively forecast the subsequent overnight (intraday) returns of focal stocks. For value-weighted portfolios, Panel A of Table 4 reports that the long-short strategy based on CF Night (CF Day) yields a monthly overnight (intraday) return of 1.40% (0.96%) with a
$ t $
 -statistic of 4.46 (3.97). The effect is stronger for equal-weighted portfolios, with a monthly overnight (intraday) return spread of 2.08% (2.12%).
Second, an asymmetric “reversal” effect is observed, wherein CF Night (CF Day) is negatively associated with future intraday (overnight) returns of focal stocks. In particular, this reversal effect is more pronounced and robust when using peer stocks’ overnight returns compared to peer stocks’ intraday returns. The value-weighted CF Night strategy generates a monthly intraday return of −1.43% (
$ t $
 = −5.63), whereas the overnight return spread of the CF Day strategy is only −0.31% and marginally significant. Although the reversal effect of CF Day becomes more apparent (−0.87%) under equal weighting, it remains considerably weaker compared to CF Night (−1.99%). Notably, the intraday performance (1.40%) and overnight performance (−1.43%) of the CF Night strategy nearly offset each other, which explains the weak relationship between peer stocks’ overnight returns and focal stocks’ future close-to-close returns. While CF Day positively predicts focal stocks’ future intraday returns, the reversal in future overnight returns is much weaker. This gives rise to the positive and strong predictive ability of peer stocks’ intraday returns.
Figure 5 presents intraday and overnight strategy returns constructed from alternative economic linkage signals. The asymmetric cross-firm tug-of-war exists across these settings. Strategies based on peer firms’ overnight returns earn positive returns overnight but negative returns intraday, with the magnitudes of the two legs broadly comparable. Intraday signals, in turn, are positively related to subsequent intraday returns, while their negative association with overnight returns is generally modest. Overall, these patterns are consistent with the findings under the shared analyst coverage setting.
Graphs A and B of Figure 5 present the lead–lag returns relationship of settings based on the Fama–French 49 industry classification (INDFF), the 3-digit SIC codes industry classification (INDSIC), the text-based industry classification (INDTIC), geographic links (GEO), technological links (TECH), and conglomerate firms (CONGLM). For each setting, stocks each month are divided into five groups based on the 24-hour signal, the day signal, and the night signal, respectively. Then, equal-weighted portfolios are formed and held for 1 month. This figure reports profits of the long-short strategy measured by intraday returns and overnight returns. The sample period is from July 1992 to December 2021.

Figure 5 Long description
A two-panel figure consisting of Graph A and Graph B. Both graphs share a common x-axis with six categories: I N D F F, I N D S I C, I N D T I C, G E O, T E C H, and C O N G L M. A legend at the bottom identifies three bar types: grey for 24-hour signal, light blue for Day signal, and dark blue for Night signal.
Graph A, titled Intraday return, has a y-axis ranging from minus 1.0 to 1.0 percent. For all six categories, the 24-hour and Day signals show positive returns, while the Night signal shows negative returns. The T E C H category shows the most extreme negative intraday return for the Night signal, reaching approximately minus 1.0 percent.
Graph B, titled Overnight return, has a y-axis ranging from minus 1.0 to 1.0 percent. In this panel, the pattern is reversed: the 24-hour and Night signals show positive returns, while the Day signal shows negative returns. The T E C H category shows the highest positive overnight return for the Night signal, exceeding 1.0 percent, and the most negative return for the Day signal at approximately minus 0.3 percent.
B. Predicting Intraday and Overnight Returns in Regressions
Although the portfolio sorts approach is robust and does not impose a functional form on the relation I aim to study, it has difficulty controlling for other firm characteristics. In particular, focal stocks’ own past intraday/overnight returns are important confounding factors that could affect the result. Therefore, I conduct Fama–MacBeth regressions that use intraday/overnight signals to forecast focal stocks’ future intraday/overnight returns and control for other potential return predictors.
As a benchmark, I examine the predictive ability of CF RET, CF Day, and CF Night in regressions without controlling for the focal stocks’ own past intraday or overnight returns. Table 5 reports the results. Also reported are the (scaled) difference between and the (scaled) sum of the coefficients from forecasting intraday returns and forecasting overnight returns (Lou et al. (Reference Lou, Polk and Skouras2019)). The top row reports that CF RET positively predicts future overnight returns and intraday returns after controlling for other firm characteristics. The difference in the estimate between intraday and overnight is positive and significant, which is consistent with the portfolio result reported in Table 4.

Table 5 Long description
The table is organized into six columns. Columns 1 and 2 represent Intraday returns. Columns 3 and 4 represent Overnight returns. Column 5 is Intraday minus Overnight (Scaled). Column 6 is Intraday plus Overnight (Scaled).
Row-by-row data:
* C F R E T: Column 1 is 0.340 (4.51). Column 3 is 0.168 (4.36). Column 5 is 1.024 (4.03). Column 6 is 1.485 (4.93).
* C F Day: Column 2 is 0.537 (7.00). Column 4 is 0.010 (0.37). Column 5 is 1.971 (7.20). Column 6 is 1.997 (7.02).
* C F Night: Column 2 is minus 0.304 (minus 4.88). Column 4 is 0.439 (8.18). Column 5 is minus 1.723 (minus 7.56). Column 6 is minus 0.519 (minus 2.17).
* Controls: Columns 1 through 4 are marked Yes.
* Intercept: Column 1 is 0.857 (3.44). Column 2 is 0.842 (3.37). Column 3 is 0.663 (3.12). Column 4 is 0.672 (3.15).
* Average R-squared (%): Column 1 is 5.494. Column 2 is 5.953. Column 3 is 3.477. Column 4 is 3.783.
* Average number of observations: 2,268 for columns 1 through 4.
For the intraday return signal, Table 5 reports that CF Day positively predicts focal stocks’ future intraday returns. A 1-standard-deviation increase in CF Day is associated with an increase in future intraday returns of 0.54%. Importantly, column 4 suggests that CF Day is not negatively related to future overnight returns after controlling for peer stocks’ past overnight returns and focal stocks’ other characteristics in regressions. The estimated coefficient on CF Day is 0.01 when forecasting overnight returns, representing only 2% of the magnitude of the estimate from forecasting intraday returns. The difference in the average slope of CF Day between intraday return regressions and overnight return regressions is also positive and significant.
For the overnight return signal, Table 5 suggests both a strong “continuation” in overnight returns and a stable “reversal” in intraday returns. Specifically, CF Night significantly predicts focal stocks’ future intraday (overnight) returns in the opposite (same) direction. Columns 2 and 4 report that a 1-standard-deviation increase in CF Night implies a 30 bps decrease (
$ t $
 = −4.88) in future intraday returns and a 44 bps (
$ t $
 = 8.18) increase in future overnight returns.
Next, I control for the focal stock’s own past monthly intraday return (Ret Day) and overnight return (Ret Night) as additional control variables.Footnote
11 This allows me to directly control for the own-firm tug-of-war effect of Lou et al. (Reference Lou, Polk and Skouras2019). Table 6 reports the main results. For focal stocks’ future intraday returns, I find that peer stocks’ past returns still have strong predictive power. The estimated coefficient on CF Night (CF Day) is significantly negative (positive) at the 1% level. For focal stocks’ future overnight returns, the estimated coefficient on CF Night is positive and robust. Similarly, I do not detect any overnight reversal effect using peer stocks’ intraday returns. When predicting focal stocks’ overnight returns, the estimated coefficient on CF Day is positive (0.096) and significantly smaller than the estimate from predicting intraday returns (0.444). Moreover, the (scaled) sum of coefficients on CF Night of predicting future intraday and overnight returns becomes insignificant (
$ t $
 = −1.49), consistent with the lack of predictive power of peer stocks’ overnight returns for focal stocks’ close-to-close returns.

Table 6 Long description
The table presents regression coefficients with t-statistics in parentheses below them.
Columns are numbered 1 through 6:
* Columns 1 and 2: Intraday returns.
* Columns 3 and 4: Overnight returns.
* Column 5: Intraday minus Overnight (Scaled).
* Column 6: Intraday plus Overnight (Scaled).
Row-wise data for key variables:
* C F R E T: 0.288 (3.84) in column 1; 0.208 (5.53) in column 3; 0.776 (3.07) in column 5; 1.347 (4.50) in column 6.
* C F Day: 0.444 (6.09) in column 2; 0.096 (3.54) in column 4; 1.508 (5.87) in column 5; 1.772 (6.42) in column 6.
* C F Night: -0.225 (-3.72) in column 2; 0.347 (8.01) in column 4; -1.309 (-6.22) in column 5; -0.356 (-1.49) in column 6.
Fixed effects and controls (indicated by Yes for columns 1-4):
* Ret Day: Yes in columns 1, 2, 3, 4.
* Ret Night: Yes in columns 1, 2, 3, 4.
* Controls: Yes in columns 1, 2, 3, 4.
Model Statistics for columns 1 through 4:
* Intercept: Values range from 0.693 to 0.834 with t-statistics between 3.25 and 3.35.
* Average R-squared percentage: 6.534 (Col 1), 6.906 (Col 2), 5.678 (Col 3), 5.873 (Col 4).
* Average number of observations: 2,268 for all four primary models.
Overall, the regression results suggest an asymmetric tug-of-war (Lou et al. (Reference Lou, Polk and Skouras2019)) pattern in the context of cross-predictability: i) an inter-firm continuation of overnight and intraday returns; ii) an inter-firm daytime reversal effect: high CF Night with low subsequent intraday returns; and iii) minor inter-firm overnight response: high CF Day followed by weak overnight price reactions.
C. Decomposing Cross-Firm Return Predictability
Based on previous findings, the lead–lag effect among connected stocks can be decomposed into four components, using the intraday and overnight signals of peer stocks, as well as the intraday and overnight returns of the focal stock.Footnote 12 First, CF Night positively (negatively) forecasts focal stocks’ future overnight (intraday) returns with a comparable magnitude. Second, CF Day positively predicts focal stocks’ future intraday returns but does not exhibit clear negative predictive power for overnight returns. Consequently, CF Night is not significantly associated with future close-to-close returns as focal stocks’ intraday and overnight price reactions offset each other. CF Day generates a strong lead–lag returns relation since its positive predictive power for intraday returns dominates.
This asymmetric tug-of-war pattern is consistent with the 2-clientele perspective of Lou et al. (Reference Lou, Polk and Skouras2019) and Lou et al. (Reference Lou, Polk and Skouras2024), and further suggests that trades among professional and retail investors contribute to the making of cross-predictability. Specifically, the focal stock’s subsequent opening price continues to deviate from the fundamental value since individual traders are prone to being attracted by salient news and engage in persistent speculative trading.Footnote 13 However, professional investors, who probably hold different perspectives on the focal stock and disagree with the opening price, dominate the market during the daytime period. As a result, focal stocks’ intraday returns would exhibit an opposite movement due to the mismatch of effective demand.
For peer stocks’ intraday returns, the delayed trading by intraday investors leads to the cross-stock continuation of intraday returns, which corrects focal stocks’ prices, and anomaly returns result. As retail investors are attracted by overnight news more and overlook peer stocks’ intraday returns, the focal stock’s subsequent overnight return does not react significantly. Overall, the difference between intraday traders (more likely to be professional arbitrageurs) and overnight traders (more likely to be individuals) in their demands generates the observed cross-predictability pattern.
Figure 6 presents an example illustrating the mechanism discussed in this section. The decomposition results suggest several testable predictions regarding the story. First, CF Night should be positively associated with retail investors’ trading, whereas institutions do not trade on overnight returns accordingly. Second, CF Day should be positively associated with professional trading, while retail investors do not react to intraday returns. Third, CF Night attracts retail investor attention more than CF Day does. Lastly, trading by daytime investors implies more accurate fundamentals for focal stocks, as it represents the correction of mispricing, whereas trades by overnight investors are driven by attention-grabbing signals. I test these predictions in Section V.
Figure 6 depicts the mechanism underlying cross-predictability among economically linked stocks. For illustration, it considers scenarios of positive shocks to peer stocks’ overnight returns or intraday returns.

Figure 6 Long description
The diagram is divided into four quadrants by dashed lines.
Vertical Axis Labels (Left):
- Top: Peer overnight shock with an upward arrow.
- Bottom: Peer intraday shock with an upward arrow.
Horizontal Axis Labels (Top):
- Left: Focal open.
- Right: Focal intraday.
Quadrant Data:
- Top-Left (Peer overnight shock and Focal open): Price inflates with an upward arrow. Below this is a box containing the text ‘Persistent retail demand’ and ‘Overnight signal draws attention’.
- Top-Right (Peer overnight shock and Focal intraday): Reversal with a downward arrow. Below this is a box containing the text ‘Institutional constrains’ and ‘Intraday price correction’.
- Bottom-Left (Peer intraday shock and Focal open): Minor reaction with a tilde symbol.
- Bottom-Right (Peer intraday shock and Focal intraday): Momentum with an upward arrow.
The proposed mechanism suggests that behavioral bias-induced mispricing (e.g., Barberis, Shleifer, and Vishny (Reference Barberis, Shleifer and Vishny1998), Daniel, Hirshleifer, and Subrahmanyam (Reference Daniel, Hirshleifer and Subrahmanyam1998)) may not be the dominant driver of overall cross-firm momentum. The principal force, continuation of intraday returns across economically linked firms, is consistent with the slow movement of capital to trading opportunities (Mitchell et al. (Reference Mitchell, Pedersen and Pulvino2007), Duffie (Reference Duffie2010)). Market frictions and capital constraints can prevent institutional investors from fully exploiting the information they are able to process (Cohen, Gompers, and Vuolteenaho (Reference Cohen, Gompers and Vuolteenaho2002), Lewellen (Reference Lewellen2011), and Cao, Han, and Wang (Reference Cao, Han and Wang2017)), generating spillovers across connected stocks.Footnote 14 The story in this article highlights the role of institutional impediments, beyond behavioral inattention, in shaping price dynamics in an interconnected market.
V. Inspecting the Mechanisms
In this section, I provide further evidence to examine the mechanisms underlying the overnight–intraday patterns of cross-stock return predictability. In particular, I will show the difference between peer stocks’ intraday and overnight returns in predicting institutional investors’ recognition and trading, retail investors’ attention and purchase, and different types of order imbalance. I further distinguish the impact of professional trades and retail demands based on flows to mutual funds and hedge funds. I justify the trading behavior of professional and retail investors by examining focal stocks’ realized fundamentals and intraday patterns of strategy returns. Finally, I conduct additional robustness tests. Unless otherwise noted, I control for focal stocks’ own intraday and overnight returns in all regressions.
A. Evidence from Institutional Investors’ Recognition and Trading
First, I validate the slow-moving arbitrage channel by examining the response of institutional investors. Prior research suggests that stock visibility and investor recognition are associated with an increase in the breadth of ownership (Merton (Reference Merton1987), Chen et al. (Reference Chen, Hong and Stein2002), and Grullon, Kanatas, and Weston (Reference Grullon, Kanatas and Weston2004)). The testable prediction from my hypothesis is that the breadth of institutional ownership should react to peer stocks’ intraday returns. Correspondingly, institutional investors would trade the focal stock based on CF Day as well.
To test this channel, I estimate the following regressions:

where
$ \Delta {\mathrm{BD}}_{i,q+1} $
 is quarterly changes in the breadth of institutional investor ownership (Chen et al. (Reference Chen, Hong and Stein2002), Lehavy and Sloan (Reference Lehavy and Sloan2008)) and
$ \Delta {\mathrm{INST}}_{i,q+1} $
 is quarterly changes in institutional ownership, measuring institutional investors’ trading (Edelen et al. (Reference Edelen, Ince and Kadlec2016)). Our hypothesis posits that
$ {\beta}_{Day}>0 $
 . Importantly, the association between institutional investors’ subsequent trading and peer stocks’ returns should be more pronounced for the intraday component than for the overnight component. Therefore, we also expect that
$ {\beta}_{Day}>{\beta}_{Night} $
 .
Table 7 reports the regression results. Columns 1–4 examine the subsequent change in the breadth of institutional investor ownership. First, I find that peer stocks’ close-to-close returns (CF RET) are positively associated with future increases in institutional investor recognition. More importantly, it shows that CF Day positively forecasts subsequent
$ \Delta $
 BD, while CF Night is unrelated to future changes in the breadth of ownership. The difference in the estimated coefficients between CF Day and CF Night is significantly positive. A similar pattern is observed when predicting institutional investors’ subsequent trading. For example, column 7 reports that a 1-standard-deviation increase in lagged peer stocks’ intraday returns is associated with a future increase in institutional ownership of 0.045%. In sharp contrast, the response of institutional trading to a 1-standard-deviation increase in peer stocks’ overnight returns is −0.009%.

Table 7 Long description
The table is divided into two main sections: Delta B D (Models 1 to 4) and Delta I N S T (Models 5 to 8).
Row 1: C F R E T. Models 1 and 2 show 0.018 (t-stats 4.03 and 3.91). Models 5 and 6 show 0.047 and 0.050 (t-stats 2.04 and 2.09).
Row 2: C F Day. Models 3 and 4 show 0.017 and 0.018 (t-stats 3.93 and 3.88). Models 7 and 8 show 0.045 and 0.055 (t-stats 2.01 and 2.38).
Row 3: C F Night. Models 3 and 4 show 0.006 and 0.005 (t-stats 1.49 and 1.15). Models 7 and 8 show minus 0.009 and minus 0.027 (t-stats minus 0.42 and minus 1.26).
Row 4: Controls. All models include controls (indicated by Yes).
Row 5: Year-quarter F E. All models include year-quarter fixed effects (indicated by Yes).
Row 6: Industry F E. Models 2, 4, 6, and 8 include industry fixed effects (indicated by Yes).
Row 7: N (Observations). Ranges from 250,384 to 262,501 across all models.
Row 8: Adjusted R-squared. All models show 0.09.
Row 9: Beta sub Day minus Beta sub Night. Models 3 and 4 show 0.011 and 0.013 (t-stats 2.89 and 3.27). Models 7 and 8 show 0.054 and 0.082 (t-stats 2.11 and 3.19).
Overall, the difference in institutional investors’ response to peer stocks’ intraday and overnight returns supports the notion that institutions gradually execute arbitrage trading, and their trades do not rely on peer stocks’ overnight returns. As a result, focal stocks’ prices are corrected during the subsequent daytime period (i.e., a cross-stock continuation of intraday returns). Since the intraday effective demand does not match the opening price, a cross-stock daytime reversal occurs as prices converge to the fundamental value.Footnote 15
B. Evidence from Retail Investors’ Attention and Purchase
Section V.A supports the relevance between professional investors and intraday returns. In this section, I examine the relationship between retail investors and overnight returns. Specifically, previous studies demonstrate that overnight returns trigger retail investors’ attention (Berkman et al. (Reference Berkman, Koch, Tuttle and Zhang2012), Engelberg et al. (Reference Engelberg, Sasseville and Williams2012), Aboody et al. (Reference Aboody, Even-Tov, Lehavy and Trueman2018)), and the trading preference of retail investors is persistent (Barber et al. (Reference Barber, Odean and Zhu2008), Aboody et al. (Reference Aboody, Even-Tov, Lehavy and Trueman2018), Dong and Yang (Reference Dong and Yang2023), Laarits and Sammon (Reference Laarits and Sammon2025), and McLean et al. (Reference McLean, Pontiff and Reilly2025b)). Therefore, we would expect the magnitude of CF Night to be positively related to future retail investor attention, and that CF Night positively predicts retail investors’ purchase behavior. I estimate the following regressions:

where
$ {\mathrm{Attention}}_{i,t+1} $
 is the retail investor’s attention measured by abnormal Google search volume (Da et al. (Reference Da, Engelberg and Gao2011)) and
$ \mathrm{Net}\hskip0.3em {\mathrm{purchase}}_{i,t+1} $
 is calculated as the difference between retail buy volume and sell volume, divided by shares outstanding. We expect that
$ {\beta}_{Night}>0 $
 . Moreover, the relationship between retail investors and peer stocks’ returns should be more pronounced for the overnight component than for the intraday component (i.e.,
$ {\beta}_{Night}>{\beta}_{Day} $
 ).
Table 8 reports the regression results. The first 2 columns report that peer stocks’ close-to-close returns are unrelated to retail investors’ attention to the focal stock. When we separate the intraday and overnight components, however, columns 3 and 4 suggest a positive and significant relationship between the magnitude of peer stocks’ overnight returns (
$ \mid $
 CF Night
$ \mid $
 ) and retail investor attention. On the contrary, peer stocks’ intraday returns do not facilitate attraction to the focal stock; if any, the estimated coefficient on
$ \mid $
 CF Day
$ \mid $
 is negative and insignificant. The last 4 columns examine retail investors’ trading behavior. I find that retail investors tend to purchase the focal stock after experiencing a high peer stock return, a pattern predominantly driven by the overnight component. For example, column 7 reports that a 1-standard-deviation increase in lagged CF Night implies an increase of 0.284 bps in net purchase of retail investors (
$ t $
 = 5.20), whereas the effect from CF Day is only 0.020 (
$ t $
 = 0.38). The difference in the estimated coefficients between CF Day and CF Night is −0.264 and statistically significant (
$ t $
 = −3.50).

Table 8 Long description
The table is divided into two main sections: Attention (columns 1 to 4) and Net Purchase (columns 5 to 8).
Key variables and their coefficients (with t-statistics in parentheses) include:
* C F R E T: 0.128 (0.71) in column 1 and 0.062 (0.32) in column 2 for Attention; 0.129 (2.53) in column 5 and 0.163 (3.27) in column 6 for Net Purchase.
* C F Day: -0.273 (-1.64) in column 3 and -0.282 (-1.59) in column 4 for Attention; 0.020 (0.38) in column 7 and 0.081 (1.57) in column 8 for Net Purchase.
* C F Night: 0.491 (2.75) in column 3 and 0.414 (2.12) in column 4 for Attention; 0.284 (5.20) in column 7 and 0.235 (4.51) in column 8 for Net Purchase.
Fixed Effects and Controls:
* Controls and Year-month F E are applied across all 8 models.
* Industry F E is applied in models 2, 4, 6, and 8.
Summary Statistics:
* N (sample size) ranges from 318,166 to 401,676.
* Adjusted R-squared is 0.05 for Attention models and 0.02 for Net Purchase models.
* The difference between beta Day and beta Night is negative across all applicable models, ranging from -0.154 to -0.764.
C. Evidence from Order Imbalance
This section further studies the difference in the demand between retail and professional investors. I examine two types of trading metrics: retail order imbalance and total order imbalance. As in Section V.B, retail trades are identified by the Boehmer et al. (Reference Boehmer, Jones, Zhang and Zhang2021) algorithm. While it is challenging to directly identify professional investors’ trades, the difference in the variation between retail order imbalance and total order imbalance would proxy for the trading behavior of more sophisticated investors. I examine the relationship between peer stocks’ returns and the focal stock’s subsequent order imbalance by estimating the following regression:

We expect that
$ {\beta}_{Night}>0 $
 and
$ {\beta}_{Night}>{\beta}_{Day} $
 for retail order imbalance, whereas
$ {\beta}_{Day}>0 $
 and
$ {\beta}_{Day}>{\beta}_{Night} $
 for total order imbalance.
Table 9 reports the regression results. The first 6 columns report the result based on retail order imbalance. Consistent with prior analysis, peer stocks’ returns positively predict retail investors’ purchases, and this process is primarily driven by the overnight component: The estimated coefficient on CF Night is positive and highly significant, whereas the coefficient on CF Day is minor. For total order imbalance, where professional traders hold greater sway, the pattern completely reverses. Specifically, columns 8, 10, and 12 report that CF Day positively and significantly predicts focal stocks’ total order imbalance, whereas the coefficient on CF Night is negative, albeit insignificant. In all specifications, the difference in the estimated coefficients between CF Day and CF Night is significantly different from zero. This difference changes from negative to positive when shifting from retail order imbalance to total order imbalance.

Table 9 Long description
The table is structured with two primary super-headers: Retail Order Imbalance (columns 1 to 6) and Total Order Imbalance (columns 7 to 12). Each category is further divided into Trade, Volume, and Value, with numbered sub-columns.
Key data rows include:
* C F R E T: Shows coefficients of 0.129 (Trade), 0.147 (Volume), and 0.147 (Value) for Retail, and 0.047 (Trade), 0.057 (Volume), and 0.057 (Value) for Total. T-statistics are provided in parentheses below each coefficient.
* C F Day: Retail coefficients are 0.036 (Trade), 0.043 (Volume), and 0.042 (Value). Total coefficients are 0.048 (Trade), 0.046 (Volume), and 0.045 (Value).
* C F Night: Retail coefficients are 0.249 (Trade), 0.263 (Volume), and 0.265 (Value). Total coefficients are negative: minus 0.025 (Trade), minus 0.010 (Volume), and minus 0.007 (Value).
* Controls and Year-month F E: Both rows indicate ‘Yes’ across all columns.
* N (Observations): 353,810 for Retail columns and 353,824 for Total columns.
* Adjusted R-squared: Ranges from 0.04 to 0.06.
* Beta Day minus Beta Night: Shows negative values for Retail (e.g., minus 0.213 for Trade) and positive values for Total (e.g., 0.073 for Trade).
I also conduct two additional robustness tests. First, I examine order imbalance based on non-retail trades. Specifically, I define non-retail trades as total trades minus retail trades. Then, the non-retail order imbalance is calculated as non-retail buys minus non-retail sells, divided by the sum of non-retail buys and non-retail sells. Second, I examine institutional trading flows. Campbell, Ramadorai, and Schwartz (Reference Campbell, Ramadorai and Schwartz2009) estimate trading flows by mapping trades of different sizes into implied changes in institutional ownership. I obtain data on institutional trading flows from Tarun Ramadorai’s website.Footnote 16 Consistent with the result using total order imbalance, Supplementary Material Tables A2 and A3 report that CF Day positively predicts subsequent non-retail order imbalance and institutional trading flows, whereas CF Night is negatively associated with these two additional trading metrics.
In sum, these findings support the mechanism discussed in Section IV.C: i) Retail investors’ persistent trading on peer stocks’ overnight returns leads to the cross-stock overnight return continuation; ii) professional investors’ trades do not align with peer stocks’ overnight returns, leaving effective intraday demand unable to sustain the deviated opening prices, which in turn generates cross-stock daytime reversals; iii) professional investors’ subsequent trading corrects prices, whereas retail investors overlook peer stocks’ intraday returns, resulting in the cross-stock intraday return continuation but marginal overnight price reactions.
D. Evidence from Flows to Mutual Funds and Hedge Funds
An alternative way to differentiate the impact of retail versus more sophisticated investors’ demand is by analyzing fund flows (Frazzini and Lamont (Reference Frazzini and Lamont2008), Jagannathan, Malakhov, and Novikov (Reference Jagannathan, Malakhov and Novikov2010), Lou (Reference Lou2012), Akbas et al. (Reference Akbas, Armstrong, Sorescu and Subrahmanyam2015), and Barber, Huang, and Odean (Reference Barber, Huang and Odean2016)). For instance, Akbas et al. (Reference Akbas, Armstrong, Sorescu and Subrahmanyam2015) use mutual fund flows to proxy for “dumb” money and hedge fund flows as a proxy for “smart” money. This approach enables me to examine potential time variation in the predictability of intraday and overnight returns across firms.
Specifically, increases in mutual fund flows imply intensified retail investor participation, and fund managers also tend to purchase stocks that align with retail investors’ attention (Lou (Reference Lou2012), Agarwal, Jiang, and Wen (Reference Agarwal, Jiang and Wen2022)). This implies that increased mutual fund flows should predict a stronger cross-firm continuation of overnight returns.Footnote 17 Accordingly, the cross-firm daytime reversal effect should also be more pronounced, as the opening price deviates further from the fundamental value. In contrast, increased hedge fund flows should be associated with a stronger cross-firm continuation of intraday returns, driven by greater entry of arbitrage capital and, consequently, more effective price correction.
In Table 10, I conduct several time-series regressions to investigate the time variation in different components of return predictability, specifically the cross-firm tug-of-war (ToW), based on flows to mutual funds (MFFLOW) and flows to hedge funds (HFFLOW):

where
$ {ToW}_{t+1} $
 represents the intraday/overnight return of the high-minus-low portfolio formed by CF Night/CF Day, as previously examined in Table 4: i) Night-to-Night, the overnight return of the high-minus-low portfolio formed by CF Night; ii) Night-to-Day, the intraday return of the high-minus-low portfolio formed by CF Night; iii) Day-to-Night, the overnight return of the high-minus-low portfolio formed by CF Day; and iv) Day-to-Day, the intraday return of the high-minus-low portfolio formed by CF Day.

Table 10 Long description
Fallback
Column 1 reports that MFFLOW is positively associated with the continuation of overnight returns, with the estimated coefficient (
$ {\beta}_{MF}^{\mathrm{Night}\hbox{-} \mathrm{to}\hbox{-} \mathrm{Night}} $
 ) being highly significant (
$ t $
 = 3.24). This suggests that trades driven by unsophisticated investors’ demand (i.e., “dumb money”) contribute to price distortions at market openings. Aligning with this result, column 2 reports that increased MFFLOW also leads to stronger daytime reversals (
$ {\beta}_{MF}^{\mathrm{Night}\hbox{-} \mathrm{to}\hbox{-} \mathrm{Day}} $
 = −0.672). In column 4, I examine the relationship between fund flows and intraday return continuation. The estimated coefficient on HFFLOW is positive and significant (
$ {\beta}_{HF}^{\mathrm{Day}\hbox{-} \mathrm{to}\hbox{-} \mathrm{Day}} $
 = 0.599), indicating that new flows of “smart money” facilitate price correction. Overall, the time variation in the cross-firm tug-of-war complements my previous findings that differences in demand between individual and professional traders are key drivers of the observed predictability patterns.
E. The Information Content of Peer Stocks’ Returns
As illustrated in Figure 6, the promise underlying the cross-firm tug-of-war is that professional investors’ delayed trading corrects prices, while retail investors’ persistent trading introduces price distortion. To justify this story, peer stocks’ high intraday returns should predict favorable fundamentals for focal stocks. For peer stocks’ overnight returns, there are two potential scenarios: i) Peer stocks’ overnight returns are pure noise and the cross-stock continuation of overnight returns merely reflects the persistency of sentiment, and ii) peer stocks’ overnight returns are informative about focal stocks’ fundamentals in different dimensions and retail investors overreact to these salient news.
In this section, I examine the difference between CF Day and CF Night in predicting focal stocks’ subsequent fundamentals by estimating the following regression:

I consider two types of fundamental variables. The first type focuses on focal firms’ earnings news and profitability, including standardized unexpected earnings (SUE), return-on-assets (ROA), and gross profitability (GP); the second type focuses on focal firms’ investment and growth potential, including asset growth (AG), sales growth (SG), and revenue growth (RG).
Table 11 reports the regression results. I find that peer stocks’ intraday returns positively and significantly predict focal stocks’ earnings and profitability in the next quarter, consistent with the arbitrage trading story. Interestingly, peer stocks’ overnight returns are also informative about focal stocks’ future profitability, but in the opposite direction. Specifically, CF Night negatively predicts SUE, ROA, and GP in the subsequent quarter, suggesting a potential overreaction by retail traders.

Table 11 Long description
A table with 12 numbered columns grouped under six main headers: S U E (columns 1 and 2), R O A (columns 3 and 4), G P (columns 5 and 6), A G (columns 7 and 8), S G (columns 9 and 10), and R G (columns 11 and 12).
Row data includes:
* C F Day: Positive coefficients for S U E, R O A, and G P (e.g., 5.362 for S U E column 1), and negative coefficients for A G, S G, and R G (e.g., minus 0.362 for A G column 7).
* C F Night: Negative coefficients for S U E, R O A, and G P (e.g., minus 4.876 for S U E column 1), and positive coefficients for A G, S G, and R G (e.g., 3.855 for A G column 7).
* Controls, Time F E, and Industry F E: Indicated as Yes for most models.
* N: Sample sizes ranging from 208,572 to 223,222.
* Adj. R super 2: Values ranging from 0.06 to 0.25.
* beta sub Day minus beta sub Night: Shows the difference between day and night coefficients, with positive values for S U E, R O A, and G P, and negative values for A G, S G, and R G. For example, S U E column 1 is 10.238 with a t-statistic of 5.78.
While CF Day is positively associated with focal stocks’ future profitability, Table 11 reports that peer stocks’ intraday return is not a strong predictor for growth in fundamentals. In contrast, CF Night positively and significantly forecasts focal stocks’ growth in total assets (AG), sales (SG), and revenues (RG). These results suggest that both peer stocks’ intraday and overnight returns are informative about focal stocks’ future fundamentals, but they differ substantially. The fact that CF Night positively predicts fundamental growth but negatively predicts profitability suggests that retail investors’ persistent trading tends to be driven by the salience of news and the pursuit of glamour stocks (e.g., Lakonishok et al. (Reference Lakonishok, Shleifer and Vishny1994), La Porta (Reference La Porta1996), La Porta, Lakonishok, Shleifer, and Vishny (Reference La Porta, Lakonishok, Shleifer and Vishny1997), and Barber and Odean (Reference Barber and Odean2008)). As a result, following high (low) CF Night, the focal stock’s opening price deviates upward (downward) from the rational benchmark because of retail investors’ continued trading. The focal stock’s price converges to the fundamental value when professional investors dominate the market (i.e., during the daytime) and value-relevant information is incorporated.
F. Evidence from Intraday Patterns
Previous tests focus on heterogeneous investor behavior. During the intraday period, professional arbitrageurs incorporate the information contained in CF Day and correct the mispricing triggered by CF Night. In this section, I delve into the intraday return patterns to further validate the story of this article.Footnote 18 Bogousslavsky (Reference Bogousslavsky2021) suggests that holding positions overnight is both costly and risky. Therefore, arbitrageurs who exploit mispricing typically initiate trades early in the day and then slow down activity or even reverse positions by the market close. As a result, mispricing is mainly corrected early in the day, while it tends to worsen toward the end of the day because of the price pressure from closing positions. My hypothesis, combined with the theory of Bogousslavsky (Reference Bogousslavsky2021), predicts two intraday patterns of cross-firm return predictability. The first is a direct implication of Bogousslavsky (Reference Bogousslavsky2021). We expect that the positive intraday returns of the CF Day strategy materialize mainly early in the day. Second, and more importantly, the cross-firm tug-of-war should exhibit a similar pattern. We expect that the negative intraday returns of the CF Night strategy also appear early in the day and then become attenuated or even reversed by the market close.
I decompose intraday returns into 15-minute intervals between 9:45am and 4:00pm, and then calculate interval returns based on quote midpoints.Footnote
19 For each stock-month, I calculate the cumulative return for each of these intraday intervals. Figure 7 presents intraday interval returns of strategies formed by CF Day and CF Night. Consistent with the channel of Bogousslavsky (Reference Bogousslavsky2021), the intraday return of the CF Day strategy is positive and significant for most intervals over the first half of the day. However, the return becomes negative during the last 15-minute interval. Moreover, the cross-firm tug-of-war displays a consistent pattern. The intraday return of the CF Night strategy is −0.368% (
$ t $
 = −4.72) and −0.344% (
$ t $
 = −6.84) per month in the first two 15-minute intervals, and tends to decline in magnitude throughout the day. In the last 15-minute interval, the CF Night strategy earns a significantly positive return of 0.144% (
$ t $
 = 5.99). These intraday patterns of cross-predictability align well with the argument of Bogousslavsky (Reference Bogousslavsky2021) and further support the story proposed in this article.
Graphs A and B of Figure 7 show the average interval returns and
$ t $
 -statistics of CF Day and CF Night strategies throughout the intraday period. For each trading day from 9:45AM to 4:00PM, I calculate 15-minute interval returns using midpoint prices. Then, I calculate cumulative interval returns within the month. At the end of each month, stocks are ranked into quintiles based on CF Day and CF Night, respectively. The CF Day (CF Night) strategy longs stocks within the top quintile and shorts those within the bottom quintile. This figure shows the performance of these strategies during different time intervals throughout the intraday period. The dashed lines in the Graph B indicate significance at the 10% level. The
$ t $
 -statistics are calculated based on Newey and West (Reference Newey and West1987) standard errors. Portfolios are rebalanced monthly, and stocks are equally weighted. The sample period is from January 1993 to December 2021.

Figure 7 Long description
The figure consists of two panels, Graph A and Graph B, both sharing a horizontal x-axis representing 15-minute time intervals from 09:45-10:00 to 15:45-16:00. A legend in both panels identifies light blue bars as C F Day and dark blue bars as C F Night.
Graph A. Mean return. The y-axis represents Mean return in percentage, ranging from -0.3 to 0.2.
* C F Day (light blue) starts with its highest positive return at the market open, gradually declining throughout the day, and ends with a negative return in the final 15:45-16:00 interval.
* C F Night (dark blue) starts with significant negative returns at the market open, which gradually move toward zero throughout the day, ending with a sharp positive spike in the final 15:45-16:00 interval.
Graph B. t-statistic. The y-axis represents the t-statistic, ranging from -6 to 6. Horizontal dashed lines are placed at 2 and -2 to indicate significance levels.
* C F Day (light blue) shows t-statistics that are consistently positive and often above the 2.0 threshold for most of the day, before dropping below zero in the final interval.
* C F Night (dark blue) shows t-statistics that are consistently negative and often below the -2.0 threshold for most of the day, before a large positive spike to approximately 6.0 in the final 15:45-16:00 interval.
G. Additional Robustness Tests
I conduct a series of robustness tests in Supplementary Material Appendix C to complement my main analysis. The first set of tests focuses on the cross-predictability patterns. Supplementary Material Appendix C1 shows that the inter-firm continuation of overnight returns and the inter-firm daytime reversal effect exhibit high persistence. This pattern aligns with retail investors’ trading being persistent. Supplementary Material Appendix C2 shows that the predictability result of this article is invariant to the choice of signal formation period or holding horizons. Supplementary Material Appendix C3 reports results using the volume-weighted average price in the first 15-minute interval of trading (9:30am to 9:45am) as the opening price. The asymmetric cross-firm tug-of-war pattern remains robust under this specification. Supplementary Material Appendix C4 further explores cross-predictability at the daily frequency. Supplementary Material Appendix C5 shows that my findings cannot be solely explained by the information discreteness channel (Da et al. (Reference Da, Gurun and Warachka2014), Huang et al. (Reference Huang, Lee, Song and Xiang2022)).
Second, I expand my analysis by implementing the empirical designs in two related studies. Burt and Hrdlicka (Reference Burt and Hrdlicka2021) propose a method of dissecting cross-stock predictability by decomposing signals into two components: i) a predictable component related to commonality in characteristics-based factors and ii) an idiosyncratic component reflecting news. They show that both components contribute almost equally to the monthly returns of the cross-predictability strategy. Therefore, underreaction to news is not the only source of this anomaly. Following their approach, I further decompose CF Day and CF Night into the Common component and the News component, and re-examine their predictive ability for subsequent returns. Aligning with the argument of Burt and Hrdlicka (Reference Burt and Hrdlicka2021), results in Supplementary Material Appendix C6 show that both components contribute significantly to the predictability pattern documented in this article.
Akbas et al. (Reference Akbas, Boehmer, Jiang and Koch2022) suggest that a prolonged tug-of-war reflects daytime arbitrageurs’ overcorrection behavior as they overweight the influence of noise trading on overnight returns. This story predicts that the focal stock tends to be underpriced if the cross-firm tug-of-war is intense. Consistent with this prediction, results in Supplementary Material Appendix C7 show that the abnormal frequency of cross-firm negative daytime reversals (i.e., a positive peer overnight return followed by the focal stock’s negative intraday return) positively predicts focal stocks’ future close-to-close returns.
VI. Conclusion
The lead–lag returns relationship among economically linked firms has received great attention in empirical asset pricing studies. As the literature is experiencing a surge in uncovering economic connections from multiple contexts, it is crucial to understand the generating process of cross-firm return predictability. This article shows an inter-firm, asymmetric tug-of-war (Lou et al. (Reference Lou, Polk and Skouras2019)), characterized by a strong continuation of overnight and intraday returns, a daytime reversal effect, but minor overnight price reactions. It follows that cross-predictability primarily relies on peer stocks’ intraday returns and disappears for peer stocks’ overnight returns.
These results highlight the importance of investor composition and demand shocks in generating the predictable return patterns among connected firms. The decomposition procedure could also serve as a tool for testing and categorizing new economic connections. It would be highly beneficial for future work to develop theoretical models to formalize the overnight–intraday price dynamics among linked stocks and unveil deeper mechanisms of interdependence in financial markets.
Supplementary Material
To view supplementary material for this article, please visit http://doi.org/10.1017/S002210902510238X.
Funding statement
I acknowledge financial support from the University of Macau (Grant No. SRG2025-00039-FBA).


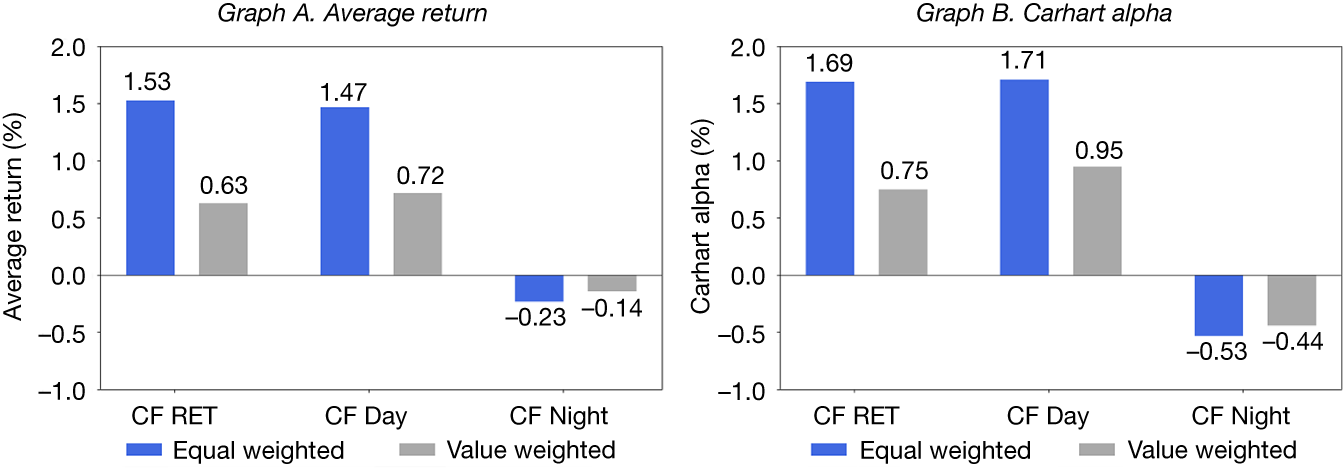

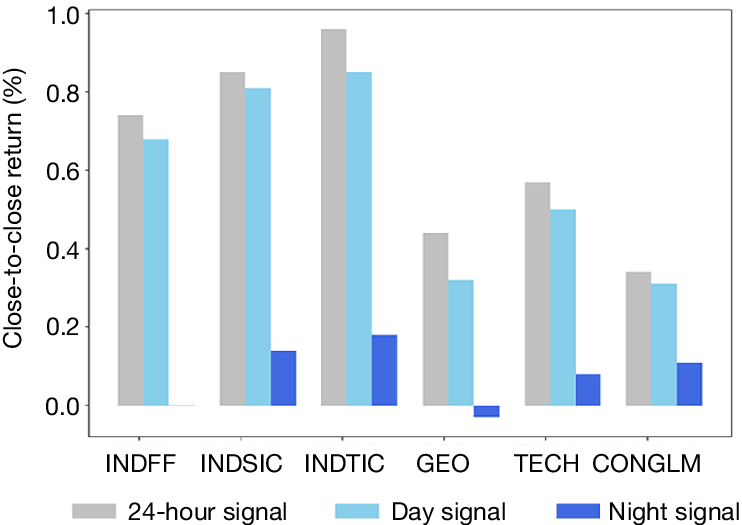


 Open access

