INTRODUCTION
The composition of sublittoral benthic macrofauna depends on interaction between biotic (food availability, colonizer larvae, predation and competition) and abiotic factors, such as salinity, temperature, depth, oxygen concentration, current speed, stochastic events or sediment grain size (Sanders, Reference Sanders1968; Cocito et al., Reference Cocito, Fanucci, Niccolai, Morri and Bianchi1990). Another important factor is the marine bottom relief, which affects deposition and suspension of particles, which in turn affect the trophic structure of the communities (Pearson, Reference Pearson2001). The effects of contamination on trophic structure can be difficult to detect in estuaries, since many opportunistic taxa show a facultative resistance to pollution stress (Rakocinski et al., Reference Rakocinski, Brown, Gaston, Heard, Walker and Summers2000). Nevertheless, trophic structure has been largely studied since it is a good indicator of physical characteristics in the marine bottom environment (Lastra et al., Reference Lastra, Palacio, Sánchez and Mora1991). Soft bottoms can be characterized relating the distribution of the inhabitant trophic categories with abiotic parameters (Olabarria et al., Reference Olabarria, Urgorri and Troncoso1999). Furthermore, the morphology that species adopt for optimizing food capture, offers indirect information about the physical characteristics of the environment (Lastra et al., Reference Lastra, Palacio, Sánchez and Mora1991). Sanders (Reference Sanders1958) observed that suspension feeding organisms are typically found in high energy environments with coarse sediments, while deposit feeders are more abundant in low energy environments with high percentage of fine particles.
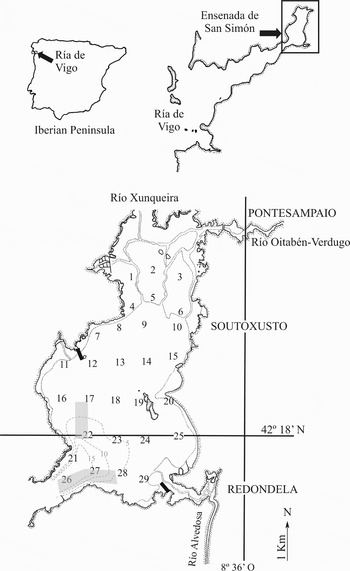
The Ensenada de San Simón is located in the inner part of the Ría de Vigo, between 42°17′–42°21′N and 8°37′–8°39′W (Figure 1). Benthic communities of several estuaries have been studied in recent years, but despite the profusion of scientific studies in the Ensenada de San Simón (Nombela et al., Reference Nombela, Vilas, Alejo, García-Gil, Rubio and Pazos1992; Álvarez-Iglesias et al., Reference Álvarez-Iglesias, Rubio and Vilas2003), none of them have analysed the patterns of spatial distribution of its benthic fauna or the trophic behaviour of these populations. Soft-bottoms of the Ensenada de San Simón are mainly muddy with high organic matter content (Vilas et al., Reference Vilas, Nombela, García-Gil, García-Gil, Alejo, Rubio and Pazos1995). Intertidal and shallow subtidal areas are colonized by the seagrasses Nanozostera noltii Horneman (Tomlison & Postuzny) and Zostera marina L. Culture of mussels on rafts is a common practice in large areas of the mouth of the inlet (Abella et al., Reference Abella, Parada and Mora1996). Large freshwater input occurs in its innermost part, which translates into salinity fluctuations both tidally and seasonally (Nombela et al., Reference Nombela, Vilas, Alejo, García-Gil, Rubio and Pazos1992). These inflows, together with the numerous mussel rafts and the two harbours present in the inlet, are the main natural and anthropogenic stressors/pressures in the inlet.
Location of the Ensenada de San Simón (Ría de Vigo, Spain) and position of the 29 sampling sites, pointed line indicating the limit with intertidal level. Grey areas are mussel raft sites and black bars indicate harbour positions.

The 2252 hectares of the Ensenada de San Simón have been included in the Nature 2000 Network as a Special Conservation Zone because of the intertidal areas colonized by Zostera marina and Nanozostera noltii, which are used as resting and feeding habitats by bird populations. Research on the composition and distribution of macrobenthic communities in soft sediments is of great interest to properly manage the protected marine environments. So, there arose a need to improve the scientific knowledge of the benthic communities present in the Ensenada de San Simón. This knowledge will provide a reference baseline to analyse any possible impact from future changes (effect of mussel rafts, overexploitation, contaminant spills and construction of new harbours).
By taking into account previous studies, we know that the community structure depends on abiotic factors (mainly grain size, calcium carbonate and organic matter composition) and that suspension feeders are dominant in sediments with larger grain size, while deposit feeders are dominant in the muddy sediments. But in the specific case of the Ensenada de San Simón, other extreme factors can determine the organization of the trophic communities. Depth, and derived desiccation stress in intertidal areas, will be hypothesized as the responsible factor for the benthic fauna distribution. The particular hydrodynamic conditions and the presence of seagrass meadows and mussel rafts will enrich organic matter content in the calmer areas of the inlet, where deposit feeders will find their optimal conditions. Our hypothesis is that deposit feeders, adapted to live in muddy sediments and related stable conditions, will be dominant in subtidal areas. Filter feeder species, adapted to coarser sediments and stressful intertidal conditions, will be present in inner parts. The presence of seagrass in intertidal and shallow subtidal areas will determine the distribution of herbivore species which feed on it and its epiphytes.
According to Rhoads & Young (Reference Rhoads and Young1970) deposit feeders can destabilize the sediment and thus control fauna distribution on soft bottoms. This trophic amensalism hypothesis suggests that suspensivores would collapse their filtration mechanisms in the presence of deposit feeders, and so, the abundance of suspension feeders will be negatively correlated with deposit feeders. This assumption will also be tested in San Simón. Therefore, the principal aim of the present study is to characterize the trophic structure and ecology of species inhabiting intertidal and subtidal soft substrata throughout the Ensenada de San Simón and relate them with the measured environmental variables.
MATERIALS AND METHODS
Samples were collected from 29 sites during high tide in November and December 1999 (Figure 1). The map also shows the main natural and anthropogenic stressors/pressures in the inlet (harbours and rafts for mussel cultures). Five replicated samples were taken at each site, by means of a van Veen grab (0.056 m2). Samples were sieved through 0.5 mm mesh and the retained material was fixed in 10% buffered formalin. Fauna was sorted from the sediment and preserved in 70% ethanol. Temperature from bottom water and sediment and pH from sediment were measured in situ with a pHmeter Hanna HI 9025C. A sediment sample was taken at each site for later analyses. To determine content of calcium carbonate a sediment sample was treated with hydrochloric acid. Total organic matter content was estimated from the weight loss after placing samples in a furnace for 4 hours at 450°C. Granulometric fractions were determined according to Guitián & Carballas (Reference Guitián and Carballas1976) and sedimentary types according to Rodrigues & Quintinho (Reference Rodrigues and Quintinho1985) and Junoy (Reference Junoy1996).
Data analysis
Macrofaunal species were identified, abundance data were organized into matrices and replicate data were added to obtain a value for the whole sampling site. Each macrofaunal species was assigned to a trophic level following previously published papers (Fauchald & Jumars, Reference Fauchald and Jumars1979; Gambi & Giangrande, Reference Gambi and Giangrande1985a, Reference Gambi and Giangrandeb; Ambrogi et al., Reference Ambrogi, Bedulli and Occhipinti1989; Lastra et al., Reference Lastra, Palacio, Sánchez and Mora1991; Palacio et al., Reference Palacio, Mora, Lastra and Planas1993; Troncoso et al., Reference Troncoso, Urgorri and Olabarria1996; Olabarria et al., Reference Olabarria, Urgorri and Troncoso1999; Giangrande et al., Reference Giangrande, Licciano and Pagliara2000). The trophic groups considered include carnivores (C), surface deposit-feeders (SD), subsurface deposit-feeders (SSD), suspension feeders (S), herbivores (H) and others (O), the latter including ectoparasites, omnivores and scavenging fauna. Several categories were defined combining the trophic and the major faunal groups (Polychaeta, Mollusca, Crustacea and others). Structure analyses were carried out with the data of the major trophic groups and at the level of these categories (e.g. suspension feeder molluscan, SM).
Median size grain (Q50, mm) and sort coefficient (So) (Trask, Reference Trask1932) were calculated for each sample. Sort coefficient was considered as So = √ Q25/Q75, where Q25 and Q75 are the 25th and 75th percentiles. Kurtosis (Kg) and skewness (Sk) coefficients were calculated according to Folk & Ward (Reference Folk and Ward1957).
Spearman rank correlations were used to examine relationships both between abiotic (depth, grain size, etc) and biotic variables (abundance of trophic groups) and within biotic variables (carnivores versus deposit feeders, etc) (SPSS 14.0 program) (Sokal & Rohlf, Reference Sokal and Rohlf1980).
Assemblages defined by trophic structure were determined through non-parametric multivariate techniques using the Plymouth Routines in Multivariate Ecological Research software package (PRIMER 5; Clarke & Warwick, Reference Clarke and Warwick1994). A similarity matrix was performed using the Bray–Curtis coefficient (Bray & Curtis, Reference Bray and Curtis1957) after applying the fourth-root transformation to trophic abundances. From the similarity matrix, classification and ordination of the sites (direct analysis) and trophic groups or categories (inverse analysis) was performed through cluster analysis using the algorithm UPGMA and non-metric multidimensional scaling (MDS). The SIMPER program was used to identify trophic groups that contributed to the dissimilarity among the groups of previously determined sites.
Relationships between abundance of trophic groups and environmental variables were investigated by means of BIOENV procedure (PRIMER package) and canonical correspondence analysis (CANOCO for Windows 4.5 package; ter Braak & Prentice, Reference ter Braak and Prentice1988). Environmental variables expressed in percentages were previously transformed by log(x+1) and all of them were normalized.
RESULTS
Sedimentary characterization
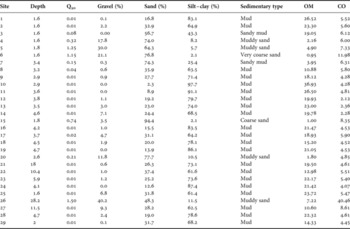
The soft bottoms of the Ensenada de San Simón were characterized by a predominance of muddy sediments with high organic matter and low calcium carbonate contents (Table 1). Sandy sediments were present in the eastern areas and in the tidal channels of the inner inlet, where low content of total organic matter were found. Site 26, located in the mouth of the inlet, had muddy sands with a large gravel fraction composed of shells of the mussels which were cultured in rafts and then thrown into the water after harvesting.
Depth of the water column during the sampling (metres, <2 m is intertidal) and characteristics of sediments at each sampled site.

CO, percentage of carbonate; OM, percentage of organic matter; Q50, median particle size (mm).
Composition and abundance of trophic groups
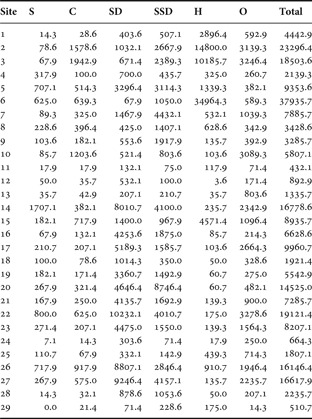
Sampling yielded 71,576 individuals, of which 29.87% of the specimens belonged to the trophic group surface deposit-feeders (SD), 28.72% were herbivores (H), 21.12% subsurface deposit-feeders (SSD), 12.77% others (O), 4.59% carnivores (C) and only 2.93% suspension feeders (S). Maximum densities were found at intertidal sites (6, 2 and 3, >18,500 individuals per m2) and minimum values in marginal areas close to the harbours (Sites 11, 24 and 29, <700 ind m−2) (Table 2).
Total abundance data expressed as densities for each trophic group in each site (individuals per m2).

S, suspension feeders; C, carnivores; SD, surface-deposit feeders; SSD, subsurface-deposit feeders; H, herbivores; O, others.
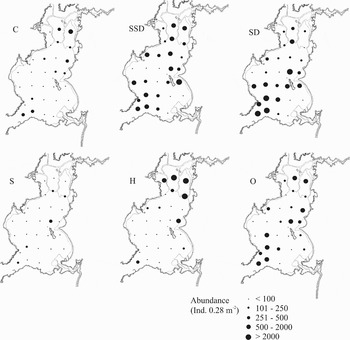
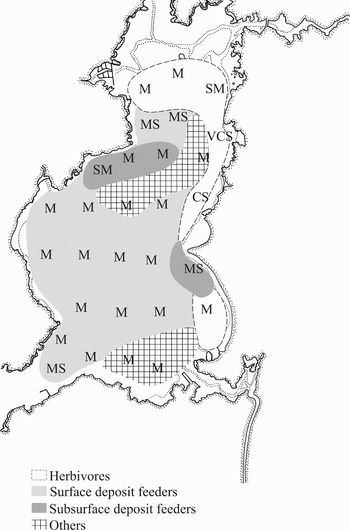
The distribution of trophic groups can be seen in the maps (Figures 2 & 3). As a general pattern, herbivores were found to dominate the sandy areas of the Ensenada de San Simón, while surface and subsurface deposit-feeders dominated the subtidal muddy zone.
Abundance of individuals in the sampled sites of Ensenada de San Simón. Each trophic group considered is represented in a map: S, suspension feeders; C, carnivores; SD, surface-deposit feeders; SSD, subsurface deposit-feeders; H, herbivores; O, others.

Dominant feeding guild for each sampled site and sediment grain size distribution in the Ensenada de San Simón (M, mud; SM, sandy mud; MS, muddy sand; CS, coarse sand; VCS, very coarse sand).

Herbivores presented a mean of 2531.79 individuals per m2 (standard deviation, σ = 7052.21) due to high densities of the gastropod Hydrobia ulvae (Pennant, 1777) in intertidal areas. This species presented a total of 19,928 individuals, representing 96.94% of the trophic group to which it belongs and 27.84% of the total fauna. Maximum values of H. ulvae density appeared at Stations 6, 2 and 3 (34,946.43, 14,800 and 10,153.57 ind per m2 respectively).
Surface and subsurface deposit-feeders dominated in the subtidal muddy zone of the Ensenada de San Simón. Dominance of surface deposit-feeders increased from the inner part of the inlet towards the mouth, due to the higher density of the polychaetes Pseudopolydora paucibranchiata (Okuda, 1937), Aphelochaeta marioni (Saint-Joseph, 1894), Ampharetidae spp. or the crustacean Microdeutopus cf. armatus Chevreux, 1887; surface deposit-feeders also represented 37.32% of the number of species. Surface deposit-feeders presented a mean of 2633.36 ind per m2 (standard deviation, σ = 3082.93). Sub-surface deposit-feeders increased their numerical dominance towards mid and external areas of the inlet.
The group others showed 25.95% of the total number of species, with 15.74% carnivores, 11.37% suspension feeders, 7.00% subsurface deposit-feeders and 2.62% herbivores.
Univariate and multivariate analysis
The abundance of suspension feeders was positively correlated (Spearman's correlation coefficient) with median particle size (P < 0.05), gravel content (P < 0.01) and abundance of surface (P < 0.01) and subsurface (P < 0.05) deposit-feeders. Carnivores showed positive correlations with abundance of herbivores (P < 0.05) and others (P < 0.01) abundances and skewness coefficient (P < 0.05). Surface deposit-feeders showed positive correlations with depth (P < 0.01), gravel content (P < 0.05), subsurface deposit-feeders (P < 0.01) and others (P < 0.01) abundances. Subsurface deposit-feeders showed positive correlations with sand content (P < 0.05) and kurtosis coefficient (P < 0.05), and negative correlations with organic matter content (P < 0.05). Herbivores showed positive correlations with median grain size (P < 0.05) and negative with silt–clay content (P < 0.01).
The BIOENV routine had pointed out that sand–carbonate content was the combination of environmental variables that best groups the sites according to the trophic structure, but showed a very low coefficient (0.096). The combinations between bottom water temperature–sand content, bottom water temperature–sand content–sediment pH or bottom water temperature–sand and carbonate contents showed a coefficient >0.082. According to these results, it seems that the environmental variables measured do not explain the trophic structure observed in the inlet.
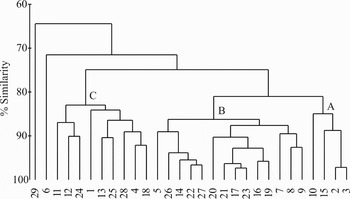
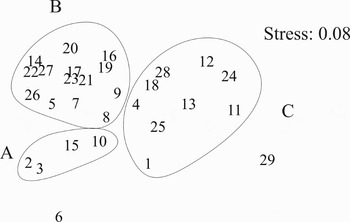
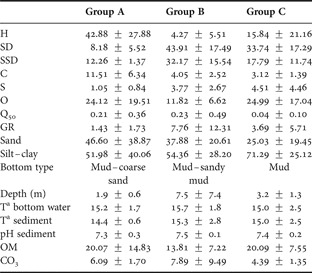
A dendrogram obtained through cluster analysis based on abundance data of the trophic categories showed three main groups or assemblages: A (Sites 2, 3, 10 and 15), B (Sites 5, 7, 8, 9, 14, 16, 17, 19, 20, 21, 22, 23, 26 and 27) and C (Sites 1, 4, 11, 12, 13, 24, 25 and 28) (Figure 4). A summary of the physical characteristics of these associations appears in Table 3. Ordination of sites through non-metric multidimensional analysis showed similar associations to the cluster analysis (Figure 5).
Cluster analysis of trophic group abundance data using the Bray–Curtis similarity coefficient.

Non-metric multidimensional scaling ordination of trophic groups in the Ensenada de San Simón.

Main characteristics of the assemblages determined by trophic composition in the Ensenada de San Simón, indicating means ± standard deviations (SD) of biological (%) and physical characteristics.
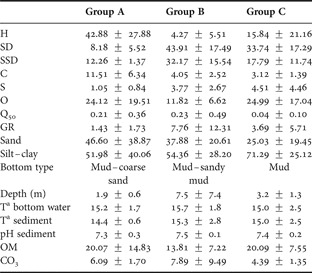
H, herbivores; SD, surface deposit-feeders; SSD, subsurface deposit-feeders; C, carnivores; S, suspension feeders; O, others; Q50, median grain size; GR, gravel content (%); OM, organic matter content (%); CO3, carbonate content (%).
SIMPER analysis showed that the herbivores and the others were the trophic groups with a greater contribution to similarity (40%) for group A. Group B was mainly defined by surface and subsurface deposit-feeders (up to 40%), while deposit feeders and the others were the trophic groups with a greater contribution to similarity for group C.
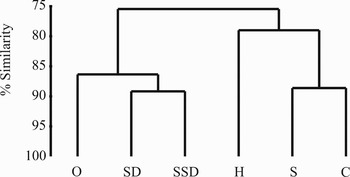
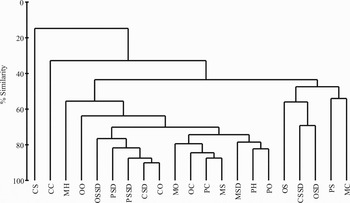
Whenever inverse analysis was applied to the abundance data of the trophic groups, the obtained dendrogram showed high similarities between the surface and the subsurface deposit-feeders, and between suspension feeders and carnivores (Figure 6). After applying inverse analysis to abundance of trophic categories, the obtained cluster showed high affinities between the group others and the polychaetes–suspension feeders, the others–surface deposit-feeders, the crustaceans–subsurface deposit-feeders and the molluscs–carnivores; another group was formed by the polychaetes–herbivores, others and carnivores, others–carnivores and the molluscs–others, suspension feeders and surface deposit-feeders. The polychaetes–deposit feeders, crustaceans–others and surface deposit-feeders and others–subsurface deposit-feeders also showed high similarities (Figure 7).
Classification of trophic groups determined in Ensenada de San Simón through inverse cluster classification analysis.

Inverse cluster analysis of trophic categories data using the Bray–Curtis similarity coefficient. First letters: S, suspension feeders; C, carnivores; SD, surface-deposit feeders; SSD, subsurface deposit-feeders; O, others. Last letters: M, molluscs; P, polychaetes; C, crustaceans, O, others.

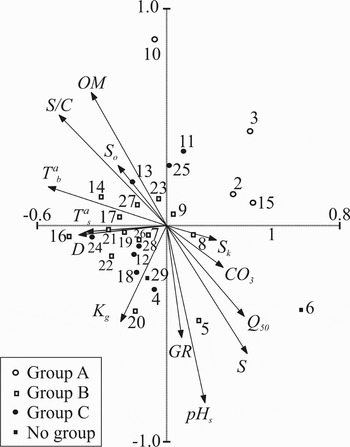
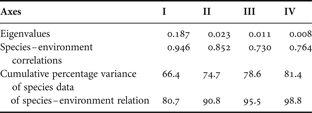
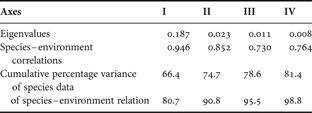
The first two axes of the canonical correspondence analysis accounted for 90.8% of the total variance of species–environment variables relationship, and 74.7% of the species variance. Eigenvalues and species–environment correlations appear in Table 4. Correlation values close to 1 indicated that abiotic variables were correctly chosen (ter Braak & Prentice, Reference ter Braak and Prentice1988). Forward selection indicated that temperature of the bottom water and kurtosis coefficient were the variables explaining most of the variance in the trophic data (P < 0.01) as well as the silt–clay and the organic matter content (P < 0.05). The scatter diagram showed an ordination of sites following these gradients on sediment characteristics (Figure 8).
Canonical correspondence analysis ordination of environmental variables and sampled sites relative to axes I and II for the Ensenada de San Simón. Q50, median grain size; So, sort coefficient; GR, gravel content; S, sand content; S/C, silt and clay content; Tas, sediment temperature; Tab, temperature of bottom water; pHs, sediment pH; OM, organic matter content; CO3, carbonate content; Kg, kurtosis coefficient; Sk, skewness.

Summary of canonical correspondence analysis for the Ensenada de San Simón.
DISCUSSION
The Ensenada de San Simón mainly presented muddy sediments with high content of organic matter. There was a predominance of deposit-feeders in subtidal muddy areas of the inlet and herbivores in the sandy intertidal ones. This distribution seems to be related with the communities cited by Cacabelos et al. (Reference Cacabelos, Gestoso and Troncoso2008). In this paper, the authors found two communities in the inlet: a reduced Macoma community (Thorson, Reference Thorson1957) and a Syndosmya (=Abra) alba community (Petersen, Reference Petersen1918). The reduced Macoma community was present in the intertidal areas, where the herbivore Hydrobia ulvae was numerically dominant. The subtidal muddy bottoms were characterized by a Syndosmya (=Abra) alba community (Petersen, Reference Petersen1918), showing high densities of Pseudopolydora paucibranchiata, Aphelochaeta marioni or Microdeutopus cf. armatus. These last species are surface and subsurface deposit-feeders.
According to Rhoads & Young (Reference Rhoads and Young1970), the heterotrophic benthic organisms are predominantly suspension feeders and detritivores. The suspension feeders are dominant in sandy sediments, while the surface deposit-feeders predominate in muddy bottoms (Maurer et al., Reference Maurer, Watling, Leathem and Kinner1979; Gambi & Giangrande, Reference Gambi and Giangrande1985a, Reference Gambi and Giangrandeb; Dauvin, Reference Dauvin1988). On the contrary, the surface deposit-feeders in the Ensenada de San Simón were positively correlated with gravel content and depth; these results contrast with previous works that pointed out that this trophic group is strongly related to silt–clay content (Sanders, Reference Sanders1968; Levinton, Reference Levinton and Coull1977; Parapar, Reference Parapar1991).
The organic matter and silt–clay contents found in intertidal areas were much higher than those recorded by Nombela & Vilas (Reference Nombela and Vilas1986–1987). This situation is not surprising. On the one hand the presence of phanerogams traps and stabilizes the sediment (Nombela et al., Reference Nombela, Vilas and Evans1995) and on the other hand, an intense culture of mussels on rafts is located at the study sites (Figure 1). Mussels produce high quantities of faecal pellets that substantially modify the sediment composition by increasing the clay fraction (Nombela et al., Reference Nombela, Vilas, Rodríguez and Ares1987; León et al., Reference León, Méndez and Rubio2004) which in turn influences the benthic community and its trophic structure (Abella et al., Reference Abella, Parada and Mora1996, Conde & Domínguez, Reference Conde and Domínguez2004). Since the biodeposits produced by each one of the 76 rafts sited in the inlet could reach 190 kg dry weight day−1 (Cabanas et al., Reference Cabanas, González, Mariño, Pérez and Román1979), an important effect of this activity on the granulometric composition is expected. Moreover, most of the inlet is submitted to really slow hydrodynamics. Boaventura et al. (Reference Boaventura, Cancela da Fonseca and Teles-Ferreira1999) stated that factors which affect the trophic distribution are current intensity and sediment depositions. Consequently, changes in trophic structure are expected, but no evaluation of this impact can be assessed since no data are available.
The gastropod Hydrobia ulvae is responsible for the numerical dominance of the herbivores in the intertidal area. Seagrasses and their epiphytes find optimal growth conditions here, and H. ulvae changes its trophic behaviour from surface deposit-feeder to herbivore within seagrass meadows (Jacobs et al., Reference Jacobs, Hegger and Ras-Willems1983). Although many authors consider H. ulvae to be a surface deposit-feeder (Fenchel, Reference Fenchel, McRoy and Helfferich1977; Olabarria et al., Reference Olabarria, Urgorri and Troncoso1999), in the present work it was assigned to the trophic level of herbivores. Most of the bottoms in which H. ulvae appeared were colonized by Zostera marina and Nanozostera noltii covered by epiphytes on which the gastropod feeds (Barnes, Reference Barnes1981; Levinton & Bianchi, Reference Levinton and Bianchi1981; Hootsmans & Vermaat, Reference Hootsmans and Vermaat1985).
The scarce carnivores of the Ensenada de San Simón (mainly polychaetes and nemerteans) were principally interstitial species, with movement and feeding behaviour which depend on the existence of interstices among sediment grains (Muniz & Pires, Reference Muniz and Pires1999). Microphthalmus pseudoaberrans Campoy & Viéitez, 1982 and Parapionosyllis brevicirra Day, 1954, were the most common species which appeared in intertidal areas with coarse sediment where a greater diversity of interstitial spaces is available to these small organisms (Olabarria et al., Reference Olabarria, Urgorri and Troncoso1998).
The presence of the suspension feeders was remarkable only in the mouth of the rivers Oitabén and Verdugo, at Site 14 and in the external area. This might be due to the influence of greater hydrodynamism (Nombela et al., Reference Nombela, Vilas, Rodríguez and Ares1987). The abundance of suspension feeders was related with the coarser fractions of sediments located in these bottoms, where there is no risk of refilling their gills (Levinton, Reference Levinton and Coull1977). Nevertheless, the suspension feeders did not show elevated densities in Ensenada de San Simón. The most common suspension feeder was the intertidal bivalve Cerastoderma edule, characteristic of the reduced Macoma community. Cerastoderma edule and Parvicardium exiguum (Gmelin in Linneo, 1791) display high tolerances to salinity variations, and time of emersion and current speed were the most important factors for their distribution. Among the subtidal suspension feeders Mysella bidentata (Montagu, 1803) and Calyptraea chinensis showed the highest densities in Ensenada de San Simón. These results seem to agree with the general ideas of Boaventura et al. (Reference Boaventura, Cancela da Fonseca and Teles-Ferreira1999), who relate the filter feeders to current velocity, and confine herbivores to the euphotic zone.
In the inlet, the abundance of the suspensivores was positively correlated with the abundance of the surface deposit-feeders, contradicting the cited hypothesis of amensalism of trophic groups. Detritivores are generally the dominant group in sublittoral soft bottoms of estuaries and coastal ecosystems (Gaston & Nasci, Reference Gaston and Nasci1988; Lastra et al., Reference Lastra, Palacio, Sánchez and Mora1991; Muniz & Pires, Reference Muniz and Pires1999; García-Arberas & Rallo, Reference García-Arberas and Rallo2002).
Our findings suggest that sediment characteristics (grain size and organic matter content) and the bottom water temperature are the most important variables that explain the distribution of the deposit feeders. Surface deposit feeders are directly correlated with depth, showing their maximum abundances in the subtidal areas. These areas show higher and more stable bottom water temperature, a factor selected by all the multivariate analyses as an important variable explaining trophic structure. Stressful natural fluctuations impose physical limitations on the estuarine biota (Wilson & Jeffrey, Reference Wilson, Jeffrey and Kramer1994). So, in agreement with our first hypothesis, deposit feeders find their required stability in the subtidal zone.
The relationship between the gravel fraction and the deposit feeders can be explained by the contribution of Site 26, which surprisingly had coarse grain size sediment. The explanation for this is the high hydrodynamics of this area, located in the narrow communication path with the estuary and the important contribution of mussel shells from nearby. Muddy sediments are dominant in most of the subtidal area, and deposit feeders are dominant here just like on the soft bottoms of other estuaries and coastal ecosystems (Gaston & Nasci, Reference Gaston and Nasci1988; Lastra et al., Reference Lastra, Palacio, Sánchez and Mora1991; Muniz & Pires, Reference Muniz and Pires1999; García-Arberas & Rallo, Reference García-Arberas and Rallo2002).
To conclude, surface and subsurface deposit-feeders dominate in the subtidal muddy zone of the Ensenada de San Simón, while herbivores are dominant in the intertidal sandier areas. The distribution of the trophic groups seems to be primarily determined by sediment composition (organic matter and silt–clay contents) and temperature of bottom water. This study provides a very important baseline for future comparative studies, since anthropogenic-related changes in macrobenthic assemblage structure may reflect changes in trophic structure (Rakocinski et al., Reference Rakocinski, Brown, Gaston, Heard, Walker and Summers1997). Mussel culture on rafts and the reduction in the hydrodynamic regime due to human (construction of dams and harbours) or natural causes (presence of meadows) will progressively increase the content of organic matter and fine particles in the sediment; both potential factors would affect the biodiversity of benthic organisms and their trophic behaviour.
ACKNOWLEDGEMENTS
We gratefully thank the Adaptations of Marine Animals laboratory staff for their invaluable help with sample collection and comprehension of statistical methods. This paper is a contribution to the research project PGIDT 00PXI30119 PR.