

1. INTRODUCTION
Physical properties of warm dense plasmas at megabar pressures are of great interest for HIF target design and for understanding of physical processes of intense beam-target interactions (Fortov et al., Reference Fortov, Hoffmann and Sharkov2008; Varentsov et al., Reference Varentsov, Ternovoi, Kulish, Fernengel, Fertman, Hug, Menzel, Ni, Nikolaev, Shilkin, Turtikov, Udrea, Fortov, Golubev, Gryaznov, Hoffmann, Kim, Lomonosov, Mintsev, Sharkov, Shutov, Spiller, Tahir and Wahl2007; Hoffmann et al., Reference Hoffmann, Fortov, Lomonosov, Mintsev, Tahir, Varentsov and Wieser2002; Stowe et al., Reference Stowe, Bock, Dornik, Spiller, Stetter, Fortov, Mintsev, Kulish, Shutov, Yakushev, Sharkov, Golubev, Bruynetkin, Funk, Geissel, Hoffmann and Tahir1998). This report presents the overview of the results of investigation of transport properties of the coupled non-ideal plasmas generated as a result of the multiple shock compression of hydrogen, noble gases, S, I, fullerene C60, and H2O in the megabar pressure range (Fortov & Mintsev, Reference Fortov and Mintsev2013; Nellis, Reference Nellis2006). The highly time-resolved diagnostics permit us to measure thermodynamical, radiative, and mechanical properties of high pressure condensed matter in the phase diagram broad region — from the compressed condensed solid state up to the low density gas range, including high pressure evaporation curves with near-critical states of metals, strongly coupled plasma and metal-insulator transition regions (Fortov, Reference Fortov2011; Lomonosov, Reference Lomonosov2007). Shock compression of H2, Ar, He, Kr, Ne, and Xe in initially gaseous and cryogenic liquid states allow to measure the electrical conductivity, Hall effect parameters, equation of state (EOS), and emission spectra of strongly non-ideal plasma at extremely high coupling (Fortov, Reference Fortov2011). The measured electrical conductivity of shock compressed hydrogen increased from 0.1 to 103 cm/Ω as a result of compressions and subsequent expansion. “Pressure ionization” is the most prominent effect at the density 0.5–2.0 g/cm3 — the electrical conductivity follows the electron concentration in coupled disordered matter (Fortov et al., Reference Fortov, Ilkaev, Arinin, Burtzev, Golubev, Iosilevskiy, Khrustalev, Mikhailov, Mochalov, Ternovoi and Zhernokletov2007). Comparison of the data obtained with theoretical models (percolation, Mott transition, Ziman, and Lorenz approach, etc.) is presented. Some interesting similarities between shock compressed H, He, noble gases, and shock compressed S, I, H2O, and fullerene C60 are discussed. In contrast to the plasma compression experiments, the multiple shock compression of solid Li and Na shows “dielectrization” of these elements (Fortov et al., Reference Fortov, Yakushev, Kagan, Lomonosov, Postnov and Yakusheva1999). Theoretical estimations of the dielectrization pressure range for some elements at ultra-megabars are presented and compared with the experiments.
In the present review, we pay great attention to analysis of the behavior of the shear viscosity of strongly coupled plasma. This is due to the work of Kovtun et al. (Reference Kovtun, Son and Starinets2005) where string theory methods led to the hypothesis that the ratio of shear viscosity coefficient to volume density of entropy of any physical system has a lower bound. Systems with strong coupling should have a small viscosity close to that of the lower bound. But today there are a few amounts of direct measurements of viscosity at high pressures (Mineev & Funtikov, Reference Mineev and Funtikov2004). For the estimations of shear viscosity of strongly coupled plasma, we use experimental data on measurements of electrical conductivity of hydrogen, deuterium, and rare gases under intense shock compression (Fortov & Mintsev, Reference Fortov and Mintsev2013). The data on hydrogen, deuterium, and helium-hydrogen mixture, received in the region of “metallization” at Р ~ 150 GPa in different experimental systems by the method of quasi-isentropic compression reach the values η/s ~ (0.3–10). Thereby, the hydrogen plasma in the region of “metallization” possesses the lowest values of the shear viscosity to the entropy ratio. Note that in this case we have an extremely high value of the coupling parameter — Г ~ 20–80. It is shown, that the data on electrical conductivity of strongly coupled electromagnetic plasma, confirm the tendency of decreasing of the viscosity η/s with an increase in the correlation (Г) and thus confirm trend of the transition of the physical system to the perfect frictionless fluid with the increasing of the inter-particle interaction.
2. EXPLOSIVELY DRIVEN METHODS OF WDM GENERATION
To generate strongly coupled dense plasma by intense shock waves, a broad spectrum of drivers is used — chemical and nuclear explosives, pneumatic and electrical guns, intense laser and soft X-rays, electrons, and light and heavy ion beams (Fortov, Reference Fortov2011). The use of intense shock waves in physical research has made extreme state of matter and super high-speed processes an object of laboratory experiments. As a result of nonlinear hydrodynamics the narrow (a few inter-atomic distances) width of the viscous shock front transforms the kinetic energy of the flow into compression and irreversible heating of matter (Zel'divich & Raizer, 1966). This method has no limitations in pressure but it has definite limitations in time scale which is typically about 10−6–10−9 s. In addition, the application of the general laws of conservation of mass, momentum, and energy enables one to reduce the recording of the thermodynamical characteristics of the matter under investigation to registration of kinematic parameters of propagation of shock fronts and interfaces (Altshuler, Reference Al'tshuler1965) (i.e., to the time and distance measurements).
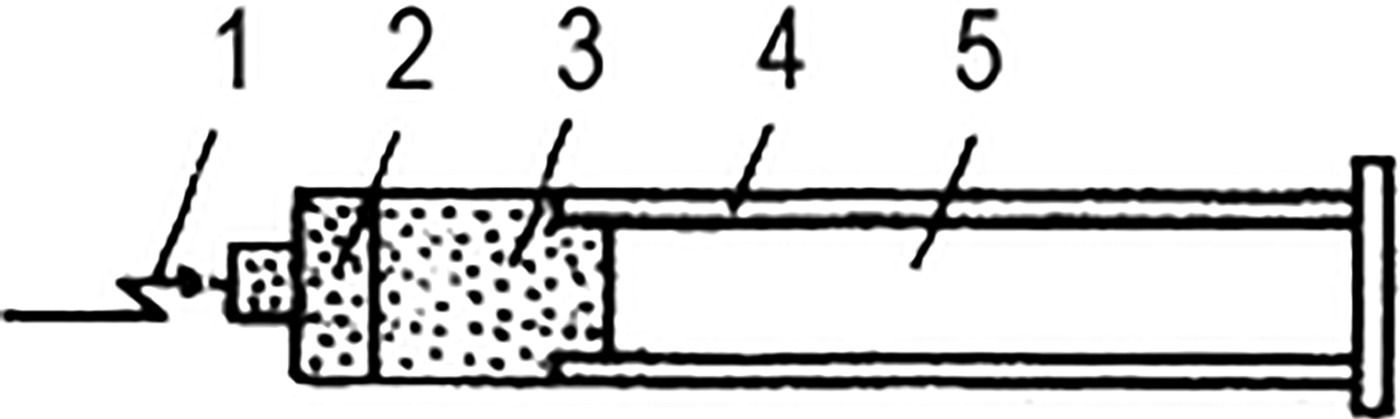
Because the high explosives have a specific energy density six orders of magnitude higher than electrical capacitors, most experiments in shock compression of plasmas were carried out using these drivers. In the explosively-driven shock tubes, the intense shock wave is generated in the precompressed noble gases as a result of expansion of detonation products of high explosives (Mintsev & Fortov, Reference Mintsev and Fortov1982; Reference Mintsev and Fortov2006). To realize velocities of shock in the range of 8–30 km/s “linear” and cumulative explosively driven shock tubes were used (Figs. 1 and 2). Measurements of EOS, electrical conductivity, and opacity of non-degenerate Boltzmann-like coupled plasmas at pressures up to 200 kbar were carried out using these devices.
Linear explosively driven shock tube. (1) Detonator; (2) High explosive lens; (3) High explosive; (4) Glass tube; (5) Investigated gas.

Voitenko compressor. (1) High explosive; (2) Flying plate; (3) Compression chamber; (4) glass tube.
Much higher, about 1 Mbar pressures in gases and about 5 Mbar in metals were generated by high explosive guns (Altshuler et al., Reference Al'tshuler, Trunin, Urlin, Fortov and Funtikov1999) (Fig. 3). In this device, high explosive detonation products accelerate a metal impactor up to the velocity of about 5–6 km/s. The impact of this high velocity impactor against a target generates a plane shock wave in plasmas with pressures up to a few Mbar. The lifetime of this high pressure plasma states is rather short because of its inertial confinement. As a result, the diagnostic for those experiments must be sufficiently fast. Electrical pin and optical base methods; optical reflectivity, spectrometry and pyrometry; X-ray diffraction and absorption; laser interferometry; electrical resistivity, capacitor and piezoelectricity methods, and other diagnostic methods applied to shock experiments must have temporal resolution better than 10−6–10−9 s.
HE gun. (1) Detonator; (2) High explosive lens; (3) High explosive; (4) Flying plate; (5) Experimental vessel.
To increase shock pressure, the front collision generator was designed. In this device, the materials under investigation are compressed from two sides by two strikers accelerated by high explosive charges, which were ignited simultaneously (Nabatov et al., Reference Nabatov, Dremin, Postnov and Yakushev1979). To increase launch velocity and shock pressure in plasma some sophisticated gas-dynamic ideas were applied. The idea of plane gradient cumulating is completely similar to acceleration of a light ball, which elastically strikes a heavy one. As a result, a three-stage high explosive gun accelerates the molybdenum projectile up to 13–14 km/s (Bushman et al., Reference Bushman, Glushak, Gryaznov, Zhernokletov, Krasyuk, Pashinin, Prokhorov, Ternovoi, Filimonov and Fortov1986).
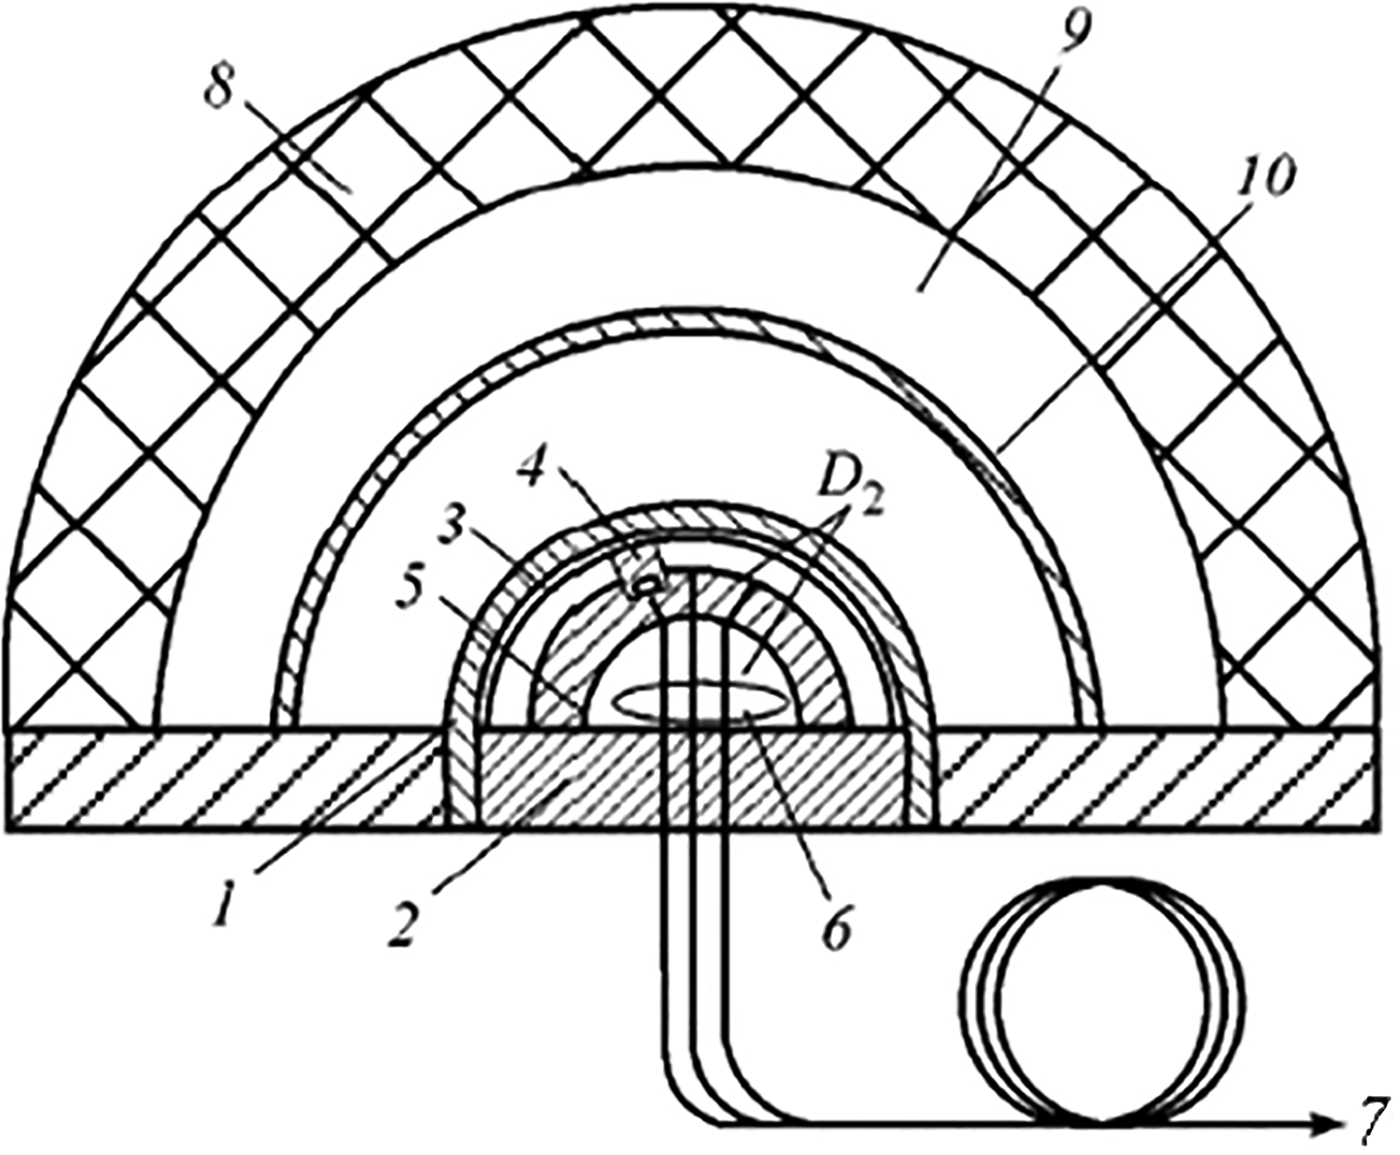
Cylindrical and spherical high explosive generators (Fig. 4) were designed in the Soviet Union in the late 1940s and were used to reach pressures up to 10–20 Mbar as a result of cylindrical or spherical accumulation (Fortov et al., Reference Fortov, Ternovoi, Zhernokletov, Mochalov, Mikhailov, Filimonov, Pyalling, Mintsev, Gryaznov and Iosilevskii2003; Al'tshuler et al., Reference Al'tshuler, Trunin, Krupnikov and Panov1996). The weight of this system is as high as 100 kg and energy release is about 500 MJ. The maximum spherical projectile velocity was as high as 20 km/s.
Hemispherical experimental device. (1) Frame; (2) Base; (3) Screen; (4) Sample; (5) Housing; (6) Optical sensors; (7) Measuring line; (8) Explosive; (9) Air gap; (10) Impactor.
3. ELECTRICAL CONDUCTIVITY
Electrical conductivity is among the most interesting and informative characteristics of the medium. Indeed, the electrical conductivity provides valuable information about elementary charge transfer processes and, what is most important, about the equilibrium composition of plasma, because the transport current in partially ionized plasma is directly determined by the concentration of free charges. Here it is noteworthy that the charge separation into free and bound charges for non-ideal plasma is a complicated task in view of the strong inter-particle interaction, which makes this separation not quite unambiguous. By measuring the electrical conductivity of non-ideal plasma, one can consider pressure-induced ionization, dramatic evidence for the inter-particle interaction in compressed plasma (Fortov, Reference Fortov2011; Nellis, Reference Nellis2006).
It is known that a substance can be brought into the conducting state (ionized) by either heating or compression. Currently, the mechanism of temperature-induced ionization is the major and best studied mechanism in plasma physics. It is associated with heating of rarified plasma to a temperature comparable with the ionization potential of the substance (T ~ J). The pressure-induced ionization mechanism alternative to thermal ionization is associated with the pronounced compression of a “cold” substance to densities 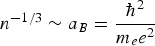 $n^{ - 1/3} \sim a_B = \displaystyle{{\hbar ^2 } \over {m_e e^2 }}$ sufficient for the overlap of atomic orbitals with the characteristic size of the Bohr radius.
For this criterion to be realized, it is necessary to advance to the condensed plasma density range and, as a consequence, to generate pressures in the megabar range. To separate these two ionization mechanisms in the experiment, it is necessary to perform “cold” (T ≪ J) compression of the substance by diminishing the thermal heating effects. Hydrogen proved to be the most appropriate subject for this purpose as its low molecular mass accounts for the lowest shock compression temperature. Hydrogen is the most naturally abundant (90%) and simultaneously the simplest chemical element, which has been attracting attention of various researchers for almost 250 years. The vigorous studies of the EOS and electrical conductivity are stimulated by the role of hydrogen plasma in the astrophysics and the physics of giant planets, and by the search for high-temperature superconductivity of its metallic phase. These are the permanent pragmatic incentives that promoted the research over the last 50 years.
The pressure-induced ionization of hydrogen and noble gas plasmas was studied by multiple shock compression technique, which can accomplish quasi-adiabatic compression with a considerable (about 10-fold) increase in the compression ratio and a decrease to (4–5) × 103 K in the substance temperature (Nellis, Reference Nellis2006; Fortov, Reference Fortov2011; Fortov et al., Reference Fortov, Ternovoi, Zhernokletov, Mochalov, Mikhailov, Filimonov, Pyalling, Mintsev, Gryaznov and Iosilevskii2003; Weir et al., Reference Weir, Mitchell and Nellis1996). The experiments were carried out in planar and cylindrical geometry using light-gas guns and explosion launching devices and cylindrical magnetic accumulation explosion generators (Hawke et al., Reference Hawke, Burgess, Duerre, Huebel, Keeler, Klapper and Wallace1978; Pavlovski et al., Reference Pavlovskii, Fowler, Caird and Erickson1987), in which high-intensity magnetic field is used to render the process isentropic.
Numerous experiments revealed a sharp (by up to five to six orders of magnitude) increase in the static electrical conductivity of hydrogen in a narrow range of condensed density at megabar pressures (Fig. 5). The highest electrical conductivity level achieved under these conditions is about several hundred Ω−1cm−1; this is close to the electrical conductivity of alkali metals and is comparable with the Ioffe-Regel “minimum metallic” conductivity (Gantmakher, Reference Gantmakher2005). In this connection, the effect in question is often called “metallization,” which of course is not quite correct, because according to publications (Zel'dovich & Landau, Reference Zel'dovich and Landau1944) the notions “metal” and “dielectric” can be separated only at T = 0 K. In our opinion, in the given case, one deals with pressure-induced ionization (Fortov et al., Reference Fortov, Ternovoi, Zhernokletov, Mochalov, Mikhailov, Filimonov, Pyalling, Mintsev, Gryaznov and Iosilevskii2003) caused by the overlap of the wave functions of neighboring atoms, which facilitates the ionization in the dense medium. One can compare the geometric characteristics of an isolated hydrogen molecule with the available space per molecule (Wigner-Seitz cell radius r s) at a chosen density ρ. It can be seen that for the density ρ > 0.3 gcm−3, hydrogen molecules become comparable to and then smaller than the Wigner-Seitz sphere size. Physically, this corresponds to pronounced overlap of the electron wave functions of neighboring atoms even in the ground energy state. This overlap creates conditions for delocalization of electrons (Gantmakher, Reference Gantmakher2005), which hence, are quasi-free to move in plasma. The energy spectrum and the effective ionization potential of hydrogen (ΔE) as a function of the Wigner-Seiz sphere size are given in Figure 6. The red lines designate the lower edge of the band calculated assuming that the radial part of the wave function R nl(r s) is equal to zero at the cell boundary, while the blue lower edge of the band was determined from a similar condition for the wave function derivative R′nl(r s) = 0. It can be seen that during compression (decrease in r s), the energy levels are broadened and transform into energy bands, then these bands overlap and, as a consequence, the effective ionization potential of the substance decreases. The ΔE value obtained in this way is in reasonable agreement with the corresponding value found from experimental measurements of the temperature dependence of conductivity.
Pressure ionization of non-ideal hydrogen plasma.
Energy spectrum of compressed hydrogen as a function of the Wigner-Seitz sphere size. R nl(r s) and R'nl(r s) are the radial wave function and its derivative.
Similar conductivity data for quasi-adiabatic compressed plasma were obtained for some other elements: helium, deuterium, argon, xenon, and hydrogen-helium mixture plasma in the Jupiter atmosphere (Fortov et al., Reference Fortov, Ternovoi, Zhernokletov, Mochalov, Mikhailov, Filimonov, Pyalling, Mintsev, Gryaznov and Iosilevskii2003; Ternovoi et al., Reference Ternovoi, Filimonov, Pyalling, Mintsev and Fortov2002). Now we can show the range of pressures and densities of appearance of high level (metallic) conductivity for almost all elements (like B, I, S, etc., except dangerous elements), which are dielectrics in a normal state (Fortov et al., Reference Fortov, Ternovoi, Zhernokletov, Mochalov, Mikhailov, Filimonov, Pyalling, Mintsev, Gryaznov and Iosilevskii2003; Fu et al., Reference Fu, Chen and Chen2012). We can say the same about some simple chemical compounds. In Figures 7 and 8, as an example we place electrical conductivity of sulfur and water (Yakushev, Reference Yakushev1997) in dependence on pressure.
Electrical conductivity of water.
The effects of overlap of electron shells were additionally studied in experiments (Osip'yan et al., Reference Osip'yan, Avdonin, Kagan, Nikolaev, Postnov, Sidorov, Shakhrai, Shestakov, Kveder and Fortov2005) on quasi-adiabatic compression of C60 fullerene with the characteristic size of the molecule substantially exceeding the size of the hydrogen atom (7 A versus 1 A). As expected, the pressure of “metallization” of C60 fullerene was approximately an order of magnitude lower than that of hydrogen.
Yet another interesting example is the compression of the alane molecule comprising a relatively large atom, aluminum, bonded to hydrogen atoms (AlH3). In this case, so-called chemical compression is considered (Molodets et al., Reference Molodets, Shakhray, Khrapak and Fortov2009). The pressure of substance “metallization” is not high (about 50–90 GPa), being determined by the small size of the hydrogen atom and relatively short distances between the neighboring atoms, so that their electron shells can overlap (Fig. 9). The dependence of the electrical conductivity on the partial volume of hydrogen demonstrates good agreement of the density of the onset of sharp increase in the electrical conductivity and hydrogen “metallization” (Fig. 10).
Electrical conductivity of sulfur.
Chemical compression. Structure of the AlH3 molecule.
Electrical conductivity of alane vs. the partial volume of hydrogen.
A characteristic feature of most physical models of non-ideal plasma is their thermodynamic instability in the region of high non-ideality parameters Γ > 1, where dynamic plasma compression experiments were planned and performed. The instability of highly compressed Coulomb systems corresponds to the “plasma” phase transition predicted using simplified models (Wigner, Reference Wigner1938; Zel'dovich & Landau, Reference Zel'dovich and Landau1944; Norman & Starostin, Reference Norman and Starostin1970; Ebeling et al., Reference Ebeling, Foerster and Fortov1991; Saumon & Chabrier, Reference Saumon and Chabrier1992), reproduced by molecular dynamics (Baus & Hansen, Reference Baus and Hansen1980), and quantum Monte Carlo methods (Filinov et al., Reference Filinov, Levashov, Bonitz and Fortov2005). The corresponding plasma instability domain (Debye collapse) predicted by the Debye ring approximation is marked in Figure 6 by the left vertical arrow.
In the search for the phase transition in real electrically neutral electron-ion plasma, experiments were carried out (Fortov et al., Reference Fortov, Ternovoi, Zhernokletov, Mochalov, Mikhailov, Filimonov, Pyalling, Mintsev, Gryaznov and Iosilevskii2003) dealing with quasi-adiabatic explosion compression in the cylindrical geometry of deuterium plasma with plasma density measurement by pulsed X-ray radiography. The experimental results showed a sharp (about 25%) jump of the plasma density at pressures of about 1.2 Mbar, just in the range of parameters where electro-physical measurements (Weir et al., Reference Weir, Mitchell and Nellis1996; Fortov et al., Reference Fortov, Ternovoi, Zhernokletov, Mochalov, Mikhailov, Filimonov, Pyalling, Mintsev, Gryaznov and Iosilevskii2003) clearly demonstrate a sharp (about five to six orders of magnitude) increase in the electrical conductivity (Fig. 11), while Monte Carlo calculations (Filinov et al., Reference Filinov, Levashov, Bonitz and Fortov2005) lose their stability. The non-ideality parameters estimated for these conditions are Γ ~ 150–200 with partial plasma degeneracy nλ3 ~ 1. Presumably, the thermodynamic and electro-physical measurements attest to experimental detection of a phase transition in non-ideal plasma upon multiple shock compression.
Electrical conductivity and adiabatic compressibility of deuterium plasma.
The temperature ionization of dense plasma was studied in experiments on shock-wave compression of heavy inert gases; due to high molecular mass, they are especially efficiently heated in shock waves. The experimental Coulomb (caused by electron scattering from charges) component of the static electrical conductivity of plasma in the dimensionless form  ${\rm \sigma} ^{\ast} = {\rm \sigma} {\rm \omega} _P^{ - 1} $; where
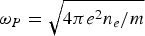 ${\rm \omega} _P = \sqrt {{{4{\rm \pi} e^2 n_e } / m}} $ is the Langmuir frequency (Fig. 12). It can be seen that the experiment covers a broad range of parameters including the high-density region (up to 3 g/cc) and plasma non-ideality values Γ >10. In this range, the existing electrical conductivity models produce unphysical results (Spitzer and Coulomb divergences) caused by over-estimation of the Coulomb scattering and screening effects (Ivanov et al., Reference Ivanov, Mintsev, Fortov and Dremin1976; Mintsev et al., Reference Mintsev, Fortov and Gryaznov1980; Adams et al., Reference Adams, Reinholz, Redmer, Mintsev, Shilkin and Gryaznov2007).
Dimensionless Coulomb component of electrical conductivity of nonideal plasma at high temperatures T ~ J.
Subsequently these electrical conductivity measurements were supplemented by fairly useful measurements of the Hall conductivity of shock-compressed plasma (Shilkin et al., Reference Shilkin, Dudin, Gryaznov, Mintsev and Fortov2003) in a longitudinal magnetic field, resulting in determination of the carrier concentration, as this is commonly done in the semiconductor technology.
Measurements of resonance laser radiation reflection from shock-compressed plasma (Mintsev & Zaporoghets, Reference Mintsev and Zaporogets1989; Reinholz et al., Reference Reinholz, Ropke, Morozov, Mintsev, Zaparoghets, Fortov and Wierling2003) provide independent information about the number of free electrons and the frequency of electron collisions and thus serve for indirect verification of the models of plasma ionization and scattering in non-ideal plasma. The data shown in Figure 13 indicate that the plasma reflection coefficient increases with increase in the plasma density to reach high values characteristic of metallic mirrors. Measurement of reflectivity at different angles gives information about shock wave front width which is proved to be about 200 mcm for shock waves in xenon (Zaporoghets et al., 2009).
Curves for coefficients of reflection (R) of laser beam vs. electron concentration. ν/ωL is the ratio of the frequency of electron collisions to the laser beam frequency.
The shock-wave compression of “ordinary” metals (Fortov et al., Reference Fortov, Yakushev, Kagan, Lomonosov, Maksimov, Magnitskaya, Postnov and Yakusheva2002) revealed a remarkable behavior of the degenerate strongly non-ideal plasma in the megabar pressure range. According to the views existing until now (Gantmakher, Reference Gantmakher2005), the electronic properties of alkali metals are described by the simple model of uniform electron Fermi gas with point ions being located inside. However, modern quantum mechanical models (Neaton & Ashcroft, Reference Neaton and Ashcroft1999) predict the formation at elevated pressures (0.3 to 1.0 Mbar) of intricate crystal structures with high coordination numbers in which the conduction electrons are paired and, consequently, the conductivity decreases. Experiments on Li, Na, and Ca quasi-adiabatic compression in this dynamic pressure range (Osip'yan et al., Reference Osip'yan, Avdonin, Kagan, Nikolaev, Postnov, Sidorov, Shakhrai, Shestakov, Kveder and Fortov2005; Fortov, Reference Fortov2011) steadily demonstrate this unusual effect, pressure-induced “dielectrization” of ordinary metals (Fig. 14). It can be seen that compression results first in an increase in the lithium resistivity, and hence, a decrease in the metal conductivity (“dielectrization”), while starting from 1.2–2 Mbar, the metal switches again to the metallic state, which will probably be fully retained during further compression.
Structure and electron density distribution for high-pressure phase and pressure-induced “dielectrization” of degenerate lithium plasma. The arrows indicate the breaks of conductivity, which are attributed to the appearance of a new (indicated nearby) phase and metallic conductivity; the numerals near the dots are calculated temperatures.
Studies by advanced techniques of quantum chemistry revealed an unexpected pattern of structural transformation of matter following pressure increase. Just several years ago it was believed that the phase diagram of a substance is rather simple: as pressure increases, the substance transforms into more and more dense structures, dielectrics finally turn into metals, and the position of the melting curve obeys the Lindemann law. However, recent density functional theory calculations showed that inner electrons have a pronounced effect on the phase diagram appearance. In relation to lithium (Fig. 15), it can be seen that at higher pressure new phases appear, i.e., the following transformations take place
 $$BCC \Rightarrow FCC \Rightarrow c116 \Rightarrow Cmcf24 \Rightarrow P432$$
and the melting curve acquires an unexpected form with negative dT/dP values in the megabar pressure range.
Phase diagram of lithium (Tamblyn, Reference Tamblyn, Raty and Bonev2008).
4. SHEAR VISCOSITY
Another transport parameter which is very important for understanding of strongly coupled plasma properties is a shear viscosity (Fortov & Mintsev, Reference Fortov and Mintsev2013). Fact is that the string theory methods led to the hypothesis that the ratio of shear viscosity coefficient to volume density of entropy of any physical system has a lower bound (Kovtun et al., Reference Kovtun, Son and Starinets2005)
 $$\displaystyle{{\rm \eta} \over s} \ge \displaystyle{\hbar \over {4{\rm \pi} k_B }} = Q_L = 6.08 \cdot 10^{ - 13} K\hskip-1pt \cdot_{}^{}\hskip-1pt s$$
It is very important to have any experimental demonstration of this ratio that may be basis for the string theory. Another important question is associated with the definition of the perfect liquid. In accordance with the classical definition, the viscosity is a familiar property, associated with the tendency of a substance to resist flow. The shear viscosity coefficient defines how small perturbation passes through the substance due to the particles interaction in the system. Small values of the shear viscosity coefficient correspond to the system with the strong inter-particle interaction. The ideal gas of non-interacting particles is another case of infinitely high values of the shear viscosity. Therefore, among the systems with small values of the shear viscosity coefficients, which are often called “perfect liquids,” the systems with strong inter-particle interaction are of particular interest.
One of the most perspective pretenders for this name are quark-gluon plasma with the values of η/s ~  $Q_L $ (Kovtun et al., Reference Kovtun, Son and Starinets2005; Bhalerao, Reference Bhalerao2010) and ultracold Fermi gas of lithium atoms with the value of
 $\displaystyle{{\rm \eta} \over s}$ ~ 7Q L (Turlapov et al., Reference Turlapov, Kinast, Clancy, Luo, Joseph and Thomas2007).
Today the viscosity coefficient of the strongly coupled electromagnetic plasma is measured only in the weakly correlated dusty-plasma systems (Fortov et al., Reference Fortov, Petrov, Vaulina and Timirkhanov2012) and the single-layer complex (dusty) plasma (Hartmann et al., 2011). As for measurements in the shock waves, we know only results of measurements of shear viscosity of several metals like Fe, Al, Pb, U at the pressures up to the 250 GPa (Mineev & Funtikov, Reference Mineev and Funtikov2004). At the same time there is a huge array of experimental data on thermodynamic, transport, and optical properties of the strongly coupled plasma generated by dynamical methods (Fortov, Reference Fortov2011) and it is interesting to find the viscosity from these experimental data. The experimental data (that we have discussed in the previous paragraph) on the measurements of electrical conductivity of hydrogen, deuterium, and rare gases under the intense shock compression and under the quasi-isentropic compression in multistep loading up to megabar pressures proved to be the most interesting for our purposes. In these experiments, a very wide range of parameters of plasma with advanced ionization and strong Coulomb inter-particle interaction was realized: the pressures of P ~ 1–103 GPa, the temperatures of T ~ 103–105 K, the coupling parameters of Γ ~ 0.1–200 and the degeneration parameters of n eλe ~ 0.1–100. The recorded level of conductivity was close to that of metals and proved to be σ ~ 104–2 × 10⁵ Ω−1m−1 due to the presence of strong inter-particle interactions leading to the “pressure ionization” effect.
Estimations of the shear viscosity of strongly coupled plasma on its data on electrical conductivity were done in the work by Fortov and Mintsev (Reference Fortov and Mintsev2013). They have considered the fully ionized ideal plasma with classic or degenerate electrons with mass m e with concentration n e and mass ions m j = M with concentration n i and average charge Z. While observing the kinetic coefficients they have followed the approach stated in monograph (Shkarofsky et al., Reference Shkarofsky, Jonston and Bachynski1966). One can find the expression for shear viscosity coefficient η defined through electrical conductivity σsp
 $${\rm \eta} = k_{\rm \gamma} \displaystyle{1 \over {Z^3 }}\sqrt {\displaystyle{{Mm_e } \over {e^2 }}} kT_i \left({\displaystyle{{T_i } \over {T_F }}} \right)^{3/2} \displaystyle{{\Lambda _{ei} \left({T_F } \right)} \over {\Lambda _{ii} \left({T_i } \right)}}{\rm \sigma} _{sp}$$
where T i and T F are ion and electron component temperatures, Λii and Λei are the Coulomb logarithms.
To determine the thermodynamic parameters of the shock-compressed plasma with strong inter-particle interaction “quasi-chemical” model SAHA was used, in which the Coulomb interaction is described within the Debye approximation in the grand canonical ensemble. Also it takes into account the degeneracy of the electronic component and the short-range repulsion of the atoms and ions in the approximation of soft spheres. This model has the correct asymptotic behavior of the ideal plasma model at low densities and good description of the experimental data in the region of strong coupling. Necessary for further evaluation the entropy density s was also estimated in the framework of the SAHA model, adjusted for the interparticle interaction and degeneracy.
The results of such calculations of the ratio of the shear viscosity coefficient to the volume density of entropy in the units of  $\displaystyle{\hbar \over {4{\rm \pi} k_B }}$ depending on coupling parameter Г are presented in Figure 16. The lower quantum bound is a unit Q L= 1 in these variables. Several theoretical curves for the strongly coupled plasma at the temperature of T = 104 K are also presented. The solid and dotted curves are calculated using the Coulomb logarithm with r M = r D and
 $r_M \approx n^{ - 1/3} $ correspondently. Calculations with the semi-empirical models of viscosity and entropy of the strongly coupled plasma in the frames of the one-component plasma approximation (Thoma & Morfill, Reference Thoma and Morfill2008) are presented by the dotted curve in Figure 16. The lower possible limit of η/s for the one-component plasma is represented by the dush-dotted curve 4. Calculations for unitary Fermi Gas (Wlazłowski et al., Reference Wlazłowski, Magierski and Drut2012) are placed like UFG curve and T-matrix calculations — rombs.
Dependence of the ratio of shear viscosity coefficient to the volume density of entropy on coupling parameter.
It is seen in Figure 16, that the values of η/s at Г ~ 1 calculated from the experimental data on conductivity of the strongly coupled argon and xenon plasma, which correspond to the relatively low pressures of Р ~ 1–10 GPa and temperatures of Т~ (2–3) × 104 К, are η/s ~ 10³Q L and well agree with the theoretical models. The data in the megabar pressure range for the rare gases are η/s ~ 10–10²Q L at Г ~ 1–10 and do not contradict to the theoretical models. The data on hydrogen, deuterium, and helium-hydrogen mixture obtained in the “metallization” range at Р ~ 150 GPa in the different experimental systems by the method of quasi-isentropic compression attain the values η/s ~ (0.3–10)Q L. Thereby, the hydrogen (deuterium) plasma shows the lowest values of the shear viscosity to the entropy ratio in the “metallization” range. It should be noted that the extremely high values of the coupling parameter Г ~ 20–80 are realized in this case.
It is interesting to note, that the data on electrical conductivity of strongly coupled electromagnetic plasma, confirm the tendency of decreasing of the viscosity η/s with an increase in the correlation (Г) and thus confirm trend of the transition of the physical system to the perfect frictionless fluid with the increasing of the inter-particle interaction.
ACNOWLEDGMENTS
Work was supported by government contract H.4x.44.90.13.1112 and by program of presidium of RAS P-02