

1. Introduction
Recent GDP-estimates lend little support for important long-term gains in per capita income in pre-industrial Europe (van Zanden Reference van Zanden and Prak2001; Maddison Reference Maddison2007; Angeles Reference Angeles2008). A similar observation can be made for the development of the purchasing power of early modern wages, in that after the alleged ‘Golden Age of Wage Labour’ in late medieval Europe, wage labourers’ living standards experienced little if any advancement (van Zanden Reference van Zanden1999; Allen Reference Allen2001; Pamuk Reference Pamuk2007). Indeed, real wages and per capita incomes often followed divergent paths of development. Even in England and the Low Countries, where wage labourers were much better off than colleagues elsewhere in Europe, GDP per capita structurally diverged from real wages (Allen Reference Allen2003; van Zanden Reference van Zanden, Allen, Bengtsson and Dribe2005). Hence, few scholars deny that periods of economic achievement and population growth in pre-industrial Europe often coincided with major redistributions of income.
Sixteenth-century Europe is traditionally marked as an epoch of strong economic development and substantial wealth accumulation, both paid for by the masses of (urban and rural) wage labourers (Lis and Soly Reference Lis and Soly1979). The economic and social historiography of the Netherlands fits smoothly into this broad picture (Aerts Reference Aerts, Blockmans and Mout2004). Ever since the 1960s prominent scholars, including Etienne Scholliers, Herman Van der Wee, Raymond van Uytven, Leo Noordegraaf and Jan Luiten van Zanden, have engaged the study of prices and wages and connected their observations about changing living standards to patterns of economic growth and development (Scholliers Reference Scholliers1960, Reference Scholliers1975; Van der Wee Reference Van Der Wee1963; Van Uytven Reference Van Uytven1972; Verlinden et al. Reference Verlinden, Craeybeckx, Scholliers and Burke1972; Noordegraaf Reference Noordegraaf1985; Blomme and Van der Wee Reference Blomme, Van Der Wee, Maddison and Van der Wee1994; Munro Reference Munro and Blanchard1994, Reference Munro, Dalzell and Nauert2003a, Reference Munro and Caviociocchi2005; Noordegraaf and van Zanden Reference Noordegraaf, van Zanden, Davids and Lucassen1995).
In the Southern Netherlands, which – triggered by commercial and industrial growth forces – achieved remarkable economic performance (Blomme and Van der Wee Reference Blomme, Van Der Wee, Maddison and Van der Wee1994), the masses of urban labourers are generally thought to have suffered from a combination of wage stickiness and inflation. Sharp reductions in the living standards of the working labourers were recorded, especially outside the buoyant metropolis of Antwerp (Van Uytven Reference Van Uytven1974a; Soly and Thijs Reference Soly and Thijs1979; Blondé Reference Blondé1987; Van der Wee Reference Van Der Wee and Van der Wee1988; Stabel and Vermeylen Reference Stabel and Vermeylen1997; Dambruyne Reference Dambruyne2001; Blondé and Limberger Reference Blondé, Limberger and Van Uytven2004). Furthermore, although Antwerp's position as a commercial gateway enhanced development in several regions, cities and sectors, it also catalyzed important relocations of economic activity. Such relocations often favoured major towns at the expense of smaller urban centres in Brabant and the Low Countries in general (Blondé and Van Uytven Reference Blondé and Van Uytven1996). Unsurprisingly, tendencies of economic concentration aggravated the relatively precarious social conditions in smaller production centres. Even building craftsmen and wage labourers in Antwerp suffered deprivation. Especially during the first four decades of the sixteenth century, Antwerp masons’ wages lagged behind prices. This has led several authors to connect the spectacular Antwerp Golden Age to enhancing processes of wealth accumulation as well as social polarization and pauperization (Scholliers Reference Scholliers1960; Lis and Soly Reference Lis and Soly1979; Soly Reference Soly and Van der Stock1993). Counter to this mainstream of ‘pessimist’ social historians, Herman Van der Wee has quite optimistically credited the Antwerp Golden Age with agreeable living standards for the bulk of the urban populace and with thriving middling groups that greatly benefited from the alleged general prosperity of the sixteenth century. According to Van der Wee, these favourable circumstances even comprised a constitutive factor in the later Dutch Revolt (Van der Wee Reference Van Der Wee1963, Reference Van Der Wee and Van der Wee1993a; see also Dambruyne Reference Dambruyne2002).
This article merges with this more optimistic reading of living standards in the sixteenth-century urban centres of the Low Countries. Paradoxically, we will come to this conclusion while fully reasserting the value of strategic evidence collected by the adherents of the ‘pessimist’ school. In our opinion, generations of economic historians, despite meticulously designing price and wage methodologies, have failed to ground claims of supposed representativity of the ‘typical’ wage labourers for the urban populace as a whole. Indeed, the question of whether real wages are ‘targeted more closely to the masses of population’ (Allen et al. Reference Allen, Bengtsson, Dribe, Allen, Bengtsson and Dribe2005, p. 9; Maddison Reference Maddison2007) remains open to empirical research rather than theoretical reflection alone (compare Tilly Reference Tilly and Levine1984). Secondly, this article responds to the growing need for a socially diversified approach to the study of living standards (Allen et al. Reference Allen, Bengtsson, Dribe, Allen, Bengtsson and Dribe2005; Hoffman et al. Reference Hoffman, Jacks, Levin, Lindert, Allen, Bengtsson and Dribe2005). In particular the income positions and prospects of middling peoples must be studied more closely (Farr Reference Farr2000; Dambruyne Reference Dambruyne2002; Blondé Reference Blondé, Blondé, De Munck and Vermeylen2004). Hence, the ultimate purpose of this article is to provide controlled estimates of the living standards of the myriad artisans, servants, merchants, shopkeepers and clergymen who made the wheels of the urban economy spin. However, sources for these social groups are quite limited, and the extreme social and economic diversity of the middling layers complicates any attempt to address these groups directly. In order to bypass this major obstacle we will endeavour to benchmark (exceptionally rich) fiscal data; this will allow for income stratification of the entire urban population along with the well-documented evidence for building workers’ wages. Key questions guiding our thoughts through the following pages are whether calculated real wage developments paralleled changes in aggregate and median urban income and how labour wages diverged from other income sources.
2 Setting the scene: economy and society in sixteenth-century 's-Hertogenbosch
's-Hertogenbosch comprises an excellent test case for this analysis for several reasons. The macro-economic fate of 's-Hertogenbosch is well documented and derives its significance from close interconnections with the spectacular development of the Antwerp market (Van der Wee Reference Van Der Wee1963, Reference Van Der Wee and Van der Wee1993b; Van Uytven Reference Van Uytven1974b, Reference Van Uytven, Van Uytven, Bruneel, Koldeweij, van de Sande and van Oudheusden2004; Blondé Reference Blondé1987; de Vries and van der Woude Reference de Vries and van der Woude1997; van Zanden Reference van Zanden and Prak2001). The city is also fortunate in that it possesses a unique series of detailed tax registers and a collection of richly informative city accounts.Footnote 1
Until the 1520s, 's-Hertogenbosch witnessed marked economic and demographic expansion in the wake of the growth of Antwerp, the commercial metropolis (Blondé Reference Blondé1987, Reference Blondé, Blondé, De Munck and Vermeylen2004; Blondé and Limberger Reference Blondé and Limberger1998; Schuttelaars Reference Schuttelaars1998). At the flourishing Brabantine fairs of Antwerp and Bergen-op-Zoom, chief merchants and smaller producers enjoyed major commercial outlets for their products, hence fuelling a thriving urban economy. As the periodic fairs began declining (from the 1530s onwards), inhabitants of 's-Hertogenbosch re-directed their attention to the rising, permanent international market of Antwerp. The commercial metropolis on the river Scheldt increasingly dominated the Low Countries as a primary gateway for urban export industries. Building on the booming Antwerp market, 's-Hertogenbosch managed to export considerable quantities of linens, pins and knives to the international markets. This northern Brabantine city's close integration into the Antwerp market likely allowed it to fare better than most regions located further from the Antwerp nexus. Yet, this favourable location did not prevent economic growth from slowing after the 1520s. In particular the growing focus on products with relatively low added value and unequal division of profits between (often non-resident) merchants and local producers can be held responsible in this respect. Aggregate consumer data lend support to this economic chronology (Blondé Reference Blondé1987; Van Uytven and Blondé Reference Van Uytven, Blondé, Coopmans and van der Veen1988; Blondé and Limberger Reference Blondé and Limberger1998; Schuttelaars Reference Schuttelaars1998).
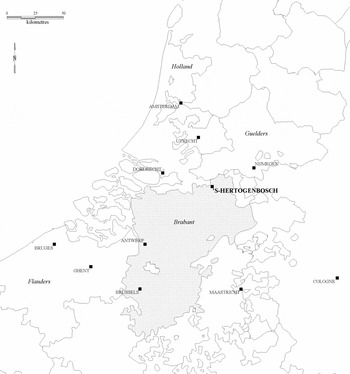
's-Hertogenbosch and the sixteenth-century Low Countries

Although 's-Hertogenbosch reached a demographic peak of some 20,000 inhabitants by the mid-sixteenth century, its population dropped to 13,000 by the 1580s and would remain at this level until well into the nineteenth century (Schuttelaars Reference Schuttelaars1998, pp. 46–77). During the 1550s 's-Hertogenbosch and its surrounding countryside suffered from almost continuous warfare with the nearby enemy duchy of Guelders and from severe spells of pestilence and other ‘wonderlike siecten’.Footnote 2 But recovery was swift and, all in all, Lodovico Guicciardini was fairly accurate when he claimed that 's-Hertogenbosch in 1567 was a city ‘crammed with arts and crafts’ and populated with ‘commercially minded’ people (cited in Blondé and Limberger Reference Blondé and Limberger1998, p. 87). From the early 1570s onwards, however, political and religious turmoil and the culmination of structural economic processes crippled the urban economy.Footnote 3
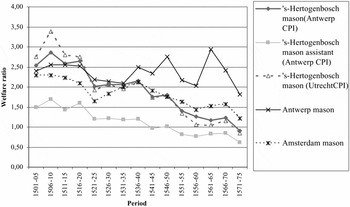
Meanwhile, a marked wage-stickiness coincided with rapidly rising prices of food and other goods, leading to deterioration in the purchasing power of labourers’ daily wages (Figure 2, detailed information on the figures underlying this graph is provided below, Section 3).
Real wages in the Low Countries

By 1500 differences in living standards were comparatively small throughout the Low Countries. Antwerp mason helpers held the lowest nominal wages of all southern towns, yet from the 1530s Antwerp wages proved more resilient to the emerging price revolution. By mid-century, Antwerp wages and purchasing power had risen far above those of all other towns in the Netherlands, north and south alike (Van der Wee Reference Van Der Wee1963, Reference Van Der Wee and Van der Wee1993c; Scholliers Reference Scholliers1975; Allen Reference Allen2001; van Zanden Reference van Zanden, Allen, Bengtsson and Dribe2005). Hence, 's-Hertogenbosch probably does more to capture the sixteenth-century experience of cities like Ghent, Bruges, Alost, Diest, Louvain, Lier and Brussels, all of which suffered similar wage deficits compared to Antwerp, or indeed the Netherlands in general (Scholliers Reference Scholliers1975, pp. 105–6; Aerts Reference Aerts, Blockmans and Mout2004, p. 217; van Zanden Reference van Zanden, Allen, Bengtsson and Dribe2005). Thus, although the first half of the sixteenth century saw general albeit modest economic growth in 's-Hertogenbosch, this evolution accompanied marked impoverishment of its wage-labouring population. From the 1520s and especially the 1540s onwards, wage stickiness prevented living standards from keeping pace with the rising prices of consumer goods.
This observation gains perspective when we consider the social inequality as reflected in the fiscal sources at the heart of this article. Our exploration is well served by the availability of a detailed series of poll taxes, the so-called gemene zettingen or general levies. These records allow for quantitative social stratification of urban society and can be considered among the best of their kind for this period (Blondé Reference Blondé1987, pp. 1–48; Schuttelaars Reference Schuttelaars1998, pp. 281–302; Hanus Reference Hanus2007, pp. 32–46). In short, two levies were based on house rents (10 per cent in 1505/6 and 6.7 per cent in 1547), while the general levies of 1552/3 and 1557/8 taxed income. Finally, a number of early sixteenth-century taxes were levied according to the condition, power, honour and wealth of the tax payer.Footnote 4 Yet analysis of the public annuity buyers among the taxpayers suggests that these early sixteenth-century levies were in fact a mixture of wealth and income taxes similar to the levies of 1552/3 and 1557/8 (Hanus Reference Hanus2007, pp. 111–13). More accurately, based on the same parameters of total, average and individual contributions, one can conclude that all general levies were imposed on similar grounds and that they can be meaningfully compared.
The sources offer cautionary notes against an overly optimistic reading. Most importantly, the income levy of 1552/3 (and presumably 1557/8) appears to have put a larger burden on house owners, taxing these households for their urban property. Thus, the general outlook of urban social inequality becomes somewhat warped and the individual positions of the assessed citizens in the tax hierarchy emerge as less trustworthy. The case of town carpenter Henske vanden Dungen (discussed below) substantiates this problem. Conversely, home ownership could and did render major differences in its own right, since it eliminated rent payments, facilitated extra income (via subletting), and provided necessary collateral for annuities and loans. In worst-case scenarios, selling one's house could raise substantial money (Woodward Reference Woodward1995, p. 236). In any case, there is little doubt that the contemporary tax collectors, who were most likely leading figures within every parish or ward, had a fairly accurate idea of the taxable assets (income, wealth, etc.) of their flock and taxed them accordingly. Consequently, the relative fiscal hierarchy in these lists offers an excellent perspective on the relative financial position of the households (Blondé Reference Blondé1987).
Some of the better-documented individual cases support this view. Consider workman Cornelis vande Venne and his assistant Willem Voss, who provided numerous services and freight transport for the city council between 1501/2 and 1512/13. During the first half of the decade, Cornelis laboured between 246 and 284 days annually (on average 156 days at 4 stuivers or 8 d. groot Flemish summer wage and 108 days at 3.5 stuivers or 7 d. groot Flemish winter wage) while his assistant saw his workload increase annually, from 215 to 268 days per year (at 2.5 and 2 stuivers respectively). The number of working days suggests that city service constituted the men's only employment (Noordegraaf Reference Noordegraaf1985; Allen Reference Allen2001; Munro Reference Munro and Caviociocchi2005). In 1510/11, Cornelis worked 229 days, followed by just 156 days a year later, and 217 days in 1512/13. At the same time, both workmen swapped place in the city accounts. From 1510/11 onwards Willem was carefully ranked before Cornelis, suggesting that the former was becoming more important than the latter. Indeed, during the last three years (1510/13), Willem worked more days per year than Cornelis, again confirming Willem's rise as a more prominent city workman. It should be noted that by 1513 this climb was not yet completed, for Willem was still paid less than Cornelis on a daily basis. Yet Cornelis's drop in wage earnings – a result of underemployment between 1510 and 1513 – found reflection in his tax history. While Cornelis paid the equivalent of 15 stuivers of taxation between 1500/1 and 1506/7, he contributed only 8 stuivers in 1511/13. Willem, conversely, saw his tax contribution rise from 2.5 stuivers in 1501/2, via 3 stuivers in 1502/5 and 3.5 in 1505/6 up to 5 stuivers in 1511/13. In both cases, the decline and increase in the number of working days – and consequently in annual earnings – were reflected in tax contributions. Similarly, the famous painter Hieronymus Bosch saw his fiscal position improve during the first decade of the sixteenth century, mirroring his rise to the summit of his artistic and social fame (Blondé and Vlieghe Reference Blondé and Vlieghe1987, pp. 699–700). As such, we have high hopes that the sixteenth-century general levies of 's-Hertogenbosch are useable as proxies for incomes. For mid-century, supporting circumstantial evidence is provided by the probate inventory of the affluent alderman and supposed rentier Frans Bogaert. In short, the taxes paid on his annual income from annuities, leases, and other sources of wealth (totalling over 1,700 guilders or £233.3 groot, or more than thirty times the annual earnings of town carpenter Henske vanden Dungen) perfectly matched the ratio between tax contribution and yearly income found for the craftsmen and labourers that will be developed further in this article (Hanus Reference Hanus2007, pp. 107–15).
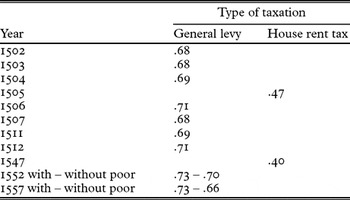
What general lessons can be drawn from closer examination of these taxes? As seen in Table 1, Gini coefficients for both early and mid-sixteenth-century income taxes offer evidence for large fiscal inequalities in the city.Footnote 5 Even compared to other early modern towns in the Low Countries, 's-Hertogenbosch, with a Gini coefficient of about 0.7, was clearly characterized by very high fiscal inequality (Van Uytven and Blockmans Reference Van Uytven and Blockmans1971; van den Berg and van Zanden Reference Van Den Berg and van Zanden1993; Boonstra and Mandemakers Reference Boonstra, Mandemakers, Dronkers and Ultee1995; van Zanden Reference van Zanden1995; Soltow and van Zanden Reference Soltow and van Zanden1998; Milanovic et al. Reference Milanovic, Lindert and Williamson2007). Although this inequality measure does not reveal any marked increase or decrease over the first decades of the sixteenth century, the large number of paupers in the 1552/3 and 1557/8 levies seems clear indication of the social and economic predicament of the urban masses by mid-century.
Gini coefficients for various tax records

However, social-economic distributions do not tell the full story of inequality. Although these fiscal totalities remained by and large similarly divided throughout the first half of the century, an equal distribution within the context of a much weaker economy would clearly imply a more unequal society, for ceteris paribus more people would fall below the poverty line.Footnote 6 Especially in 1557/8, the high number of paupers recorded as such in the levy (20.4 per cent of all tax payers) is unsurprising after half a decade of rough economic and epidemic conditions (see above).
Accounts of social inequality often switch, sometimes imperceptibly, from relative to absolute deprivation. Yet one should proceed cautiously when uniting inequality and living standards studies into one narrative. All too often, the resilience and diversity of pre-industrial urban social structures are underestimated when highly asymmetrical societies are automatically associated with near-deprived populations. Hence, given the long pedigree of living standards research on building workers, it is sensible to calibrate social inequality to socio-occupational hierarchies and to link individual cases to general tax records.
3. In search of a benchmark: building craftsmen and wage labourers
In the first half of the sixteenth century wage-earning craftsmen experienced considerable drops in the purchasing power of their daily wages. Rather than generalizing from this experience to the urban populace at large, this section will question how falling real wages affected the relative position of building craftsmen within the urban society. All the building craftsmen known to us from different sources will be envisaged. The position of a select number of well-documented and fully employed wage-earning craftsmen and labourers will then be examined in closer detail.
In order to properly assess the fate of building craftsmen in sixteenth-century 's-Hertogenbosch, all masons, carpenters and labourersFootnote 7 tagged as such in the general levies were selected. The identification of wage labourers and building craftsmen in the tax records underpinning the present research was not an easy task. Although these tax records list numerous occupational denominations, suffixes like ‘the plumber’, ‘the baker’, etc. could just as easily imply nickname as a straightforward vocational label. Moreover, no occupations were recorded for the majority of tax contributors. Thus Willem Voss is listed only with name and surname in the levies of 1506/7 and 1511/13, but in 1501/5 he is identified as Willem der stadwerckman (the city worker). Hence, given the problems of homonymy and occupational uncertainty, this list was supplemented with data found in the city accounts of 's-Hertogenbosch related to people working in masonry, carpentry, transport, or general labour. Evidently, the occupations envisaged do not capture the entirety of the building sector, although they can be considered representative nonetheless.Footnote 8
A major caveat is in order, since our analysis departs from the occupation listed for male heads of families. Undoubtedly household income will have frequently exceeded the wage incomes of the male breadwinners (Woodward Reference Woodward1981; Kaelble and Thomas Reference Kaelble, Thomas, Brenner, Kaelble and Thomas1991; de Vries and van der Woude Reference de Vries and van der Woude1997). Given the lack of detailed information about household composition, female and child labour participation, etc. we are forced to make do with the assumption that changes in annual wage earnings of the male head of household had a critical effect on general household income and therefore on tax contribution, as was the case for the previously mentioned Willem Voss and Cornelis vande Venne. Moreover, in assessing the following research results, we must take into account that not all masons and carpenters listed in Figures 3 and 4 were necessarily wage labourers in the proper sense. Although wage labour undoubtedly played a major role for most of them, some also derived substantial incomes from commercial dealings and entrepreneurial activities.
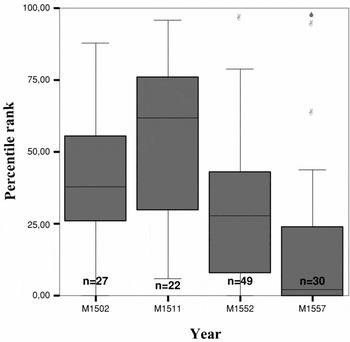
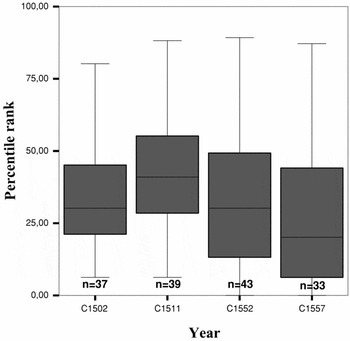
Masons in city accounts and general levies traced in levies

However, this does not prevent us from drawing several intermediary conclusions from this survey. First, masons, carpenters and, by extension, most if not all (building) artisans were clearly more prosperous than their wage-labouring colleagues. Whereas in the former group only a small fraction belonged to the poorest quarter of the urban population, the opposite holds true for the latter group. In general no more than a handful of the identified building artisans belonged to the best-off quarter, let alone the wealthiest tenth, of town.
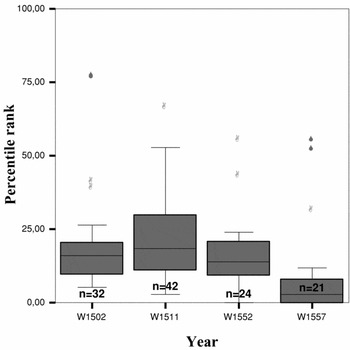
Second and more importantly for the present purposes, the first half of the sixteenth century witnessed the marked social degradation of the vocational groups studied here. For the masons of 's-Hertogenbosch the first half of the sixteenth century brought little economic progress. Indeed, as Figure 3 (which provides a statistical summary in the form of a box-and-whisker-plotFootnote 9) illustrates, the taxed masons suffered a relative social decline. While in 1511 over half the masons belonged to the richest half of town, by mid-century only a few of them could be ranked amongst the upper fiftieth percentile of 's-Hertogenbosch's best-off inhabitants. In 1557/8, 75 per cent of all taxed masons belonged to the poorest quarter of the fiscal hierarchy. The carpenters experienced social depreciation similar to that of the masons, albeit on a smaller scale (Figure 4). Carpenters who performed city services fared markedly better in the 1550s than did their mason colleagues. Yet we would probably do better to build on the figures based on vocational tagging in the levies if we are to capture the urban carpenters at large. Indeed, in the city accounts many of the well-off carpenters performing carpentry were also found to supply wood and other building materials to the city. Most likely all carpenters (and building workers in general) provided some sort of supply of construction materials, but the scale of the civic deliveries suggests a more-than-average firm performing the job (Woodward Reference Woodward1995). Finally, the labourers cutting wood, carting deliveries, assisting masons, and running errands were not found within the wealthiest groups in town (Figure 5). Some managed to position themselves within the best-off half of population, but they were clearly exceptions. By and large, wage labourers were found in the poorest quarter of the urban populace (see also Tilly Reference Tilly and Levine1984). Furthermore, although the picture is somewhat blurred by the atypical observation of 1557/8, these wage labourers suffered social decline similar to that recorded for the masons and carpenters.
Carpenters in city accounts and general levies traced in levies

Workmen in city accounts and general levies traced in levies

In conclusion, the masons especially saw their relative fiscal position decline, from generally average to well below average, and carpenters and wage labourers followed a similar trend. Clearly wage stickiness and the emerging price revolution impaired wage earning households more than they affected households less obviously dependent on wage-labour (Hoffman et al. Reference Hoffman, Jacks, Levin and Lindert2002, Reference Hoffman, Jacks, Levin, Lindert, Allen, Bengtsson and Dribe2005; van Zanden Reference van Zanden, Allen, Bengtsson and Dribe2005).
The previous exercise is highly suggestive in referring to relative movements of social-financial position in respect to changes in real wages. But for better insight, we should insert absolute figures into the equation. Following standard economic historiography, we will use the city accounts of 's-Hertogenbosch to collect information about fully employed building workers and their exact labour revenue on a yearly base. Rather than developing the data into long-term time series, we selected two short periods at the onset and middle of the century so as to achieve optimal nominal data linkage with the detailed tax levies. In order to make a tentative assessment of absolute living standards for want of price data for 's-Hertogenbosch itself, we supplemented our wage data with price histories from Antwerp and Utrecht (see below).
The town magistrates of 's-Hertogenbosch annually paid numerous crafts- and workmen for various chores. Men repaired town clocks, locks and streets; built and improved city walls, dikes and gatehouses; ran errands and delivered materials and messages; and amused the magistrates with music and song. Some citizens were invested with a degree of authority, and were known, for example, as the town carpenter (stadstimmermeester) and thereby enjoyed guaranteed and almost full-time employment. Most work- and craftsmen, on the other hand, fulfilled no more than occasional tasks or a few days’ labour (compare Van der Wee Reference Van Der Wee1963; Woodward Reference Woodward1995; Sosson Reference Sosson2005). In between, we can discern a number of resident labourers who performed most if not all the chores of a particular type, but whom the city could not supply with sufficient work to keep them employed yearlong. During the first decade of the sixteenth century, for instance, town carpenter Claes Peters worked between 89 and 174 days annually for want of more work, whereas labourers (werkluyden) Cornelis vande Venne and his assistant Willem Voss were employed between 215 and 284 days annually (see above). Others among Cornelis's collaborators, such as Dirk Heesakker or Jan van Herssels, laboured from 67 to 94 days per year. In all likelihood, for Claes Peters and the latter two, working in city service comprised only part of their annual employ. By mid-century, the same picture emerges, although by this time carpentry had become a full-time chore for stadstimmermeester Henske vanden Dungen and his successor Alard Reynders. Conversely, for werkluyden Lambert Henricks, Henrick Wouters and Jan van Schijndel, one year could provide far more opportunities than another, with employment figures ranging from just 24 days to a near full-time 260.
The daily wages earned by these labourers were modest, ranging throughout the first half of the century from 2.5 stuivers daily (2 in winter) for labourers Willem Voss, Lambert Henricks and the others, 3.125 stuivers daily for town carpenter Claes Peters, to 4 stuivers (3.5 in winter) for chief-labourer Cornelis vande Venne and mid-century town carpenters Henske vanden Dungen and Alard Reynders. Insofar as we do not aspire to make a contribution based on functional differences between these wages or their historical evolution (see in this respect Van der Wee Reference Van Der Wee1963; Blondé Reference Blondé1987; Munro Reference Munro2003b, Reference Munro and Caviociocchi2005; Blondé and Limberger Reference Blondé, Limberger and Van Uytven2004), these figures are less interesting than the actual annual earnings of the men introduced above. These incomes will be conflated with (relative) tax position and then with purchasing power.
In scrutinizing the fiscal records of 's-Hertogenbosch in search of the labourers and craftsmen mentioned above, the usual problems of homonymy arose. The level of detail in the sources allowed for identification in both city accounts and general levies of about a dozen workers who laboured over 250 days. Workmen Cornelis vande Venne and Willem Voss have been introduced above, where it was established that most chief-labourers enjoyed – unsurprisingly – better fiscal positions than did their assistants. Early sixteenth-century labourers like Willem Voss, Engbert vande Heesakker, Dirk Heesakker and Jan van Herssels were situated between percentiles (P) 20 and 34, as to about P50 for Cornelis vande Venne. Their absolute tax contributions closely followed the differentials of the annual earnings: Engbert vande Heesakker earned 551 stuivers in 1501/2 (27.55 guilders or £4.6 groot for 238 days of work), whereas Cornelis vande Venne earned 939 stuivers for 246 days of work. Compared to their tax contributions, of 10 and 15 stuivers respectively, one again has the impression that the general levies of 's-Hertogenbosch predominantly used annual earnings as tax base. Similarly, in 1511/12 and 1512/13, Willem Voss's tax contribution approximated two-thirds of Cornelis's, while his annual earnings in those years yielded the same ratio. The early sixteenth-century labourers in city service were clearly common people, of course, generally found in the percentile range 20–40.
By the 1550s, labourers like Henrick Wouters, Henrick van Boxtel and Jan van Schijndel (and town carpenter Alard Reynders) performed similar jobs and earned similar wages. Yet their fiscal position had deteriorated, since all were recorded as paupers in 1552/3 and/or 1557/8. Even Theeuwen Theeuwens, who earned over 1,400 stuivers annually during the 1550s for cleaning streets in several wards, was listed among the very poor in 1557/8.Footnote 10 The wage labourers in city service, regardless of what exactly constituted poor in the 1552/3 and 1557/8 levies, and despite comparable earnings, fell in line with the larger group delineated above and suffered relative downgrading in comparison to the beginning of the century.
In order to assess whether this relative decline accompanied decline in absolute living standards, the wage deflator used above (Figure 2) requires more systematic examination. In short, recent years have seen development of ever more elaborate baskets of consumables, or consumer price indices (CPI), to replace grain prices that were traditionally used to deflate nominal wages. Standard CPIs include quantities of bread/grain, beans/peas, meat, butter, cheese, candles, clothing and beer in order to approximate more closely the real costs of living than via grain prices alone. Second-generation CPIs are also in progress, which incorporate rents and fuel costs and provide more awareness of diverging social consumption patterns (Van der Wee Reference Van Der Wee1975; Allen Reference Allen2001; Allen et al. Reference Allen, Bengtsson, Dribe, Allen, Bengtsson and Dribe2005; van Zanden Reference van Zanden, Allen, Bengtsson and Dribe2005; Munro Reference Munro2006).
Unfortunately, price data for sixteenth-century 's-Hertogenbosch are almost entirely absent, which is why we chose to base our calculations on Antwerp and Utrecht prices.Footnote 11 A benefit of this approach is that we could use Antwerp numbers from work by Van der Wee (Reference Van Der Wee1963, Reference Van Der Wee1975), Munro (Reference Munro, Dalzell and Nauert2003a, Reference Munro2006) and Allen (Reference Allen2001). Price data for Utrecht could be fitted relatively easily with the Munro and Allen CPIs, thanks to the extensive series published by Posthumus (Reference Posthumus1964). We will not enter the debate about which goods should be included with any CPI, nor will we address whether a CPI should relate to caloric numbers or other measures of subsistence minima (see on these issues, for instance, Allen Reference Allen2001; Allen et al. Reference Allen, Bengtsson, Dribe, Allen, Bengtsson and Dribe2005; van Zanden Reference van Zanden, Allen, Bengtsson and Dribe2005; Munro Reference Munro2006). Rather, the CPIs reconstructed by Allen and Munro will be used at face value so as to assess living standards of the building workers of sixteenth-century 's-Hertogenbosch. Indeed, Bob Allen (Reference Allen2001, p. 425) has computed so-called welfare ratios which calibrate his real wages series to a ‘poverty line consumption bundle for a family’. A welfare ratio of one implies that a family of four could exactly fulfil its basic needs through the wage earnings of the male head of household. A surplus in income would result in a ratio above one.Footnote 12 Allen (Reference Allen2001, p. 427) notes, however, on his underlying assumptions about caloric intake, family size, etc. that ‘anyone who objects to these assumptions can ignore them; in that case, the welfare ratio is just a peculiarly scaled real wage index’. To complement these figures and strengthen our argument, we include the real wage series developed by John Munro (Reference Munro, Dalzell and Nauert2003a, Reference Munro and Caviociocchi2005, Reference Munro2008a), whose analysis arguably includes more extensive data on the late medieval and early modern Netherlands. It should be noted that although Munro and Allen's different methodological choices have resulted in strongly diverging series of prices and wages, their real wage series are remarkably similar. For the period 1400–1700 in general, and especially for the decades studied here, the difference in real wage indices in any given period rarely if ever exceeds 5–10 per cent (with 1500–5 as base period). Unlike Allen, Munro defines his real wages not in relation to a poverty line or caloric intake, but in terms of purchasable ‘baskets of consumables’.
The price trends and levels in Antwerp, Utrecht and Holland followed similar paths, especially for the period discussed here (Allen Reference Allen2001; van Zanden Reference van Zanden, Allen, Bengtsson and Dribe2005). As such it seems safe to assume that the price trends found for Antwerp and Utrecht approximate the price history of 's-Hertogenbosch. We found that between 1450 and the 1570s the Utrecht CPI, as expressed in absolute figures, was worth around 90 to 100 per cent of the Antwerp basket of goods. This figure dropped to about 80 per cent and even less in the following decades.Footnote 13 Clearly, the major effect of working with Antwerp prices is to overestimate the impact of the price revolution on our case study. The Utrecht prices presumably mirrored those of sixteenth-century 's-Hertogenbosch more closely, although this remains uncertain. In any case, the consumer basket equivalents calculated are minima and should be considered thus when interpreting the figures presented below.
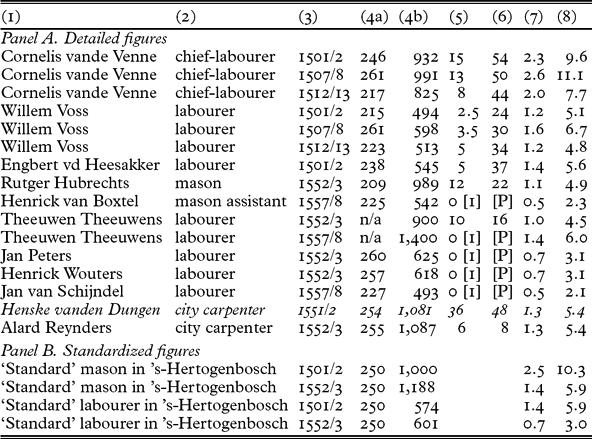
Table 2 lists most of the labourers and craftsmen for whom we could approximate annual earnings via the city accounts, and thus provide a measure of purchasing power by means of the Allen and Munro CPI-deflators. All worked some 220–250 days in city service, leading us to believe that they did not entertain other (sizeable) activities for a living. Obviously, secondary income from the work of wife or children would have interfered; but, as clarified above, since such strategies remain elusive for historical research, the current estimates must suffice. In this respect our calculations represent absolute minima. One example of the problems we encountered in interpreting these data is found in Table 2: in the general levy of 1552/3 stadstimmermeester (town carpenter) Henske vanden Dungen clearly ranks higher than his wages of some 1,080 stuivers in 1551/2 would allow (P48). A likely answer is found in the house rent tax of 1547, where Henske is seen to contribute 8.75 stuivers for a house in the Ortenstraat (P33 in this tax list). If he in effect owned this house, this would surely explain his high contribution in 1552/3, for during this tax round proprietors suffered from supplementary taxation (see above). Our inability to trace most other labourers and craftsmen mentioned in Table 2 in the house rent tax of 1547 was expected, because that year at least (the poorest) 20 per cent of urban dwellings were exempted from taxation and not recorded in the tax lists (Van de Laar Reference Van de Laar1979; Blondé Reference Blondé1987; Schuttelaars Reference Schuttelaars1998).
Craftsmen and labourers in the city accounts
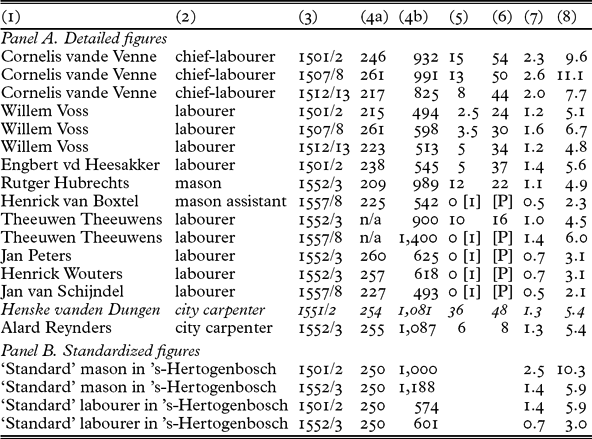
Key (1) Name (2) Jobs in city accounts (3) Year (4a) Number of days worked (4b) Annual earnings in stuivers (5) Tax contribution (in that year) [estimate14] (6) Percentile rank (in the same year) [P: pauper, not paying any taxes] (7) Welfare ratio (Allen) (8) Purchasing power (Munro)
Generally speaking, however, the figures presented in Table 2 reinforce our earlier findings. Indeed, given the development of real wages in sixteenth-century 's-Hertogenbosch, it was unsurprising that the 598 stuivers earned by labourer Willem Voss in 1507/8 secured him a welfare ratio of 1.6 and a relatively comfortable life. Conversely, the 625 stuivers earned by labourer Jan Peters in 1552/3 left him below the poverty line, as exemplified by his welfare ratio of 0.7 and his fiscal qualification as pauper, that is, too poor to contribute in the tax lists. By mid-century, years of wage stickiness and rising prices were surely felt direly by the urban labourers. Similarly, early sixteenth-century chief-labourer Cornelis vande Venne, with a welfare ratio of 2.0, could in all likelihood easily sustain a sizeable household, even though his income had dropped to 825 stuivers in 1512/13 (see above). Town carpenter Alard Reynders, however, surely fared less well despite his higher nominal earnings of 1,087 stuivers in 1552/3. It should be noted that this annual income kept Alard (and his alleged household) above the poverty line, albeit barely, as evidenced by percentile rank 8 in 1552/3 and a welfare ratio of 1.3. Interestingly, the close match between households that were considered too poor to contribute by the sixteenth-century tax collectors and those falling below Allen's absolute poverty line seems to provide additional confirmation of the accurate judgement of both.
By 1557/8, when most labourers could no longer sustain a wife and two children, the wage labourers’ situation was severe (Table 2). It was unsurprising that in the same year, after decades of wage stickiness, the first major wage adaptations were recorded. In 1558/9 stone slaters, for example, enjoyed a nominal summer wage increase from 4.5 to 5 and 6 stuivers. Masons likewise received 6 instead of 5 stuivers, and the masons’ assistants even enjoyed a 33 per cent wage increase (Blondé Reference Blondé1987, pp. 211–16).
Combining micro-level real wages with macro-level financial distributions reveals how the early sixteenth-century price revolution corroded the financial capacities of wage labourers and to a slightly lesser extent building craftsmen (compare panel B in Table 2). This applies to an absolute (in living standards) and relative level (compared to the city at large).
4. Beyond building craftsmen
What do the calculations of the previous section reveal about urban society at large? Following comments made by Hoffman et al. (Reference Hoffman, Jacks, Levin and Lindert2002, Reference Hoffman, Jacks, Levin, Lindert, Allen, Bengtsson and Dribe2005), we would render social historiography poor service in over-generalizing the experience of this particular social group, at least in the sixteenth-century Low Countries. Within the urban centres of the late medieval and early modern Netherlands, the number of semi- and unskilled workers should not be overestimated, of course; nor should pessimistic conclusions based on their purchasing power and standards of living be taken for granted when describing urban society at large. In late sixteenth-century Leuven, for example, semi- and unskilled workers comprised no more than 7 per cent of the active population (Van der Wee Reference Van Der Wee1963, p. 379). As such, it seems feasible that the urban centres of the sixteenth-century Netherlands housed fewer wage labourers than the 15 per cent Charles Tilly conjectured for ca. 1550 (Tilly Reference Tilly and Levine1984).
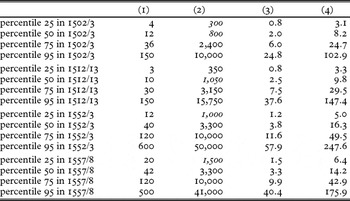
Though evidence is unfortunately limited, the nominally linked wage and fiscal data (Table 3) allow for feasible comparison of actual annual (labour) income for a handful of building workers with their tax contribution. If we extrapolate the tax contributions of the labourers and carpenters studied here at face value, the fiscal records of 's-Hertogenbosch would suggest that the urban masses fared surprisingly well during the first half of the century. These figures reveal that annual earnings of about 800 to 1,000 stuivers for someone like chief-labourer Cornelis vande Venne approximate quite closely the income for the median inhabitant of early sixteenth-century 's-Hertogenbosch. Keeping in mind that, according to Allen, these earnings represented more or less double the poverty line, and that half the urban population thus had even better prospects, 's-Hertogenbosch surely cannot be labelled a poor city by any standard. Indeed, these figures suggest that the best-off quarter of town earned at least six times Allen's minimal consumption basket. The wealthiest citizens could entertain large households, no doubt, at a welfare ratio surpassing 25.0 and even 35.0 in 1512/13. It would seem, moreover, that most of the economic growth attested for in the opening decades of the sixteenth century (Section 2) benefited the wealthier segments of society. Although all cited percentile ranks improved their situation between 1502/3 and 1512/13, most gains were clearly realized by the top 5 per cent.
Some sixteenth-century income estimates

Key (1) Tax contribution in stuivers (2) Estimated income in stuivers (3) Welfare ratio (Allen) (4) Purchasing power (Munro)
The crux of our argument centres around mid-century, for if we are to believe our extrapolations it would appear that the median tax payers in 1552/3 and 1557/8 fared even better than their counterparts early in the century. This exercise is slightly impeded by the large number of pauper labourers, for these prevent us establishing clear connections between annual earnings (which vary) and tax contributions (which are identical at 0 stuivers). This most likely causes our estimates to be too positive. Yet by mid-century the real income of the median tax payers most likely scored above their early-century equivalent. To be sure, the present estimates seem to suggest that urban society at large was faring better by the 1550s, with welfare ratios topping 3.0 for P50, 10.0 for P75, and well over 40.0 for P95, which is about where the earlier mentioned alderman Frans Bogaert and his 1,700 guilders in property income were in the fiscal distribution. The urban elites of 's-Hertogenbosch, it would seem, are easily comparable to the famed early sixteenth-century scholar and humanist Erasmus, who earned over 80 times an Antwerp mason's annual income and thereby scored a welfare ratio close to 200 (Munro Reference Munro, Dalzell and Nauert2003a). Indeed, if our estimates can be trusted, Albert van Deventer, the most well-off member of a manifestly affluent family, enjoyed a welfare ratio that was just below 300 in 1552/3 and almost 500 in 1557/8!
The numbers recorded for P25 caution against unwarranted optimism, however. Especially in 1557/8 (see above), it would not be surprising to find that tax collectors were more lenient towards the urban poor and thus excluded more inhabitants from tax payment than before. This would imply that our distribution starts at a higher point, meaning that what we consider to be P25 should actually be considered closer to P30 or even P35 compared to earlier taxes. In other words, as to the mid-century figures, we believe our estimate of the living standards of the lower quartile is too rosy. Also, it should be noted that although these figures might suggest an increasing inequality between top and bottom, the reader should recall the overall stability of inequality as suggested by the Gini coefficients in Table 1.
Evidently, the empirical foundations of this section are slippery at best. The conclusions presented are based on a small group of little more than a dozen people, and so the extrapolations enlarge margins of error. Nevertheless, a strong case can be made for a thriving urban populace, both in the early and middle decades of the century. These figures corroborate some of our earlier findings on the strength of the sixteenth-century urban middling sort (Blondé Reference Blondé, Blondé, De Munck and Vermeylen2004; Blondé and Limberger Reference Blondé, Limberger and Van Uytven2004). Labourers, small masons, slaters, etc. on the other hand, were evidently very common people indeed. For sixteenth-century 's-Hertogenbosch and other urban centres in the Low Countries, their particular social and economic experience held little predictive value for the vast majority of the urban populace. The sheer complexity, size and diversity of the urban commercial, retailing and service sectors testify to a relatively wealthy populace that generated substantial local demand for various (semi-)luxury products and services (Van de Laar Reference Van de Laar1979). The numerous goldsmiths, painters, cabinetmakers, mercers, wine merchants and other providers of (semi-)luxury goods and services enjoyed (mostly) favourable incomes and earned their livings thanks to diversified demand from broad layers of the urban society itself.
A recent study of the annuity market of 's-Hertogenbosch (Hanus Reference Hanus2007) offers circumstantial evidence in support of our more optimistic reading of the standards of living in sixteenth-century urban societies. Although the evidence at our disposal relates only to the start of the century, sales of annuities in the early sixteenth century are highly suggestive. Both private and public annuities were studied, the difference being in the debtor of the contract: in the latter case the city council sold annual instalments (renten or annuities) in exchange of a principal sum worth 12, and up to 20, times the annuity, that is, at 5 to 8 per cent annual interest, whereas in the former two or more private persons sealed the deal. In general, the city council of 's-Hertogenbosch sold mostly life annuities (lijfrenten), which were principally non-inheritable and non-transferable and therefore yielded a higher interest rate. Private households clearly and understandably preferred to contract hereditary annuities (erfrenten) that often remained in family hands for generations. In comparing the hundreds of folios of annuity keepers and buyers from the city accounts and the thousands of creditors and debtors from the aldermen's rolls of 's-Hertogenbosch with the general levies underpinning this research, new and surprising insights were gained into the financial dealings of the city dwellers of sixteenth-century 's-Hertogenbosch. These insights generally confirm the largely optimistic scenario introduced in this article, although the available evidence currently relates only to the early sixteenth century.
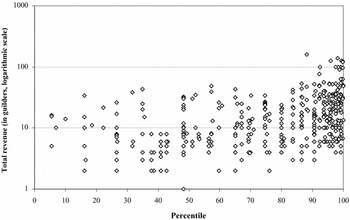
It was found that surprisingly broad layers of society enjoyed income from public annuities. This highlights again the structural blindness of real-wage studies to incomes due to land and capital (compare similar findings in De Moor et al. Reference De Moor, Zuijderduijn and Van Zanden2008). For most of the lower percentile groups displayed in Figure 6, the total amount received each year was relatively small; but the impact of 10 or 20 guilders on an annual budget of 50 or 100 guilders should not be underestimated. Some level of capital accumulation clearly occurred within all urban groups, although these figures cannot clarify whether annuities were bought from personal savings or resulted from inheritances. However, since most annuities recorded in Figure 6 were non-inheritable life annuities, there is no doubt that these were bought either by the keeper him- or herself or the parents.
Public annuity keepers in the 1502/03 general levy (scatter plot)

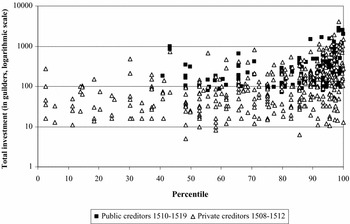
Social analysis of the buyers of public and private annuities during the first decades of the century (Figure 7) offers further evidence for the purchasing and savings power of large segments of the sixteenth-century population of 's-Hertogenbosch. Clearly people from different social layers were capable of investing considerable money on capital markets. Although the best-off in town were found (unsurprisingly) to be the most active players on these capital markets, a large number of middling and even lower urban groups managed to accumulate or keep enough savings (either within their own lifetimes or intergenerationally) to purchase small or reasonably sizeable annuities.
Public and private creditors in the 1511/12 general levy (scatter plot)

Although more research is needed into the processes of capital accumulation leading to these purchases, that numerous poorer households were able to invest 10, 20, or as much as 100 guilders provides compelling evidence for the general prosperity of the urban society at large. Indeed, around 1510, 20 guilders comprised about 80 per cent of the yearly income of labourer Willem Voss, and 40 per cent of the earnings of chief-labourer Cornelis vande Venne or any fully employed master mason or carpenter. That modest townspeople like Cornelis and Willem could invest such high portions of their annual earnings indicates the substantial saving potential, be it intra- or intergenerational, that even relatively poorer groups must have had.
These graphs provide compelling evidence for the opulence of many of the best-off inhabitants of sixteenth-century 's-Hertogenbosch. In the few years covered in this study (1508/12 for private and 1510/19 for public annuities), we see numerous households investing over 1,000 guilders. The merchant Ambrosius vanden Hanenberch, to offer but one extreme example, invested some 7,000 guilders, or close to 1,000 guilders per year, in public and private annuities (Hanus Reference Hanus2007, pp. 102–8). Perhaps the most compelling evidence for the general prosperity of sixteenth-century 's-Hertogenbosch is its public capital market: during the tumultuous – and highly expensive – final decades of the fifteenth century and in the first half of the sixteenth century, the city council and treasury sold annuities worth hundreds of thousands of guilders to their own inhabitants without recourse to ‘foreign’ investors (Hanus Reference Hanus2007, pp. 51–7).
The social and economic effects of the wealth redistributions entailed by these massive sales deserve further attention, but there is no doubt that within the walls of 's-Hertogenbosch considerable savings were accumulated. Although these savings were evidently very unevenly distributed, as further evidenced by the high income inequalities established above, the investment potential of broad layers of the urban populace should not be underestimated. This adheres to our optimistic argument for the overall income position and living standards of the urban masses.
5. Conclusions
The conclusions of this article parallel the growing evidence about divergence between GDP per capita and real wages in pre-industrial Europe (van Zanden Reference van Zanden, Allen, Bengtsson and Dribe2005, pp. 187–8; Pamuk Reference Pamuk2007; Angeles Reference Angeles2008). The divergence between wage and output growth also appears to explain the longstanding debate concerning the living-standards paradox of the sixteenth-century Netherlands.
An examination of building workers and labourers revealed that their decline in living standards during the early sixteenth century accompanied marked social decline. Yet, importantly, mainstream living-standard studies offer little hesitation to overstretch the solid quantitative results, based on wages of institutional building workers and labourers, and generally elaborate consumer price indices, to presupposed large segments of society. Studies on changes in living standards and real incomes that are largely based on construction real-wage indexes for building craftsmen, in particular of masons and carpenters, are fraught with many dangers, however. More often than not, such studies do not account for employment ratios, household labour participation, life-cycle changes, and, most importantly, other sources of income that determined the social and economic position of households. By studying the income taxes raised in sixteenth-century 's-Hertogenbosch, we were able to take these factors (albeit indirectly) into account. By tracing several sixteenth-century building craftsmen and wage labourers in the tax registers at our disposal, we demonstrated that the budding price revolution and its corroding effects on purchasing power left the majority of the urban population generally unaffected. For several reasons our calculations may yield an overly optimistic view. Yet, although a large margin of error should be taken into account, the results are sufficiently convincing to state that the marked fall in purchasing power faced by wage labourers was not shared by the urban population at large. Not only do the absolute standard of living figures fail to encapsulate urban society, but it is questionable whether the trends sketched in numerous real-wage studies are in fact more illuminating than the experience of a particular – and in the early modern Low Countries relatively small – group of (semi- and unskilled) wage labourers.
Additional research is needed to put these research results into wider chronological and geographical perspective. Although the city's moderate economic development in the first half of the sixteenth century adds to the value of this case, further comparative research (even beyond the borders of the Low Countries) would be welcome. The evidence presented, however, suffices to forward a new working hypothesis for the sixteenth-century standard of living debate. Indeed, 's-Hertogenbosch fits into the broader picture: the city was marked by very strong wage stickiness and experienced pronounced social inequality. As such, the conflicting views of Scholliers and Soly with those of Van der Wee are less contradictory than they may seem. In the sixteenth-century Low Countries, if the case of 's-Hertogenbosch is to be extrapolated, most urban wage labourers suffered loss of purchasing power and a strong decline in living standards. But studies on living standards offer little value in predicting the incomes and income evolutions of the larger share of town dwellers. Strikingly, despite creeping processes of polarization, strong, often thriving middling groups populated the urban centres. The complex web of shopkeepers, specialized artisans and service providers of different kinds enjoyed much higher incomes and better resisted the fall in purchasing power. Consequently, our data tend to support Herman van der Wee's thesis: before the crisis of the late sixteenth century, the urban centres of the Netherlands were affluent societies.
Some of our observations have methodological consequences for the study of economic growth and standards of living. Clearly, purchasing power simulations should be complemented with data that allow consideration of other income sources, income distributions, and the economic and social complexity of urban societies. Furthermore, as John Munro (Reference Munro and Cavaciocchi2008b) recently emphasized, changing levels of taxation (especially excise duties on beer and other necessities) had an important and socially differentiated impact on living standards. The complex relationships between urban and state fiscal policies, tax burdens, price inflations and living standards are of interest to the issues discussed here, but remain to be investigated in subsequent research. It should be stressed that the case of early sixteenth-century 's-Hertogenbosch already precludes all too straightforward answers: despite a continued decline in real fiscal pressure per capita, the fiscal policies of 's-Hertogenbosch were heavily contested by the middling and lower urban groups in 1525 and the late 1540s (Blondé Reference Blondé1990).
Likewise on the expenditure side, this modest exercise underscores the importance of real inequality calculations. The applicability of actually available consumer baskets and prices to the larger share of urban inhabitants is limited. Especially in the sixteenth century, relative price shifts and economic growth contributed to the social strength of a broad range of urban ‘middling groups’ (Hoffman et al. Reference Hoffman, Jacks, Levin and Lindert2002).
Acknowledgments
We would specifically like to thank Dr Anton Schuttelaars for allowing us access to his highly detailed database of the many taxes levied in sixteenth-century 's-Hertogenbosch. Furthermore, this article benefited from insightful comments formulated by two anonymous referees and various colleagues at the ESSHC 2008 in Lisbon and research seminars in Utrecht and Antwerp. Jeremy Schreiber proofread the final version.