Implications
Performance of breeding sows directly affects overall productivity of pig operation. Increased metabolic burdens on sows during late gestation and lactation cause elevated systemic oxidative stress during these important periods. Increased oxidative stress is related to decreased availability of antioxidants during late gestation and lactation, which begin to normalize towards the end of lactational period. It may be necessary to increase the vitamin E and A contents in the diet during the gestational period in order to compensate for the substantial loss of these nutrients.
Introduction
It has been suggested that pregnancy is a state of oxidative stress, which is characterized by the placental production of reactive oxygen species including superoxide and hydrogen peroxide (Casanueva and Viteri, Reference Casanueva and Viteri2003; Myatt and Cui, Reference Myatt and Cui2004; Chen and Scholl, Reference Chen and Scholl2005). Excessive free radical production may cause both lipid and protein oxidation and impair normal endothelial cell function (Serdar et al., Reference Serdar, Gur, Colakoethullary, Develioethlu and Sarandol2003). The elevated oxidative stress could alter placenta and fetal skeletal formation as well (Prater et al., Reference Prater, Laudermilch, Liang and Holladay2008). In addition, oxidative stress and a disrupted antioxidant system are reported to be involved in a variety of pregnancy complications such as preterm labor, fetal growth restriction, preeclampsia and miscarriage (Gupta et al., Reference Gupta, Agarwal and Sharma2005; Sugino et al., Reference Sugino, Takiguchi, Umekawa, Heazell and Caniggia2007). Numerous studies have also shown that oxidative stress plays a role in the pathophysiology of infertility (Tremellen, Reference Tremellen2008; Ruder et al., Reference Ruder, Hartman and Goldman2009) and assisted fertility (Agarwal et al., Reference Agarwal, Gupta and Sharma2005).
Single-cell microgel electrophoresis (the comet assay) has been developed to detect DNA single- or double-strand breaks. Broken DNA fragments result in an increased migration in electrophoresis to form a diffuse DNA area that resembles a comet tail after staining (Collins et al., Reference Collins, Dusinska, Franklin, Somorovska, Petrovska, Duthie, Fillion, Panayiotidis, Raslova and Vaughan1997). The main cause of DNA damage is attack by endogenous free radicals in particular superoxide radicals released from the respiratory chain in the mitochondria. Considering the steady-state level of damage, a balance between free radical attack and cellular repair is measured in the comet assay (Dusinska and Collins, Reference Dusinska and Collins2010), and the evaluation of the both oxidative DNA damage and antioxidant status would provide the overall antioxidant defense and oxidative stress status.
Highly prolific sows may be under systemic oxidative stress, which can affect not only fertility and well-being of sows, but also the newborns. However, there is no study available to determine the oxidative stress status of sows determined by DNA damage during the gestational and lactational periods. Therefore, an animal model of pregnant sows has been utilized to assess oxidative stress as well as the antioxidant status during various time points of gestation and lactation.
Material and methods
Animals, management and sampling
Procedures used in this study were reviewed and approved by the North Carolina State University Animal Care and Use Committee and by Animal Research Ethics Committee of Jean Mayer USDA Human Nutrition Research Center on Aging at Tufts University.
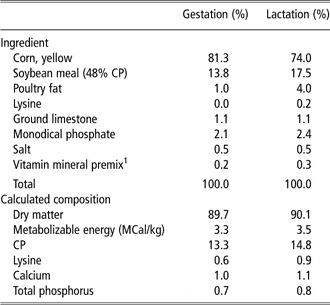
Five pregnant sows with an average parity of 3.6 ± 0.5 and a body weight (BW) of 215.7 ± 24.6 kg at day 30 of gestation (G30) were used in this study. All pregnant sows were housed in gestation stalls (2.0 × 0.6 m) and fed 2.5 kg feed daily. Gestational diet contained 13.3% crude protein (CP), 3.34 MCal metabolizable energy/kg and other essential nutrients (Table 1) meeting suggested nutrient requirements by National Research council (NRC; 1998). Water was supplied ad libitum. BW of the sows was measured on G30 and G110.
Diets fed to sows during gestation and lactation (as-fed basis)

1The vitamin mineral premix provided per kilogram of complete diet: 3.96 mg of Mn as manganous oxide; 16.5 mg of Fe as ferrous sulfate; 16.5 mg of Zn as zinc sulfate; 1.65 mg of Cu as copper sulfate; 0.30 mg of I as ethylenediamine dihydroiodide; 0.30 mg of Se as sodium selenite; 6614 IU of vitamin A as vitamin A acetate; 992 IU of vitamin D3; 19.8 IU of vitamin E; 2.64 mg of vitamin K as menadione sodium bisulfate; 0.03 mg of vitamin B12; 4.63 mg of riboflavin; 18.52 mg of D-pantothenic acid as calcium panthonate; 25.0 mg of niacin; and 0.07 mg of biotin.
On G110, all sows were weighed and moved to farrowing crates (2.1 × 1.5 m). During lactation, sows were fed ad libitum. Lactational diet contained 14.8% CP, 3.5 MCal metabolizable energy/kg and other essential nutrients (Table 1) meeting suggested nutrient requirements by NRC (1998). Average daily feed intake was recorded. BW of the sows was measured on days 1 and 18 of lactation (L1 and L18, respectively). Backfat thickness of sows was measured on L1 and L18 using an ultrasound scanner (Veterinary Sales and Service Inc., Stuart, FL, USA), as described by Mateo et al. (Reference Mateo, Carroll, Hyun, Smith and Kim2009). Litter size and BW of each piglet were measured on L1 (within 12 h after farrowing) and L18. All piglets were weaned on L18. All sows were returned to the gestation stalls after weaning.
Blood samples (20 ml) were collected from all sows on G30, G60, G90 and G110; on L3, L10 and L18; and on, and day 5 of postweaning (W5) for analyses of lymphocyte DNA damage and plasma endogenous antioxidant concentrations.
Lymphocyte DNA damage
Lymphocytes were separated, cryopreserved and recovered for the alkaline single-cell gel electrophoresis as well as H2O2 challenged, as described previously by Zhao et al. (Reference Zhao, Aldini, Johnson, Rasmussen, Kraemer, Woolf, Musaeus, Krinsky, Russell and Yeum2006), with minor modifications.
Lymphocyte separation
Lymphocytes were separated immediately after blood samples were collected. Lymphocytes were isolated by density gradient sedimentation (Histopaque 1077; Sigma diagnostic, St. Louis, MO, USA) and frozen in 50% fetal calf serum, 40% culture medium (RPMI 1640; Sigma diagnostic) and 10% dimethyl sulfoxide to −80°C at −1°C/min freezing rate before being stored in −80°C.
Cryopreserved lymphocyte recovery
Cells were recovered by submersion in a 37°C water bath until the last trace of ice was melted. The cells were transferred to prechilled 50% RPMI 1640 medium and 50% fetal calf serum and then centrifuged at 200 × g for 5 min at 4°C. The cells were resuspended in cold phosphate buffered saline (pH 7.1 to 7.4, Ca++, Mg++ free; Sigma-Aldrich) and checked for viability (typically >95% viability) and cell number (typically 1 × 10⁵ cells/ml) using trypan blue exclusion test.
Alkaline single-cell gel electrophoresis
DNA strand breaks were measured in lymphocytes with the alkaline single-cell gel electrophoresis assay. Hydrogen peroxide-challenged DNA damage was measured by exposing the cells to the hydrogen peroxide (30 μmol/l) for 30 min in ice. All procedures were carried out under yellow light. Samples were coded and analyzed without knowledge of the identity of the sample.
Image analyses
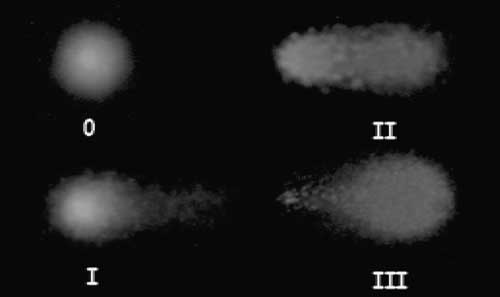
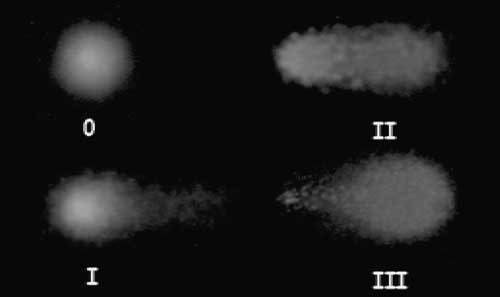
The slides were stained with Syber Green (Trevigen, Gaithersburg, MD, USA) and determined using a fluorescent microscope at ×400 magnification. Images from each of the two replicate slides per sample were analyzed using visual image analyses. The comet-like images were visually classified into four categories (0 to III) by a blinded observer according to appearance, which resulted from the relative proportion of DNA in the tail, as shown in Figure 1. At least a hundred cells were counted and categorized to avoid any selection bias.
Visual classification of DNA damage according to the relative proportion of DNA in the tail (scores 0 to 3) by single-cell gel electrophoresis. Score 0 represents undamaged cells and score 3 represents the most heavily damaged cells (0 = 5%; I = 20%; 2 = 40%; 3 = >60%).
To calculate and express the DNA damage, each slide was visually analyzed and calculated separately. The percentage of DNA damage in the tail was calculated to express the amount of DNA damage {([a × 5] + [b × 20] + [c × 45] + [d × 80])/(a + b + c + d)}; letters a, b, c and d represent the number of cells classified as 0, I, II and III, respectively. All slides were in duplicate for endogenous and H2O2 challenged DNA damage analyses.
Analysis of plasma fat-soluble antioxidants
A 100-μl aliquot of plasma was used for tocopherols and retinol analysis as described previously (Zhao et al., Reference Zhao, Aldini, Johnson, Rasmussen, Kraemer, Woolf, Musaeus, Krinsky, Russell and Yeum2006), with minor modifications. Plasma samples were extracted with 2 ml of chloroform : methanol (2 : 1) followed by 3 ml of hexane. Samples were dried under nitrogen and resuspended in 75 μl ethanol : methyl tert-butyl ether (2 : 1), of which 25 μl was injected into the HPLC. The HPLC system consisted of a Waters 2695 Separation Module, 2996 Photodiode Array Detector, a Waters 2475 Multi-λ Fluorescence Detector, a C30 carotenoid column (3 μm, 150 × 3.0 mm; YMC, Wilmington, NC, USA) and a Waters Millennium 32 software (Milford, MA, USA). The mobile phase was methanol : methyl tert-butyl ether : water (85 : 12 : 3 by volume with 1.5% ammonium acetate in water; solvent A) and methanol : methyl tert-butyl ether : water (8 : 90: 2 by volume with 1% ammonium acetate in water; solvent B). The gradient procedure has been reported earlier (Yeum et al., Reference Yeum, Booth, Sadowski, Liu, Tang, Krinsky and Russell1996). Results were adjusted by an internal standard containing echinenone. The inter- (n = 25) and intra-assay (n = 9) CV was 4%. The recovery of the added internal standard was consistently > 90%. All sample processing was carried out under red light.
Analysis of dietary antioxidant contents
As described previously by Ferreira et al. (Reference Ferreira, Yeum, Liu, Smith, Krinsky, Wang and Russell2000), with minor modifications, carotenoid contents in the diet were determined by HPLC systems. Briefly, 400 mg of diet was incubated with methanol for 2 h at 37°C, followed by four sequential extractions with 10 ml tetrahydrofuran. Two ml of extract was dried under nitrogen gas, dissolved in 0.5 ml ethanol, dried under nitrogen gas and resuspended in 75 ethanol : methyl tert-butyl ether (2 : 1), of which 25 μl was injected into the HPLC. The HPLC system was set as the same as the plasma analysis.
Statistical analyses
Results from each time point were analyzed using repeated measures one-way ANOVA (Student Newman–Keuls) using SigmaStat version 2.0 for Windows 95 (Jandel Scientific Software, San Rafael, CA, USA). Results are expressed as mean ± s.d. Level of significance was set at P < 0.05.
Results
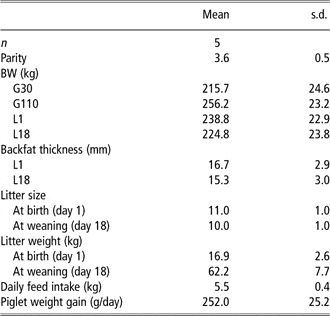
Sows gained 40.5 ± 3.6 kg from G30 to G110, but lost 14.0 ± 5.7 kg from L1 to L18 of lactation. Sows consumed 5.5 ± 0.4 kg feed daily. Piglets gained 252.0 ± 25.2 g daily during lactation (Table 2).
Performance of sows during gestation and lactation

G30 = day 30 of gestation; G110 = day 110 of gestation; L1 = day 1 of lactation; L18 = day 18 of lactation.
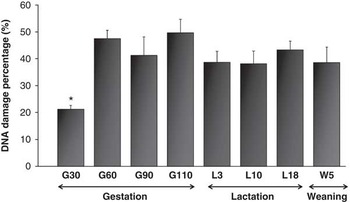
Figure 1 shows the visual classification used to determine DNA damage, as described by Zhao et al. (Reference Zhao, Aldini, Johnson, Rasmussen, Kraemer, Woolf, Musaeus, Krinsky, Russell and Yeum2006). Score 0 is the lowest, representing undamaged cells with 0% to 10% lesion and score 3 represents the most heavily damaged cells with 61% to 100% lesion (score I = 11% to 39%; score 2 = 40% to 60%). As shown in Figure 2, the endogenous comet assay showed significantly lower DNA damage at the early stage of gestation (G30), with 21.3% DNA damage. The oxidative DNA damage significantly increased in the second quarter of gestation and the high DNA damage level continued throughout the gestational and weaning periods. No statistical difference was found in H2O2-induced DNA damage during the gestational and lactational periods (data are not shown).
Lymphocyte DNA damage in multiparous sows during gestational, lactational and weaning periods; with lower (P < 0.05) endogenous DNA damage at day 30 of gestation (G30; 21%) as compared with those of the other time points (38% to 47% lesion) such as G60, G90, G110, L3, L10 and day 5 of postweaning (W5). Data are expressed as mean ± s.d. Value with an asterisk is significantly different at P < 0.05. The assay used was the single-cell gel electrophoresis. One-way ANOVA and Student Newman–Keuls method were used for normal distribution statistical analyses.

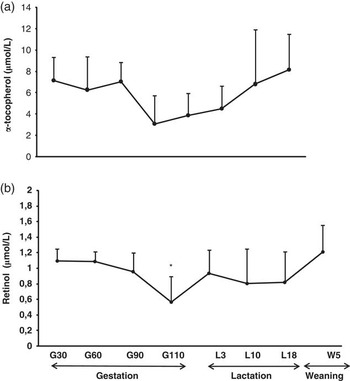
Plasma α-tocopherol concentrations are shown in Figure 3. It started with 7.14 μmol/l at the first quarter of gestational period (G30) and decreased to 3.07 μmol/l at the end of gestation (G110). The α-tocopherol concentration went back up to being close to G30 at L18 and W5 showing 6.8 and 8.13 μmol/l, respectively. As shown in Figure 3, retinol concentration in the plasma was also reduced (P < 0.05) at G110 (0.57 μmol/l), as compared with those of G30, G60 and W5 (1.10, 1.08, 1.21 μmol/l, respectively).
Plasma concentrations of α-tocopherol (a) and retinol (b) in multiparous sows. Data are expressed as mean ± s.d. Value with an asterisk is significantly different from days 30 and 60 of gestation (G30 and G60, respectively) and day 5 postweaning (W5) (P < 0.05). The analyses were performed using HPLC systems. Student's t-test was used for normal distribution statistical analyses.

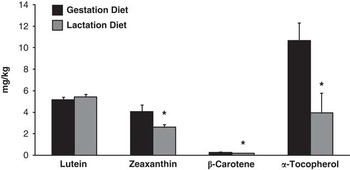
Fat-soluble antioxidant contents (carotenoids and tochopherols) in the sow diet were higher (P < 0.05), except for lutein, in the gestational diet than the lactational diet, as shown in Figure 4. Diets used in gestation and lactation contained 5.14 and 5.44 mg/kg of lutein; 4.06 and 2.61 mg/kg of zeaxantine; 0.28 and 0.19 mg/kg of β-carotene; and 10.65 and 3.95 mg/kg of α-tocopherol, respectively.
Fat-soluble antioxidant content in gestational and lactation diet. Data are expressed as mean ± s.d. Values with an asterisk or different letters are significantly different at P < 0.05. The analyses were performed using HPLC system. Student's t-test was used for normal distribution statistical analyses.

Discussion
During gestation, there is a high energy demand and an increased oxygen requirement, which favors a state of oxidative stress due to the overproduction of reactive oxygen species (Agarwal et al., Reference Agarwal, Saleh and Bedaiwy2003; Reyes et al., Reference Reyes, Sifuentes-Alvarez and Lazalde2006). In this regard, there are clinical and experimental evidences that oxidative stress and/or low intake of antioxidant (Klemmensen et al., Reference Klemmensen, Tabor, Osterdal, Knudsen, Halldorsson, Mikkelsen and Olsen2009) is involved in the etiopathogenesis of the most frequent disorders in the gestational period (Hubel, Reference Hubel1999; Myatt and Cui, Reference Myatt and Cui2004; Jauniaux et al., Reference Jauniaux, Poston and Burton2006).
This study utilized multiparous sow to better comprehend the status of oxidative stress during different stages of reproduction. The performance of all sows in this study was normal, which is similar to our previous publications, with regard to BW gain during gestation, BW changes during lactation, feed intake during gestation and lactation, litter size, litter birth weight and litter weight gain (Mateo et al., Reference Mateo, Wu, Bazer, Park, Shinzato and Kim2007, Reference Mateo, Wu, Moon, Carroll and Kim2008 and Reference Mateo, Carroll, Hyun, Smith and Kim2009; Kim et al., Reference Kim, Hurley, Wu and Ji2009). In this study, there was no truly non-pregnant sow to compare the oxidative damage with pregnant sow because of practical difficulty in obtaining non-pregnant sows with similar age, parity and BW to those used in this study. But instead, G30 was served as a time point to compare the changes with those in mid-to late-gestation and lactation. Previously, it was shown that there is no significant changes occurring to sows in terms of maternal changes (Ji et al., Reference Ji, Wu, Blanton and Kim2005), fetal growth (McPherson et al., Reference McPherson, Ji, Wu and Kim2004) and mammary gland growth (Ji et al., Reference Ji, Hurley and Kim2006). It has also shown that sows are not undergoing a catabolic status during G30 (Kim et al., Reference Kim, Hurley, Wu and Ji2009).
There was an elevated oxidative DNA damage throughout the gestational, lactational and weaning periods. It is possible that the high metabolic demand during gestation may induce the production of reactive oxygen species by the placenta, although the placenta is a source of antioxidative enzymes and hormone systems to control placental lipid peroxidation in healthy pregnancy (Mueller et al., Reference Mueller, Koebnick, Binder, Hoffmann, Schild, Beckmann and Dittrich2005). However, no significant difference was found in H2O2-induced DNA damage during the gestational, lactational and weaning periods, probably because of the high rate of basal DNA damage and the large variation of the DNA resistance among sows against oxidative stress.
This utilized cryopreserved lymphocytes for DNA damage determination. It has been reported that freezing of lymphocytes does not increase DNA strand breaks as compared to those of freshly isolated lymphocytes, and that fresh and frozen lymphocytes responded almost identically to hydrogen peroxide (Duthie et al., Reference Duthie, Pirie, Jenkinson and Narayanan2002). Visual scoring system used in this study reported to be accurately corresponding to the data that are measured by computer image analysis in human lymphocytes (Collins, Reference Collins2004), in equine lymphocyte (Marlin et al., Reference Marlin, Johnson, Kingston, Smith, Deaton, Mann, Heaton, van Vugt, Saunders, Kydd and Harris2004) and in canine and feline leukocytes (Heaton et al., Reference Heaton, Ransley, Charlton, Mann, Stevenson, Smith, Rawlings and Harper2002). The method used for visual scoring involves classifying comets into four categories on the basis of the perceived length of migration and relative proportion of DNA in the tail.
In pigs, the concentrations of vitamin E in plasma, tissues, colostrums and milk are reported to be highly responsive and directly correlated with changes in the dietary vitamin E intake (Pinelli-Saavedra, Reference Pinelli-Saavedra2003). The sows in this study received different diets during gestational and lactational periods according to the nutrient requirements (NRC, 1998). Although the diet during the gestational period contained higher amount of α-tocopherol, plasma α-tocopherol concentrations were significantly lower at G110 as compared to those of the lactational period. It is plausible that there was a rapid transport of α-tocopherol from the mother to the piglets. Although the efficiency of placental transfer of vitamin E was reported to be limited when the maternal serum vitamin concentrations increased (Pinelli-Saavedra and Scaife, Reference Pinelli-Saavedra and Scaife2005), it is interesting to note that the plasma concentrations of vitamin E in the piglet is shown to be significantly influenced by the vitamin E concentrations of the sow's colostrum and milk (Pinelli-Saavedra et al., Reference Pinelli-Saavedra, Calderon De La Barca, Hernandez, Valenzuela and Scaife2008). In addition, the combination of antioxidant nutrients, such as vitamins E and C (Pinelli-Saavedra et al., Reference Pinelli-Saavedra, Calderon De La Barca, Hernandez, Valenzuela and Scaife2008), and selenium (Wuryastuti et al., Reference Wuryastuti, Stowe, Bull and Miller1993) was reported to be beneficial for the sow's immune response.
Conclusions
This study showed that DNA damage is significantly augmented in the second quarter of gestational period (G60), maintaining elevated damage throughout the lactational period, and that it is still not completely recovered during the weaning period. The antioxidant nutrients that declined during the gestational period resulted in a significant drop at G110 and began to normalize towards the end of the lactational period. This study clearly indicates that sows are under increased systemic oxidative stress throughout the late gestational and lactational periods compared with G30 and not fully recovered until the weaning period. In addition, it may be necessary to increase the vitamin E and A contents in the diet during the gestational period in order to compensate for the substantial loss of these nutrients. Further research studies warrant providing new approaches on oxidative stress attenuation and sufficient nutrient supply during reproduction.
Acknowledgement
The authors are grateful for the financial supports from North Carolina Pork Council, North Carolina Agricultural Foundation, US Department of Agriculture (USDA), Agricultural Research Service (Cooperative Agreement number 1950-51000-065-08S), Coordenação de Aperfeiçoamento de Pessoal de Nível Superior (CAPES), Brasília, DF, Brazil (contract number 0635/09-0). Any opinions, findings, conclusion or recommendations expressed in this publication are those of the author(s) and do not necessarily reflect the view of the CAPES or USDA.