The so-called Takotsubo cardiomyopathy was first described in Japan in 1990.Reference Sato, Tateishi and Uchida 1 The name of the disorder is taken from the Japanese name for the octopus trap, “tako-tsubo”, which has a shape that is similar to the apical ballooning configuration of the left ventricle as seen in systole in patients with this is a type of cardiomyopathy, which is believed to reflect a sudden temporary weakening of the myocardium. The typical presentation is a sudden onset of congestive heart failure or chest pain associated with electrocardiographic changes suggestive of an anterior myocardial infarction.Reference Bielecka-Dabrowa, Mikhailidis and Hannam 2
The majority of cases have been reported in adults, usually preceded by emotional or physical stress. Owing to its clinical course, with full recovery of left ventricular function in few days or weeks, the cardiomyopathy is often underestimated or misdiagnosed in children and young adults. The purpose of this review therefore is to present some personal experience in children with this syndrome, drawing comparison with the published experience of others, in this way compiling information about its diagnosis, common presentations, clinical course, and management.
Materials and methods
Institutional review board approval was obtained. Information on those patients seen personally, including clinical course, images, and treatment, was obtained from their charts, with previous authorisation. Ovid, PubMed, and Cochrane database were accessed to obtain information on previous cases published in children and young adults, as well as to review the current concepts relating to this type of cardiomyopathy.
Results and discussion
Is the paediatric cardiologist aware of this condition?
To date, many cases have been described worldwide, indicating that the cardiomyopathy is extremely unlikely to be geographically isolated.Reference Bounhoure 3 As awareness of the syndrome has increased, more case reports have been published, the majority in adults, leading to its incorporation into the classification endorsed by the American Heart Association for reversible cardiomyopathies.Reference Maron, Towbin and Thiene 4
The prevalence of the syndrome is unknown, especially in children, but based on experience in adults it accounts for around 2% of patients with suspected acute coronary syndromes.Reference Merchant, Johnson and Nguyen 5 In adults, as the clinical and imaging characteristics mimic an acute coronary syndrome, the cardiomyopathy is often misdiagnosed. In children and young adults, the syndrome is frequently interpreted as myocarditis or dilated cardiomyopathy, or occasionally labelled as “acute ventricular dysfunction of unknown etiology”. The lack of recognition of the syndrome has had no significant impact on outcomes, as full spontaneous recovery of cardiac function is the final pathway in the majority of cases. Unnecessary work-up, nonetheless, can be avoided if the correct diagnosis is made.
A recent reviewReference Lee, Lee and Choi 6 gathered information from a total of 12 published cases under the age of 35 years, four of them younger than 25 years, and only two under the age of 10. All showed a similar course.
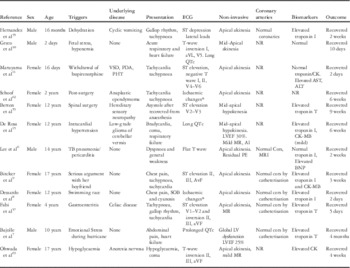
To the best of our knowledge, only 12 cases have currently been published worldwide in children and young adults with this acute and self-resolving syndrome (Table 1). The number of cases occurring in children, nonetheless, could increase significantly as paediatric cardiologists become more familiar with the entity.
Reported cases of takotsubo cardiomyopathy in patients under the age of 20.

AI=aortic insufficiency; ALT=alanine transaminase; AST=aspartate transaminase; BNP=brain natriuretic peptide; CK=creatinine kinase; Cors=coronary arteries; LV=left ventricular; LVEF=left ventricular ejection fraction; MR=mitral regurgitation; NR=no reported; PDA=patent ductus arteriosus; PE=pericardial effusion; PHT=pulmonary hypertension; SOB=shortness of breath; TB=tuberculosis; VSD=ventricular septal defect
* T-wave inversion and ST elevation on surface electrocardiogram
Clinical features and common triggers in children
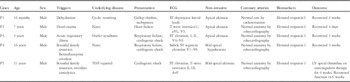
The onset of the syndrome is typically triggered by an acute emotional or physical stress, or by an accumulation of trivial and repetitive stress.Reference Bielecka-Dabrowa, Mikhailidis and Hannam 2 The most common stressors in adults are death of a loved one, legal problems, bad financial news, car accidents, natural disasters, exacerbation of chronic medical illness, significant arguments, surgical procedures, and use of or withdrawal from illicit or narcotic drugs.Reference Merchant, Johnson and Nguyen 5 Although exposure to stress in less remarkable in children, than in adults, there are some stressors than can be quite significant during childhood. Emotional stress during a hurricane triggered the cardiomyopathy in a 10-year-old boy,Reference Bajolle, Basquin and Lucron 7 and stress produced by a swimming race was the trigger in a 12-year-old girl.Reference Dessardo, Tomulie and Dessardo 8 A teenager presented with chest pain and tachycardia after a serious argument with her boyfriend.Reference Biteker, Duran and Civan 9 In another two patients, the syndrome was precipitated by consumption and withdrawal of illicit drugs associated with adverse family situation (Table 2).
Series of patients with takotsubo cardiomyopathy.

LV=left ventricular; Cors=coronary arteries; TOF=tetralogy of Fallot
Demographic Characteristics and clinical course
In younger patients, the syndrome was triggered by respiratory or gastrointestinal infections, during post-surgical recovery, or secondary to a neurologic insult (Tables 1 and 2). Perhaps surprisingly, two cases have been reported in newborns, one at 2 days of life triggered by foetal stress,Reference Greco, De Rito and Petracca 10 and a second case after withdrawal of Bupirenorphine.Reference Maruyama, Nomura and Fukushige 11 Despite the fact that, in the majority of cases, a stressful event is usually identified, the lack of a preceding trigger does not exclude the diagnosis of takotsubo cardiomyopathy.Reference Maron, Towbin and Thiene 4
Adults or young adult patients frequently present with symptoms consistent with ischaemic chest pain, or dyspnoea mimicking an acute myocardial infarction.Reference Kapoor and Bybee 12 Cardiogenic shock, although rare, may occur.Reference Serra Carvalho, Lima and Cunha 13 On the basis of the cases previously reported in children, the majority of them had revealed signs and symptoms of heart failure at presentation, along with abnormal electrocardiographic changes, left ventricular dysfunction on their echocardiograms, and elevated cardiac enzymes.
Electrocardiographic findings
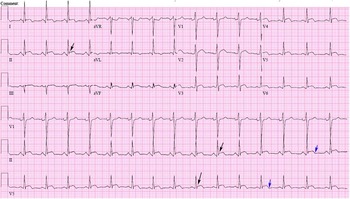
Owing to the fact that the syndrome mimics acute myocardial infarction, the most common electrocardiographic findings are related to the ST segments and the T waves, with abnormalities extending beyond the distribution of a single coronary artery (Fig 1). In one study,Reference Sharkey, Lesser and Zenovich 14 ST elevation was found in just over half the patients, T-wave inversion in one-quarter, and R-wave progression with new Q-waves in one-tenth.
Twelve-lead electrocardiogram with typical findings in takotsubo cardiomyopathy. ST-segment elevation (black arrows) with T-wave inversion (blue arrows). These findings do not follow a single coronary territory as seen in this ECG, where they are mainly diffused. ST-segment depression and long QTc can be also found in this type of cardiomyopathy.

The electrocardiographic abnormalities at presentation in children are comparable to those seen in adults. In three children reported with the syndrome, nonetheless, the QTc was found to be prolonged during the acute phase of the disease, with subsequent normalisation.Reference Greco, De Rito and Petracca 10 , Reference De Rosa, Pardeo and Di Rocco 15 , Reference Bajolle, Basquin and Lucron 7 No QTc prolongation was observed in our own series of patients.
Owing to the fact that the incidence of coronary arterial disease in children is very low, the differential diagnosis is much narrower than in adults when these electrocardiographic findings are present. It is, of course, necessary to exclude congenital or acquired anomalies of the coronary arteries. In one adult with takotsubo cardiomyopathy, the presence of a J wave was emphasised as a hyperacute sign of the syndrome.Reference Zorzi, Migliori and Perazzolo Marra 16 The authors suggested transmural differences in myocyte action potentials as causal, with a resultant voltage gradient, and thus production of the notch in the descending slope of the QRS complex.
Biomarkers
In the acute phase, takotsubo cardiomyopathy mimics an acute myocardial infarction in regard to the clinical symptoms, electrical changes, and cardiac biomarkers such as troponin and creatinine kinase.Reference Thygesen, Alpert and White 17 Although troponin is typically released in the setting of myocytic necrosis, it can also be elevated in certain conditions with increased membrane permeability as seen in takotsubo cardiomyopathy.Reference Lim, Qushmaq and Devereaux 18 Typically, cardiac troponins in this syndrome are mildly elevated, which contrasts with the often severe haemodynamic compromise. In two systematic reviews in adults,Reference Gianni, Dentali and Grandi 19 , Reference Sharkey, Windenburg and Lesser 20 cardiac troponins and creatinine kinase were elevated in over three-quarters of patients, with levels of troponin T ranging from 0.01 to 5.2 ng/ml.
In children with takotsubo cardiomyopathy cardiac enzymes have been found to be slightly elevated during the acute phase, with slow normalisation as the function is recovered. In the reported cases (Table 1), apart from three patients, cardiac troponin I or T was elevated at presentation. Creatinine kinase was increased in three patients and pro-brain natriuretic peptide in one. Troponin I was elevated at diagnosis in all our patients, with levels of troponin I reaching 8.5 ng/ml in one (Table 2).
Of note, among the causes of elevated cardiac troponins in children and young adults, myocarditis is characterised as causing the highest level of this biomarker.Reference Soongswang, Durongpisitkul and Ratanarapee 21 Infection, therefore, is usually suspected in a patient with no cardiac history presenting with acute onset of chest pain with or without decreased left ventricular systolic function and significantly elevated cardiac troponin. Indeed, in one study of children with acute heart failure and myocardial dysfunction, levels of troponin T and creatinine kinase were higher in those with myocarditis compared with dilated cardiomyopathy, reflecting ongoing myocytic damage in the former.Reference Soongswang, Durongpisitkul and Ratanarapee 21 A new biomarker has now been suggested to differentiate takotsubo cardiomyopathy from myocardial infarction in the acute phase.Reference Jaguszewski, Osipova and Ghadri 22 The test depends on using polymerase chain reaction to identify circulating miRNAs in the plasma. The most common reported miRNAs in the setting of infarction are miR-1 and miR-133a. These two markers are strongly upregulated in ST elevation myocardial infarction, but only weakly increased in patients with takotsubo cardiomyopathy. The test, nonetheless, has yet to be validated.
Echocardiography and other imaging modalities
Echocardiography
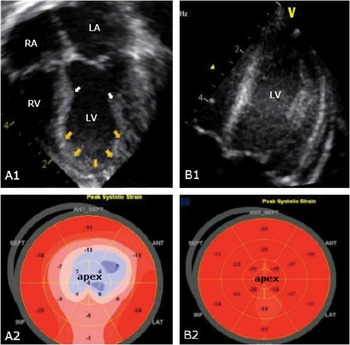
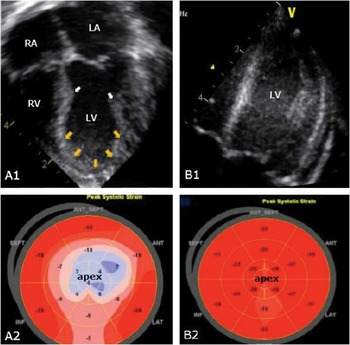
Within the first 72 hours of the initiation of the syndrome, echocardiography is usually consistent with dyskinesia or akinesia of the apex and/or mid-wall of the left ventricle, with preserved or hyperkinetic contractile function of the basal segments (Fig 2a1).Reference Ako, Takenaka and Uno 23 Comparison of echocardiographic features in patients with takotsubo cardiomyopathy and acute coronary syndrome revealed better diastolic function, but worse systolic function, in the patients with the stress-induced cardiomyopathy.Reference Park, Prasad and Rihal 24 When assessing abnormalities of wall motion in patients with this cardiomyopathy, a large spectrum of morphologic variants has been identified, going from the classic apical ballooning appearance to global hypokinesis of the left ventricle.Reference Kapoor and Bybee 12 In cases where the severe hypokinesis is limited to the left ventricular apex, with classical apical ballooning, the basal segments usually exhibit a compensatory hyperkinesia as appreciated when addressed with the cross-sectional strain modality (Fig 2a2). In a minority of cases, the transient left ventricular hypokinesis is restricted to the mid-ventricular segment, which is also recognised as the apical sparing variant, or simply described as the atypical form.Reference Park, Prasad and Rihal 24 In a reasonably large series of adult patients, the typical apical form was found in three-fifths.Reference Kurowski, Kaiser and Von Hof 25 The echocardiographic findings in children are comparable with those observed in adults. In up to four-fifths of the cases reported in children and young adults (Table 1), the predominant pattern was the typical hypokinesis or akinesia of the left ventricular apex, with hypercontractility of the base. In two cases, mid-ventricular hypokinesis was also noticed. In only one case was transient global left ventricular dysfunction reported, with an ejection fraction of no more than 25%.Reference Bajolle, Basquin and Lucron 7
Two-dimensional echocardiogram with strain analysis of a patient (P1) with takotsubo cardiomyopathy. At presentation (A1, A2), echocardiogram shows a constriction point (white arrows) at the mid-septum and mid-lateral wall of the left ventricle reflecting hyperkinesia of the left ventricular base and hypokinesia of the left ventricular apex adopting a balloon shape (yellow arrows). The 2D strain analysis (A2) reveals a blue area at the left ventricular apex consistent with apical hypokenesia. After 4 weeks, left ventricular function normalised (B1, B2). LA=left atrium; LV=left ventricle; RA=right atrium; RV=right ventricle.
Right ventricular involvement
Most reports of takotsubo cardiomyopathy have focused on left ventricular dysfunction. There are some cases, nonetheless, where the right ventricle has been predominantly involved. In one series, one-quarter of patients had abnormalities of right ventricular wall motion.Reference Haghi, Athanasiadis and Papavassiliu 26 These authors also noted that pleural effusion was more common when the right ventricle was affected. Taking note of these variants, it was suggested that takotsubo cardiomyopathy should no longer be defined as a left apical ballooning syndrome, but rather a “sudden and transient left or right ventricular dysfunction syndrome”.Reference Haghi, Athanasiadis and Papavassiliu 26
Cardiac magnetic resonance imaging
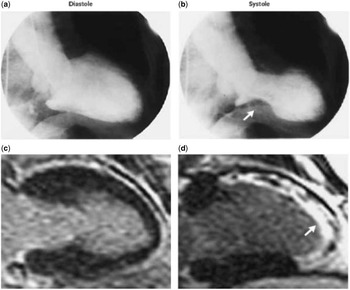
At least in adults, cardiac magnetic resonance imaging is emerging as an important tool with which to stratify patients with abnormalities of wall motion.Reference Rolf, Nef and Mollmann 27 The presence or absence of late gadolinium enhancement, however, is crucial in most instances for differentiating takotsubo cardiomyopathy from myocarditis or ischaemic heart disease. This is because, in the majority of cases, late gadolinium enhancement is absent in those with stress cardiomyopathy (Fig 3c–d).Reference Eitel, Behrendt and Schindler 28 , Reference Richard 29 Cardiac magnetic resonance imaging was used in only one of the published examples of children with the cardiomyopathy.Reference Merchant, Johnson and Nguyen 5 It was used to assess the coronary arterial anatomy, but no late gadolinium enhancement was reported. In one patient from our series (P5, Table 2), we used cardiac resonance imaging for characterisation of a left ventricular thrombus that developed during the acute period of severe apical akinesia. In accordance with the low incidence of acute coronary syndromes in childhood, and the need for sedation at this age, this imaging modality should be reserved for those who can either easily cooperate, or if the clinical picture is suggestive of an ischaemic injury or myocarditis. In most cases reported in children, the diagnosis has been suspected at the nadir of the disease, with slow but progressive improvement within the following days or weeks. This could be another reason why advanced imaging modalities were not further pursued in these patients.
Left ventricle angiography during diastole ( a ) and systole ( b ) showing apical and mid-ventricular wall motion abnormalities and hyperkinesia of the basal segment (arrow). Magnetic resonance imaging showing that the akinetic regions are hypoenhanced and dark, suggesting the presence of viable myocardium ( c ) in contrast with myocardial infarction showing hyperenhancement indicative of necrosis ( d ).Reference Richard 29

Coronary angiography
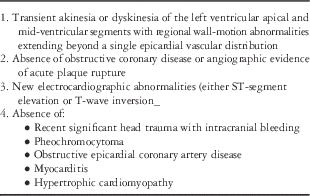
According to the “Mayo Clinic Criteria” (Table 3),Reference Bybee, Kara and Prasad 30 one of the hallmarks for the diagnosis of takotsubo cardiomyopathy is the absence of obstructive coronary arterial disease, or angiographic evidence of acute plaque rupture. Some authors, nonetheless, have stated that underlying occult coronary artery disease may be present in some adults with this syndrome.Reference Caussin, Ohanessian and Lancelin 31 , Reference Ibanez, Navarro and Cordoba 32 In a recent Japanese study, incidental coronary arterial disease was found in one-tenth of patients.Reference Kurisu, Inoue and Kawagoe 33 Despite this finding, there is no strong evidence to support an ischaemic insult as the solitary phenomenon in the pathogenesis of this cardiac syndrome. The peculiar distribution of the abnormalities of mural motion in this population implicates involvement of all three coronary arterial territories.Reference Bielecka-Dabrowa, Mikhailidis and Hannam 2
Proposed Mayo criteria for the clinical diagnosis of takotsubo cardiomyopathyFootnote *.

* Bybee et alReference Bybee, Kara and Prasad 30
In adults presenting with features resembling those of acute coronary syndromes, the diagnosis of takotsubo cardiomyopathy is mainly a diagnosis of exclusion, and therefore coronary angiography is warranted in most cases.Reference Kono and Sabbah 34 Left ventriculography is also characteristic, revealing the classic constriction at the lateral wall of the left ventricle and the ventricular septum (Fig 3a–b) during ventricular systole, thus producing the so-called octopus trap shape. Of note, despite the rareness of acute coronary syndrome in children, almost half of the reported cases (Table 1) underwent cardiac catheterisation to address the coronary arteries during the acute phase of the disease, revealing normal results. This mainly reflects the fact that this syndrome is not very well recognised in children. Although rare in children and young adults, ischaemic heart disease is always among the first suspected diagnosis. Only one of the five patients from our own seriesReference Hernandez, Martinez and Chan 35 underwent cardiac catheterisation (P1, Table 2). In a previously healthy child with a sudden left ventricular systolic dysfunction, with or without an identifiable stressful event, and global or focal abnormalities of mural motion found at echocardiography, associated with an ischaemic type pattern in the electrocardiogram and mildly elevated cardiac enzymes, takotsubo cardiomyopathy should now be highly suspected, thus precluding the need for coronary angiography.
Other imaging modalities
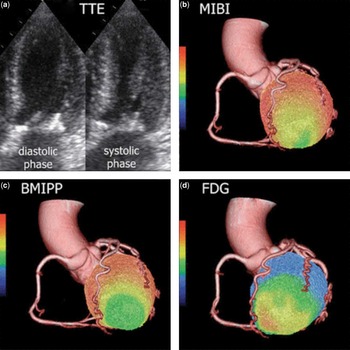
Myocardial perfusion scintigraphy and flurodeoxyglucose-positron emission tomography have been performed in adults,Reference Park, Prasad and Rihal 24 but as yet we are unaware of any reported experience in children and young adults. Positron emission tomography, showing severely impaired fatty acid metabolism, and apical accumulation of flurodeoxyglucose, has been reported in one patient with takotsubo cardiomyopathy (Fig 4).Reference Miyachi, Kumita and Tanaka 36
PET/CT and SPECT/CT cardiac fusion imaging in a patient with takotsubo cardiomyopathy. Echocardiography showing remarkable apical ballooning ( a ). I-beta-methyl iodophenyl pentadecanoic acid images revealed a severely reduced uptake in the apex and a slightly reduce uptake of MIBI in the same region ( b )( c ). These exams revealed severely impaired fatty acid metabolism rather than myocardial perfusion during the acute phase. The F-fluorodeoxyglucose (FDG) PET image ( d ) showed an obvious focal FDG accumulation in the apex. F-FDG in the normal myocardium was inhibited. Miyachi H, Kumita SI, Tanaka K. PET/CT and SPECT/CT cardiac fusion imaging in a patient with takotsubo cardiomyopathy. Eur Heart J 2013;34:397. By permission of Oxford University Press. BMIPP=123I-β-methyliodophenyl pentadecanoic acid; MIBI=99mTc-sestamibi.

Pathogenesis
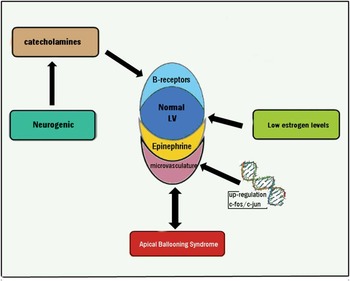
The precise aetiology and pathophysiology of the syndrome remain unknown, although multiple theories have been proposed (Fig 5), variously involving the vascular, endocrine, and central nervous systems.Reference Akashi, Goldstein and Barbaro 37
Proposed mechanisms in the pathogenesis of takotsubo cardiomyopathy. Excess of catecholamines after a stressful event and subsequent effect over the β-receptors is one of the most accepted mechanism. Epinephrine has been implied with the abnormal microvasculature and thus explains the classic electrocardiographic changes. Upregulation of C-fos/C-jun is also involved with abnormalities of the vasculature, especially in post-menopausal women with low estrogen levels. LV=left ventricle.

Catecholamines
Most evidence suggest a major contribution made by an excess of catecholamines, with an exaggerated response of the sympathetic nervous system.Reference Abraham, Mudd and Kapur 38 A two- to threefold increase in catecholamine levels was observed in a large series of patients with takotsubo cardiomyopathy compared with patients with acute myocardial infarction.Reference Wittstein, Thiemann and Lima 39 The histological findings of the myocardium resemble those seen in catecholamine heart toxicity in both animalsReference Mohaveh, Reeves and Metha 40 and humans.Reference Frustaci, Loperfido and Gebtiloni 41
Similar cardiac impairment is seen in other entities with high sympathetic tone and notable release of catecholamines, like pheochromocytomaReference Shaw, Rafferty and Tait 42 and subarachnoid haemorrhage.Reference Mayer, Lin and Homma 43 Animal models of subarachnoid haemorrhage have shown a correlation between catecholamine levels and myocardial damage.Reference Masuda, Sato and Yamamoto 44
Glucose uptake
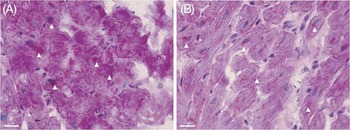
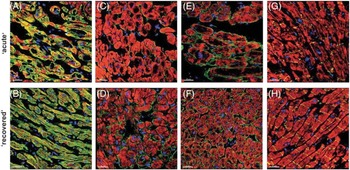
Normal myocardium obtains approximately nine-tenths of its energy from fatty acid metabolism at rest and with aerobic activity. Previous studies have demonstrated that myocardial glucose metabolism is significantly affected in patients with takotsubo cardiomyopathy (Fig 4).Reference Kurowski, Kaiser and Von Hof 25 , Reference Miyachi, Kumita and Tanaka 36 Although the precise mechanism for this reduce uptake of glucose remains unclear, it was significantly decreased in rats exposed to high levels of catecholamines.Reference Huang, Lee and Dobson 45 Light microscopy of biopsies performed in patients during the acute phase of the disorder has demonstrated structural alterations, such as hypertrophy of the myocytes, as well as large intracytoplasmatic areas filled with glycogen (Fig 6).Reference Nef, Mollmann and Kostin 46 On electron microscopy during the acute phase (Fig 7, upper panel), the content of contractile material was reduced, and mainly detected in the border of the myocytes. In addition, the interstitial space was widened and filled with fibrotic material, including cell debris, macrophages, collagen, and fibroblast. During the phase of recovery, biopsy showed vacuoles of normal size, and nearly normal arrangement of the intracellular structures (Fig 7, lower panel).Reference Nef, Mollmann and Kostin 46
Periodic acid–Schiff staining (arrows) shows remarkable intracellular accumulation of glycogen in takotsubo cardiomyopathy ( a ). After functional recovery, only small amounts of glycogen, particularly around the nuclei of the myocites (arrows), were documented. Nef HM, Mollmann H, Kostin S, et al. Tako-tsubo cardiomyopathy: intraindividual structural analysis in the acute phase and after functional recovery. Eur Heart J 2007;28:2456–2464, by permission of Oxford University Press.

Immunohistochemistry of intracellular proteins (specific labelling green, phalloidin red, nuclei blue). α-actin was detected only in the border zone during takotsubo cardiomyopathy ( a ). After functional recovery, a regular distribution was found ( b ). N-terminal dystrophin showed a decrease in takotsubo cardiomyopathy, verifying a loss of protein-to-protein interaction ( c ) in comparison with biopsies after functional recovery ( d ). C-terminal dystrophin was unaltered in takotsubo cardiomyopathy, suggesting that integrity of the sarcolemma is maintained ( e , f ). Connexin-43-showed a reduced cell–cell connection in takotsubo cardiomyopathy ( g ), whereas a myocardial integrity was documented after functional recovery ( h ). Nef HM, Mollmann H, Kostin S, et al. Tako-tsubo cardiomyopathy: intraindividual structural analysis in the acute phase and after functional recovery. Eur Heart J 2007;28:2456-2464, by permission of Oxford University Press.

Microvascular impairment
Microvascular dysfunction has been suggested as a potential pathophysiologic mechanism in transient cardiomyopathy. The causes of microvascular impairment may be multiple. Mental stress can potentially increase the sympathetic tone, and cause vasoconstriction in patients without coronary arterial disease.Reference Lacy, Contracta and Robbins 47 This vasoconstriction is induced via an ultimate acceleration of calcium influx through voltage-dependent calcium channels.Reference Jaguszewski, Osipova and Ghadri 22 Several techniques have been used to assess this mechanism, including angiographic index of myocardial perfusion,Reference Elesber, Lerman and Bybee 48 contrast echocardiography,Reference Galiuto, De Caterina and Porfidia 49 nuclear imaging,Reference Kurisu, Inoue and Kawagoe 50 and transthoracic and intracoronary Doppler evaluation.Reference Galiuto, De Caterina and Porfidia 49 Other studies have shown no evidence of focal perfusion abnormalities after first-pass perfusion on cardiac magnetic resonance imaging.Reference Gerbaud, Montaudon and Leroux 51 , Reference Nef, Mollmann and Elsasser 52 Evidence against the microvascular theory, nonetheless, is the induction of takotsubo cardiomyopathy after administration of dobutamine, which is a vasodilator.Reference Brewington, Abbas and Dixon 53
Low estrogen levels
The reason why this cardiomyopathy predominantly occurs in post-menopausal women is also unexplained. A deficiency in oestrogen activity may play a role, as demonstrated in animal models where this syndrome has been attenuated with oestrogen supplementation.Reference Ueyama, Hano and Kasamatsu 54 Regardless, post-menopausal women predisposed to develop takotsubo cardiomyopathy are required to have a heightened sympathetic discharge. Endothelial dysfunction has also been implied in its pathogenesis in women, along with upregulation of C-fos/C-jun and downregulation of cardioprotective substance as atrial natriuretic peptide and heat shock protein-70.Reference Sader and Celermajer 55 , Reference Ueyama, Kasamatsu and Hano 56
Why in children?
As this syndrome is becoming better recognised by adult cardiologists, with the emergence of established diagnostic criteria, paediatric cardiologists are now facing the childhood version of the syndrome, but in the absence of any good understanding of the link between this entity and coronary arterial disease. Triggers, presentations, clinical course, electrocardiographic and imaging findings are remarkably similar in children and adults, and thus a common pathogenic mechanism should be inferred. If this is the case, this unique cardiomyopathy is unlikely to be secondary to coronary arterial disease. Excess in catecholamines, with local cardiac sympathetic disruption after a stressful event causing myocardial stunning, thus leading to the constellation of findings and clinical course recognised in takotsubo cardiomyopathy, seems to be the most reasonable pathway to explain the appearance of this syndrome from the newborn period through to adulthood.
Diagnostic criteria
Universally accepted criteria for the diagnosis of takotsubo cardiomyopathy are not yet available. In 2004, a group from Mayo ClinicReference Bybee, Kara and Prasad 30 proposed a clinical algorithm that it is being widely used, especially in adults (Table 3). Despite the echocardiographic findings, and evidence of normal coronary arteries by angiography, the diagnosis should be highly suspected when it occurs in the absence of significant head trauma with intracranial bleeding, pheochromocytoma, myocarditis, or hypertrophic cardiomyopathy.Reference Bybee, Kara and Prasad 30 Although no criteria have yet been established for children and young adults, the algorithm provided from the Mayo Clinic does still apply to these groups of patients. In children, myocarditis is the most common aetiology of acute chest pain with elevated cardiac enzymes and ventricular dysfunction with or without evidence of heart failure in an otherwise healthy individual. It is therefore the biggest confounder for the diagnosis of takotsubo cardiomyopathy.
Despite the fact the abnormalities of regional wall motion extending beyond a single coronary arterial territory is nowadays a remarkable diagnostic criterion (Table 3), global left ventricular dysfunction has been reported in some cases.Reference Bajolle, Basquin and Lucron 7 Invasive coronary angiography in children and young adults is supported if the diagnostic criteria for takotsubo cardiomyopathy or myocarditis are not completely met, or if coronary arterial disease is otherwise highly suspected, especially in those with risk factors, or if the coronary arteries were not accurately delineated with other imaging modalities.
Management and clinical course
Management
The treatment for this syndrome remains entirely empirical, and should be individualised according to the characteristics observed at presentation. Standard supportive treatment for congestive heart failure seems to be reasonable until the left ventricular function normalises.Reference Kono and Sabbah 34
Recommendations made for adults, in the emergency setting before coronary angiography, are basically focused on the management of myocardial ischaemia as the first line of treatment, with continuous electrocardiographic monitoring, along with administration of heparin, oral and intravenous nitrates, and β-blockers.Reference Bounhoure 3 In adults with low cardiac output syndrome and cardiogenic shock, mechanical support with intra-aortic balloon pump has been preferred to intravenous inotropic agents, the latter having deleterious effects in the setting of catecholamines excess.Reference Gianni, Dentali and Grandi 19
Takotsubo cardiomyopathy, nonetheless, is a diagnosis of exclusion in adults, as it is difficult to ignore myocardial ischaemia as responsible for the constellation of symptoms. In children and young adults, in contrast, based on the extremely low frequency of coronary arterial disease, management should not initially be focused on improving coronary perfusion. As evidenced in cases in children, (Tables 1 and 2), congestive heart failure due to low cardiac output was the most common presentation in those requiring immediately inotropic support in the setting of the intensive care unit. Despite the fact that it is preferable not to use inotropes in adults, they were safely used in our patients, with no side effects or worsening of the ventricular function. Milrinone was the inotrope of choice. Lasix was also part of the treatment arsenal, being used to improve symptoms of pulmonary oedema. In one case, lidocaine was used to treat ventricular tachycardia during the acute phase.Reference Maruyama, Nomura and Fukushige 11 Inhibitors of angiotensin-converting enzyme, β-blockers,Reference Fabi, Testa and Gesuete 57 and carvedilolReference Berton, Vitali-Serdoz and Vallon 58 were also administered in two patients.
In the newborn that developed takotsubo cardiomyopathy after withdrawal of bupirenorphine,Reference Maruyama, Nomura and Fukushige 11 regardless of the appropriate treatment for his heart failure, re-administration of the bupirenorphine was needed, with further gradual withdrawal.
Mechanical ventilation was required in three patients in our series, two of them after consumption of illicit drugs and sedative.
In cases of left ventricular outflow tract obstruction and hypotension, short acting β-blockers like propranolol and fluids is recommended.Reference Yoshioka, Hashimoto and Tsuchihashi 59 Owing to the occurrence of torsades de pointes, drugs that might cause QTc prolongation should be avoided.Reference Kurowski, Radke and Schunkert 60
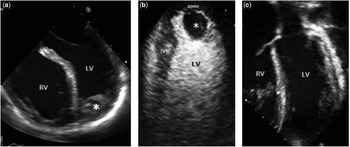
Intraventricular thrombosis is one of the known complications of this self-resolving cardiomyopathy, as observed in one of our patients (Fig 8). It can occur at any time of the disease, and unfortunately may develop despite full dose of anticoagulation.Reference Fabi, Testa and Gesuete 57 C-reactive protein is usually elevated before the formation of the thrombus, implicating inflammation as a potential pathogenic role.Reference Haghi, Papavassiliu and Heggemann 61 C-reactive protein was elevated in our patient at presentation. Anticoagulation should be considered in cases of severe left ventricular systolic dysfunction. In the absence of any randomised control trials evaluating the duration for anticoagulation therapy after left ventricular function has recovered, this medication is used on an empiric basis, and clearly further research is required. Our patient remained on oral anticoagulation for 4 weeks after resolution of the left ventricular thrombus, with normalisation of the systolic function confirmed by echocardiography. None of the other reported children (Table 1) have developed thrombuses.
Two-dimensional echocardiography showing a left ventricular (LV) thrombus (*) in one of the patients from the series (P5), noticed within 24 hours of the beginning of the symptoms. Contrast echocardiography reveals a non-filling space consistent with the thrombus in the left ventricular apex ( b ). Complete resolution of the thrombus occurred after 4 weeks of anticoagulation ( c ). IVS=interventricular septum; RV=right ventricle.

Clinical course
Complete recovery of the ventricular systolic function is necessary to confirm the diagnosis of takotsubo cardiomyopathy. The recovery time varies, and can be as short as few days or as long as several weeks.Reference Sharkey, Lesser and Zenovich 14 In reported cases in childhood (Table 1), the earliest recovery occurred at 2 daysReference Dessardo, Tomulie and Dessardo 8 and the longest at 4 months,Reference Bajolle, Basquin and Lucron 7 with an average of 25 days. In our cases, the normalisation of the left ventricular function took effect between 4 and 6 weeks, with one patient recovering at day 4.
In adults, recurrence occurs in approximately one-tenth of patients.Reference Sharkey, Lesser and Zenovich 14 To the best of our knowledge, no data are available about recurrence of the syndrome in children. None of our patients have had a second episode of ventricular dysfunction after their normalisation.
Conclusions
Although takotsubo cardiomyopathy is nowadays a syndrome mostly diagnosed in adults, newborns, children, and young adults are equally predisposed to develop the condition. Owing to this, paediatric cardiologists should be fully aware of this unique transient cardiac disorder. Triggers, presentation, electrocardiography, imaging, and clinical course are comparable to adults. Takotsubo cardiomyopathy should be considered in the differential diagnosis of patients with a picture suggestive of myocarditis, especially if an abnormality of ventricular mural motion is the predominant echocardiographic feature, and a stressful event has been identified. Coronary angiography should only be performed in children if coronary arterial involvement is highly suspected.
Acknowledgement
The author would like to thank Professor Robert H. Anderson for his critical review and edition of this manuscript.
Financial Support
This research received no specific grant from any funding agency, commercial or not-for-profit sectors.
Conflicts of Interest
None.