This article introduces readers to methodological issues that complicate reporting of outcomes for congenital cardiac surgery. Issues include the need for adjustment for case-mix, uncertainty due to the small size of samples, and methods of summarizing performance across a wide spectrum of procedures. Concepts are illustrated using artificial data from two hypothetical hospitals, as well as real data from a multi-institutional registry.
Background
It is widely recognized that performance in healthcare is reflected in the outcomes experienced by patients. Whether surgical patients have a successful outcome or die following their procedure is at least partly a result of the care they receive during the operation and throughout their stay in the hospital. By analyzing the collective outcomes of a group of patients, it is often possible to gain insight regarding the quality of care provided to them. The analysis of outcomes can identify gaps in quality, focus resources for initiatives to improve quality, and serve as a basis for comparing institutions.
Although the analysis of outcomes can provide information about performance in healthcare, it is inherently challenging to compare outcomes across institutions because factors other than performance can impact these results. Factors such as the case-mix of patients and random statistical variation can cause perturbations that obscure a centre’s true performance. Failure to account for these contributing factors can lead to spurious inferences when comparing different providers.
Case-mix
While many hospitals perform congenital cardiac surgery, not all perform the same types of operations. Hospitals with many high-risk or complex operations (such as the Norwood Stage 1 operation) may have higher rates of mortality than hospitals with a greater proportion of relatively low-risk procedures (such as closure of an interatrial communication within the oval fossa, in other words, repair of a secundum atrial septal defect). Furthermore, even for the same diagnosis, different patients can differ in their presentation and risk-factors. Hospitals that perform surgery on patients with more severe disease and/or comorbidities may have more frequent complications compared to hospitals that perform the same operations in comparatively healthier patients.
Hypothetical example: Hospital A Versus Hospital B
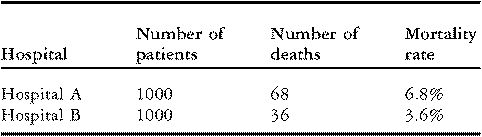
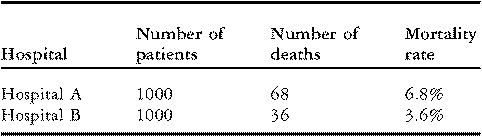
To illustrate these issues, consider the data on in-hospital mortality for congenital cardiac operations performed by two hypothetical hospitals presented in Table 1 below. Although each hospital treated the same number of patients, “Hospital A” experienced 68 deaths (6.8% mortality) while “Hospital B” experienced 36 deaths (3.6% mortality). On the surface, these data may seem to suggest that Hospital B has better performance than Hospital A. However, before drawing any conclusions, it is important to investigate whether the observed difference in rates of mortality might be explained by differences in the case-mix of the patients.
Rates of mortality for two hypothetical hospitals.
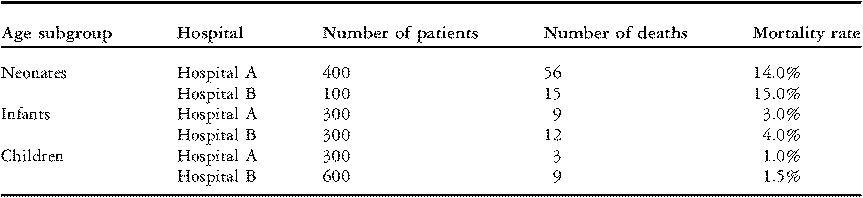
In Table 2 below, we report the data from Table 1 separately for three groups of patients: neonates (age < 30 days); infants (age 1 to 11 months); and children (age 1 to 17 years). In each age group, Hospital B had a higher rate of mortality than Hospital A; a larger percentage of patients died in-hospital. Yet, paradoxically, when the three age groups are combined, Hospital B has the lower overall rate of mortality (3.6% versus 6.8%, Table 1).
Rates of mortality within age subgroups for two hypothetical hospitals.
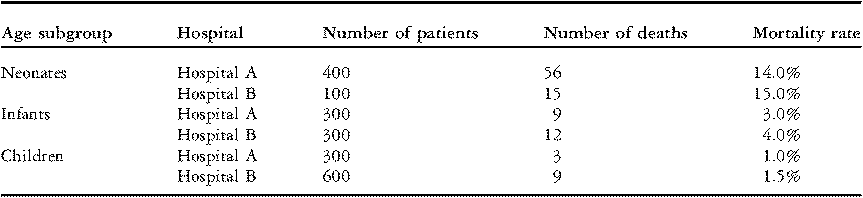
The paradox is resolved by observing that Hospital A performed four times as many operations on neonates (a group with relatively high mortality) compared to Hospital B, and half as many operations on older children (a group with relatively low mortality). The overall mortality percentage is misleading because it does not account for the fact that Hospital A performed surgery on riskier patients.
Methods of adjusting for case-mix: stratification
Stratification is a method of analysis in which patients at each hospital are divided into relatively homogeneous groups called “strata”. Comparisons between hospitals are then made separately within each “stratum”. The goal is to ensure that comparisons between different centres are always performed on comparable patients. If patients within a stratum have a similar risk of adverse outcomes, then patients in the same stratum at different hospitals should be comparable and the comparison of outcomes valid.
The mechanics of stratification are similar to the analysis that was described in the discussion of Tables 1 and 2 above. Data were stratified into three age groups. By comparing patients within the same age group, a different picture of performance emerged than if we ignored age and simply assessed performance based on all ages combined.
Although stratification is simple to explain and interpret, important issues limit its ability to adjust for case-mix. First, the categorization of continuous variables (such as age) is arbitrary. If only a few broad categories are used, individuals with very different risk may be placed in the same category, resulting in bias. This problem can be avoided by making a greater number of more narrow categories, but there may be too few patients available within any single category to reliably estimate performance. Second, stratification can only adjust for a small number of confounding variables. If we attempt to group patients based on the combination of several variables (such as age, weight, gender, and diagnosis), this strategy would require a large number of strata; the size of the sample within any single stratum is likely to be small. Finally, it is important to note that stratification only controls for differences in the variables that were used to create the strata (age, in the example above). Differences between hospitals may reflect confounding due to other risk-factors.
Methods of adjusting for case-mix: direct standardization
Although it is useful to compare outcomes of similar patients, analyzing each stratum separately can be unwieldy when the number of strata is large. One way to simplify reporting is to calculate the stratum-adjusted standardized rate of mortality. This statistic combines multiple individual stratum-specific estimates into a single number. The standardized rate of mortality has the following interpretation: it is the rate of mortality that would be observed at a hospital if all of the hospital’s stratum-specific rates of mortality remained the same but the proportion of patients in each stratum was altered to reflect a “standard” case-mix in some reference population. A standard case-mix can be defined in many ways; a common approach is to pool data across several hospitals and use the totals in each stratum in the pooled sample.
Example: using a national registry as the reference population
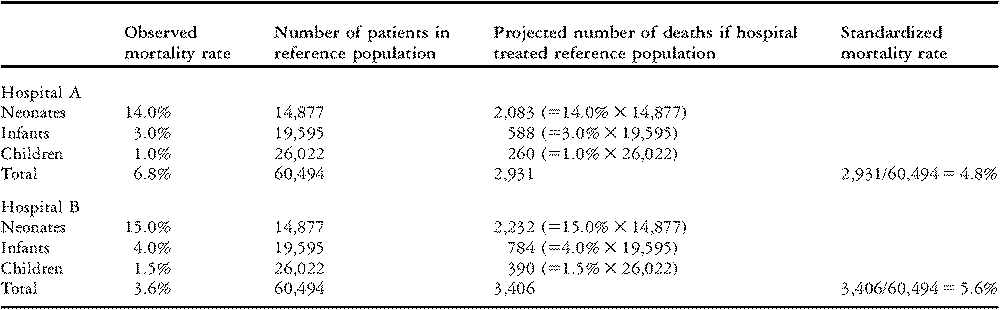
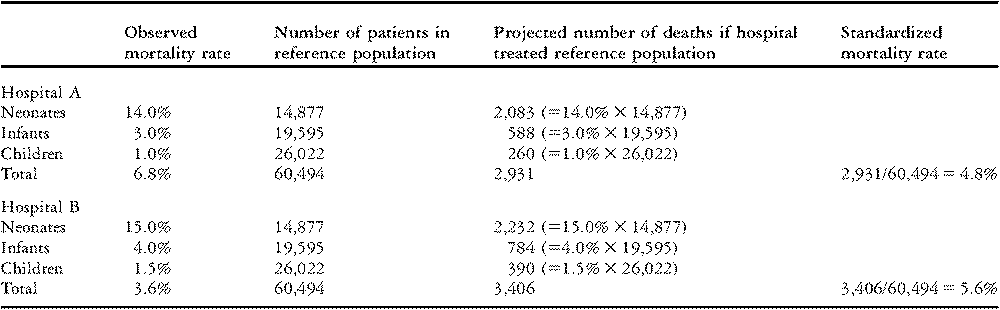
In this example, the “standard” case-mix is based on all patients who underwent surgery during the time period 1998–2006 at the 59 hospitals participating in The Society of Thoracic Surgeons Congenital Heart Surgery Database. Standardized rates of mortality are calculated for hypothetical Hospitals A and B using the stratum-specific data about mortality from Table 2.
Direct standardization shows what each hospital’s outcomes would be if they performed surgery on the entire population in the database while their stratum-specific rates of mortality remained the same. As can be seen in Table 3, Hospital A would have 2,083 deaths in neonates, 588 deaths in infants, and 260 deaths in children. In total, they would experience 2,931 deaths in 60,494 patients, for a rate of mortality of 4.8%. This percentage is the standardized rate of mortality for Hospital A. Similar calculations show that Hospital B would experience 3,406 total deaths for a rate of mortality of 5.6%. Compared to Hospital B, Hospital A has a higher unadjusted rate of mortality (6.8% versus 3.6%; Table 1), but a lower adjusted rate of mortality (4.8% versus 5.6%; Table 3). Thus, Hospital A has better overall mortality when differences in age are taken into consideration.
Standardized rates of mortality for two hypothetical hospitals, calculated using the Method of Direct Standardization.
Because direct standardization relies on stratified data, limitations of this method are the same as those for stratification: categorization of continuous variables is arbitrary; only a small number of confounding variables can be adjusted for; and this technique only controls for differences in the variables used to create the strata.
Methods of adjusting for case-mix: regression analysis
Regression analysis is commonly used instead of stratification or direct standardization when it is necessary to adjust for several confounder variables simultaneously. The goal of regression modelling is to develop a mathematical equation that predicts an individual patient’s risk of experiencing an event, such as mortality, based on clinically relevant variables, such as age, weight, and cardiac diagnosis. The choice of clinically relevant variables may be based on judgment or may be determined empirically from a large data set. Key differences between stratification and regression analysis are summarized in Table 4.
Differences between Stratification and Regression Analysis.

There are different ways of using regression analysis to adjust for confounding when comparing outcomes across different hospitals. One common method, called indirect standardization, involves calculating a predicted probability of the outcome for each patient within a hospital, summing these probabilities to determine the hospital’s expected number of outcomes, and finally comparing the observed number of outcomes to the expected number. The ratio of the observed to expected numbers of outcomes is often called the “observed-to-expected ratio”, and is commonly termed the “O/E ratio”. This ratio is calculated with the following formula:
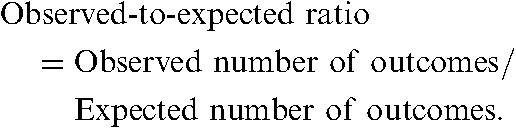
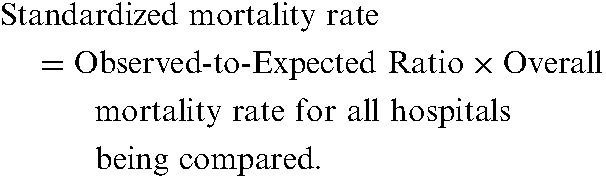
Observed-to-expected ratios are frequently used for analysing mortality. If a hospital’s observed-to-expected ratio for mortality is significantly greater than 1, this implies that its rate of mortality is worse than would be expected given its case-mix. If the observed-to-expected ratio for mortality is significantly less than 1, this implies that the hospital’s rate of mortality is better than expected given its case-mix. For presentation purposes, observed-to-expected ratios are sometimes converted into standardized rates of mortality. Standardized rates of mortality have the same interpretation as described in the section on direct standardization. The following formula is used:
Because regression analysis can adjust for multiple confounder variables simultaneously, it is frequently used in fields such as adult cardiac surgery that have a large number of well-established risk-factors. For example, The Society of Thoracic Surgeons uses regression analysis to calculate observed-to-expected ratios, standardized rates of mortality, and other measures of performance for hospitals participating in The Society of Thoracic Surgeons National Adult Cardiac Database.1
Unlike stratification, regression analysis requires making simplifying assumptions in order to determine the relationship between clinical factors and patient-risk. For example, continuous variables are often assumed to have a linear relationship with the outcome being analyzed. Such assumptions are difficult to verify in practice. Also, most regression analyses produce only a single statistic summarizing a hospital’s overall outcomes. However, due to the wide spectrum of procedures performed, a single overall summary may not always be informative. Good outcomes in low-complexity procedures can mask relatively poor outcomes in high-complexity procedures, and vice versa. Finally, like stratification, regression analysis only adjusts for risk-factors that are explicitly included in the model. Observed differences in outcomes might still be explained by factors that were either not measured or not included in the regression analysis.
Specialized case-mix adjustment methods for congenital cardiac surgery
Congenital cardiac defects are characterized by substantial anatomic diversity. Although certain diagnoses are encountered relatively frequently, variations on the “typical” anatomy are commonplace. To overcome this difficulty, methods of risk-adjustment have been developed to allow comparisons across an institution’s entire case-mix.
The Aristotle complexity adjustment method
In 2004, Lacour-Gayet and colleaguesReference Lacour-Gayet, Clarke and Jacobs2 proposed that an institution’s performance can be expressed as a function of two quantities:
• the institution’s rate of mortality, and
• the average complexity of the cases performed.
In order to quantify “complexity”, the investigators convened an expert panel of surgeons from 23 countries. The panel considered 145 congenital procedures and scored each one on three dimensions:
• potential for mortality,
• potential for morbidity, and
• technical difficulty.
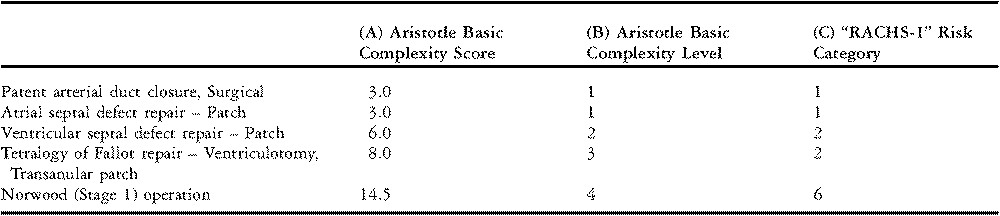
The sum of these three components is called the “Aristotle Basic Complexity Score”. The Aristotle Basic Complexity Score ranges from 0.5 to 15 with larger numbers implying higher complexity. Examples of procedures and their associated Aristotle Basic Complexity Scores are shown in Table 5, column A. The Aristotle Basic Complexity Score reflects the baseline complexity of a procedure and does not adjust for patient-specific factors such as age and comorbidities. In addition to the “Basic Score”, the investigators also proposed the “Aristotle Comprehensive Complexity Score”, which accounts for over 100 patient risk-factors and concomitant procedures. Beyond quantifying complexity, Lacour-Gayet and colleagues also proposed a mathematical formula for combining an institution’s rate of mortality and average complexity of cases into an overall summary of performance.
Examples of congenital cardiac surgery procedures classified by Aristotle Basic Complexity Score, Aristotle Basic Complexity Level, and Risk Adjustment for Congenital Heart Surgery-1 Risk Category.
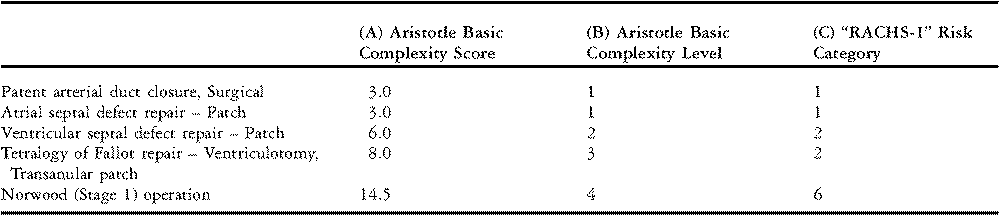
Note: “RACHS-1” denotes the “Risk Adjustment for Congenital Heart Surgery” risk stratification system.
Although Lacour-Gayet and colleagues proposed a novel mathematical formula to determine performance, Aristotle scores can also be incorporated into widely used traditional methods of adjustment for case-mix, such as stratification and regression analysis. For example, The Society of Thoracic Surgeons Congenital Heart Surgery Database produces annual feedback reports for database participants in which procedures are stratified by grouping on the Aristotle Basic Complexity Score. When used as a stratification variable, the Aristotle Basic Complexity Score is often grouped into four standard categories which are known as the “Aristotle Basic Complexity Levels”, as shown in Table 5, column B.
The Risk Adjustment for Congenital Heart Surgery (RACHS-1) method
The Risk Adjustment for Congenital Heart Surgery Method, which has been named the “RACHS-1” method, allows patients with a wide array of defects to be grouped together for analysis.Reference Jenkins and Gauvreau3, Reference Jenkins, Gauvreau, Newburger, Spray, Moller and Iezzoni4 More than 100 types of surgical procedures are grouped into one of six risk categories based on a similar risk for in-hospital death, where category 1 has the lowest risk for death and category 6 the highest. Some examples are shown in Table 5. This grouping of cardiac surgical procedures simplifies the analysis of anatomically diverse cases.
To derive the RACHS-1 risk categories, Jenkins and colleagues convened an 11-member expert panel consisting of pediatric cardiologists and cardiac surgeons.Reference Jenkins, Gauvreau, Newburger, Spray, Moller and Iezzoni4 Experts initially used clinical judgment to assign procedures to risk categories. This allocation of procedures was subsequently refined using empirical data from two multi-institution registries.
To perform institutional comparisons, Jenkins and colleagues propose two methods:Reference Jenkins and Gauvreau3
• stratification based on RACHS-1 risk categories; and
• regression analysis using RACHS-1 categories as explanatory variables along with three additional clinical factors: age at operation, prematurity, and presence of major non-cardiac structural anomalies.
Procedures during which more than one operation is performed simultaneously are placed in the risk category of the highest risk procedure, and an additional correction factor for multiple procedures is included in the regression model.
Chance variation
It is commonly known that rates of mortality have limited precision when the size of the sample is small. Yet, even with a moderate size of the sample, rates of mortality are still less reliable than is often realized. To illustrate, consider rolling a pair of dice and counting how often both dice show the number “1”. Mathematically, this will occur with probability of 2.8%. However, in a finite number of rolls, say 100, it would not be unusual to observe as many as five occurrences of a pair of 1 s (5/100 = 5%) or as few as zero (0/100 = 0%). To put this into context, the probability of in-hospital mortality after congenital cardiac surgery is about 3.8%. Due to random sampling variation, even if the probability of mortality for a particular hospital is 1% less than the national average (that is 2.8%, the same probability that both dice show the number “1”), it would not be unusual for the actual observed rate of mortality of this hospital to exceed the national average. In fact, if the hospital operates on 100 patients, there is a 30% chance that its actual calculated rate of mortality will exceed the national average of 3.8%. If the institution treats 200 patients, there is still a 19% chance that its actual calculated rate of mortality will exceed the national average. This actual rate of mortality would not be a reflection of poor quality, but simply the play of sampling variability or chance.
Methods of accounting for chance variation: confidence intervals
A confidence interval is a range of numbers that is likely to include the true value of the quantity being estimated, such as a rate of mortality. For instance, it is impossible to know the true value of a hospital’s underlying rate of mortality due to sampling variability; there is always some degree of error in measurement involved. A confidence interval indicates the likely magnitude of this variability or error in measurement.
The likelihood that the true value of a parameter is contained within any particular interval depends in part on the width of the interval. In general, one can be relatively confident that the true value lies in an extremely wide interval, and less confident that it lies in a narrow interval. Confidence intervals are typically made wide enough to ensure that they will have a specified probability of including the true value of the population. A 95% confidence interval has the property that it will include the true value of the parameter about 95% of the time. Similarly, a 99% confidence interval will include the true value about 99% of the time. By definition, a 99% confidence interval is wider than a 95% confidence interval.
The width of a confidence interval is also directly related to the size of the sample. As the number of patients increases, the estimated rate of mortality becomes more precise; equivalently, we can be confident that the true value is contained within a shorter interval. For example, if 1 death occurs in 10 patients, the estimated rate of mortality is 10% and the 95% confidence interval extends from 0.3% to 44.5%. If 10 deaths occur in 100 patients, the estimated rate of mortality is still 10% but the 95% confidence interval is narrower, extending from 4.7% to 17.6%.
Example: analyzing rates of mortality in The Society of Thoracic Surgeons Congenital Heart Surgery Database
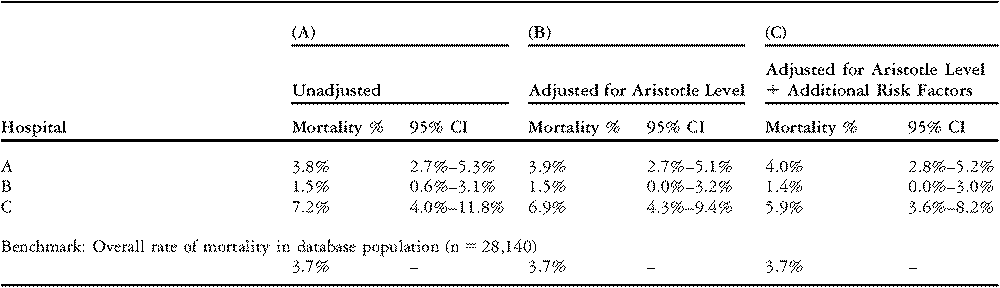
To illustrate the combination of adjustment for case-mix, and confidence intervals, we analyzed in-hospital mortality among 28,140 pediatric surgical cases at 48 hospitals participating in The Society of Thoracic Surgeons Congenital Heart Surgery Database during 2002–2006. Results are reported for three selected hospitals.
Table 6 column A shows unadjusted rates of mortality for the three hospitals as well as the combined rate of mortality for all 48 hospitals. The rate of mortality is greater than the overall average in the database for Hospitals A and C, and less than the overall average in the database for Hospital B. For Hospital A, the 95% confidence interval for the unadjusted rate of mortality extends from 2.7% to 5.3%. Since the confidence interval includes the overall average rate in the database of 3.7%, the hospital’s rate of mortality is not statistically different from average. In other words, the excess mortality might easily be explained by chance variation or sampling variability. For Hospital B, the upper limit of the 95% confidence interval, 3.1%, is less than the overall average value in the database. This implies that Hospital B’s rate of mortality is statistically lower than the average in the database. Finally, for Hospital C, the lower limit of the 95% confidence interval lies above the average in the database value, indicating that the excess mortality observed in this hospital is statistically significant and not likely to occur by chance alone.
Unadjusted and adjusted rates of mortality for three selected hospitals in The Society of Thoracic Surgeons Congenital Heart Surgery Database.

Table 6 column B presents standardized (risk-adjusted) rates of mortality calculated by stratifying patients into four groups based on the Aristotle Basic Complexity Score. Results for the three selected hospitals are similar to the unadjusted results. The rate of mortality for Hospital A is not statistically different from average. For Hospitals B and C, the 95% confidence intervals still exclude the average rate of mortality in the database. Thus, the observed differences in mortality at these hospitals – where B is below average and C is above average – are not explained by variation in the complexity of the case-mix as captured by the Aristotle Basic Complexity Levels alone.
Table 6 column C presents standardized (risk-adjusted) rates of mortality calculated using regression analysis. The statistical model adjusts for Aristotle category plus three additional risk-factors: age group (neonate; infant; child); presence of preoperative ventilatory support (yes/no); and preoperative stay in the hospital greater than 2 days (yes/no). After this adjustment for case-mix, the 95% confidence intervals for both Hospitals A and C include the average value in the database. For Hospital B, however, the upper limit of the 95% confidence interval still lies below the average value in the database. Hence, strong evidence exists that Hospital B’s true risk-adjusted rate of mortality is lower than the average in the database. In other words, Hospital B’s rate of mortality is better than would be expected given its case-mix.
Summary
The assessment of outcome and performance is an integral part of efforts to improve quality, yet such assessments need to be interpreted cautiously. Case-mix and sampling variation can both have a large impact on outcomes, and should both be considered as possible explanations whenever outcomes differ between hospitals. An understanding of statistical tools including risk-adjustment and confidence intervals will help users to correctly interpret measures of performance and avoid pitfalls when making comparisons between providers.
Acknowledgements
We thank The Children’s Heart Foundation (http://www.childrensheartfoundation.org/) for financial support of the publication of this research.
This manuscript was reviewed by the Access and Publications Committee of the Database of the Society of Thoracic Surgeons and approved for publication in this supplemental issue of Cardiology in the Young.