1 Introduction
As western societies experience unprecedented population ageing, the saving behaviour of the elderly and their portfolio holdings becomes central to the policy debate. Dependency ratios will rise dramatically over the next 30 years – especially in Italy, France, Germany and Japan, where they are projected to exceed 45% by 2050 (Mitchell and Piggott, Reference Mitchell and Piggott2003), and population ageing puts huge pressure on the public budget. This is especially true in nations where people are heavily dependent on publicly-provided income and benefit programmes, so unless the elderly are able to finance a consistent share of their expenditure through accumulated assets, the sustainability of national welfare systems will be undermined.
Italy stands at the top of the list of countries with a rapidly ageing population as well as consistent accumulated wealth, the majority of which is tied to real estate equity. Moreover, Italy has experienced a long period of relatively low income growth when not manifest stagnation or, indeed, negative income variation. This poor performance as for income is in manifest contrast with a still comparatively high level of households’ net wealth (indeed, Italian families stand out for their low debt level).
It is puzzling that this wealth is not regarded, especially by the older generations, as a convenient tool to reduce income vulnerability in old age. On one side, policy makers could be less concerned about both the budget effects of ageing and relatively low pension benefits in a country where wealth is significant and widespread. On the other one, the Italian financial sector is not as developed as in Northern European countries and thus the possibility of withdrawing liquidity out of real estate wealth in general and housing equity in particular is very limited. Despite households having high potential to keep their living standards unaffected at retirement, the supply of financial products related to housing depletion is practically non-existent. For these reasons Italy represents an interesting candidate to study the potential demand for one of such products: the reverse mortgage (RM).
From a policy standpoint, RMs are relevant because they could ease the burden of ageing on public budgets by encouraging the direct participation of the elderly in financing their retirement needs. They are also relevant from an individual investor's perspective because they help families to manage risk and to cushion shocks in retirement income.
Despite their welfare-improving potential, RM has met with only very limited acceptance (Caplin, Reference Caplin and Mitchell2001) and many explanations have been put forward to explain it. First of all, it is not just illiquid assets, but all assets that elderly households seem reluctant to shed. While according to Modigliani and Bruemberg's (Reference Modigliani, Brumberg and Kurihara1954) lifecycle hypothesis, individuals smooth their lifetime consumption by borrowing when ‘young’, saving when ‘middle aged’ and dissaving when ‘old’, empirically the rate of wealth decumulation appears slower than the model predicts (Venti and Wise, Reference Venti and Wise1987; Ando et al., Reference Ando, Guiso and Terlizzese1993; Chiuri and Jappelli, Reference Chiuri and Jappelli2010; Angelini and Laferrère, Reference Angelini and Laferrère2010), with precautionary savings motivated by expected health and care expenditures (Carroll et al., Reference Carroll, Hall and Zeldes1992) and bequest motives (Kotlikoff and Summers, Reference Kotlikoff and Summers1981) or a combination of both (Skinner and Zeldes, Reference Skinner and Zeldes2002) explaining discrepancies between facts and theory. More generally, the development of a market for RMs relies on the same conditions necessary for the development of a market for annuities, which to date is still inadequate (Fornero and Luciano, Reference Fornero and Luciano2004).
The portfolio composition of the elderly, which generally favours illiquid assets such as housing (Mitchell and Piggott, Reference Mitchell and Piggott2003), can be a further disincentive to asset depletion. Housing equity can be liquidated by selling one's home and renting, or moving to a smaller dwelling (downsizing), however, this involves both financial and psychological transaction costs (Leviton, Reference Leviton2002), so the elderly may prefer to settle for lower consumption levels. In principle, RM represents a solution exactly to avoid a drop in consumption when old.
We investigate the determinants of interest in the product drawing from a unique dataset, the 2007 UniCredit Survey (UCS), in which over 1,200 respondents express how interested they would be in taking out the loan on a scale from 1 to 5.
We find that some of the main beneficiaries are, indeed, more likely to be interested in the product – i.e., singles, widow/ers and divorcees; however, other potential beneficiaries, i.e., women, older individuals and those with larger housing equity are less likely to be interested in the product. The bequest motive, proxied by having children in the householdFootnote 1, does not preclude interest in the product, but becomes a negative predictor for older households.
Psychological attitudes have a higher statistical significance, with debt aversion being negatively correlated with interest in the product, and risk aversion and concern about the future level of income after retirement positively associated.
The remainder of the paper is organized as follows: Section 1 describes the main features of RMs. Section 2 reviews the relevant literature. Section 3 calculates the net worth of RMs and provides clues on their potential market size. Section 4 introduces the data sources, describes the econometric model and presents the estimated results. Section 5 concludes the paper.
2 Reverse mortgage: an overview
Compared with similar home equity release products, RMs provide a series of safeguards and advantages for the borrowers and their heirs; they are innovative in that they allow elderly homeowners to consume (part of) their housing equity without having to disrupt housing arrangements; they differ from home reversion programmes (such as the sale of bare ownership) in that the property rights over the house remain with the borrowerFootnote 2, who is then protected from the risk of a premature death, since, should it happen, the only amount due to the credit institution will be the sum accrued since the taking out of the loan.
The loan can be paid out as a lump sum, or through fixed monthly payments (term, tenure plan or life annuity), as a line of credit, or as a combination of term/tenure plan and line of credit (Rodda et al., Reference Rodda, Herbert and Lam2000). The amount of the loan depends positively on the age of the (youngest in a couple) borrower and the value of the property and negatively on the interest rate. The outstanding balance of the loan grows over time, as the interest is capitalised, but no payment is due until the borrower (or spouse) dies, moves out or sells the house. When any of these events occurs, the loan must be repaid in full – in one solution within the subsequent 10–12 months – and with any available source of funds, including proceeds from the sale of the house (Eschtruth and Tran, Reference Eschtruth and Tran2001). Borrowers (or their heirs) have the choice to either pay back the loan and keep the house, or sell the house to repay the loan and cash the difference (if any). Thanks to the no negative equity guarantee, if the amount withdrawn exceeds the value of the house once it is sold, borrowers (or their heirs) do not have to pay the difference (Rodda et al., Reference Rodda, Herbert and Lam2000)
Despite these attractive features, RMs have not (yet?) gained the favour of elderly homeowners. Introduced by US Congress in 1987 explicitly to facilitate the financing of consumption in old age (Rodda et al., Reference Rodda, Herbert and Lam2000), Home Equity Conversion Mortgages (HECMs) are still rather uncommon, even in the US, since not even 1% of possible beneficiaries had entered an equity release scheme at the beginning of year 2000 (Caplin, Reference Caplin and Mitchell2001). The trend, however, seems to have changed in more recent years (at least up to the 2008 financial crisis), the market size of HECMs having grown by ten times: Shan's (2011) report to the US Federal Reserve Board of Governors shows that the number of RM loans escalated from less than 10,000 in 2001 to over 100,000 in 2007 and mentions rising home values, lower interest rates, and increasing awareness of the product as plausible explanatory factors (we do not have evidence following the bursting of the housing bubble).
The European Union (EU) RM market is not only very thin, but also unevenly developed across countries with regards to volume of production, lending methods, and diversity of productsFootnote 3. Most equity release schemes in the EU share common criteria, such as minimum age requirements and minimum property value (which must be free from other debt), and involve a series of protections for borrowers, as well as the obligation to carry out repairs and maintenance. Borrowers are protected from declining home prices, because of the no negative equity guarantee.
As many as 13 EU countries have at least one institution supplying some form of equity release productFootnote 4, with Ireland, Spain and the UK totalling the highest numbers of providers. The estimated number of equity release contracts sold in 2007 in the UK was 33,000, versus 3,600 in Spain, 2,500 in Sweden, 300 in Italy, 200 in France and 100 in GermanyFootnote 5 (data for Ireland were not available). The UK has a long history of home reversion plans, dating as far back as 1965Footnote 6; however, according to a report from the Council of Mortgage Lenders (CML), the market has remained substantially underdeveloped and stagnant (Williams, 2008). The CML report suggests that negative reputation of earlier generation equity release products and perceived excessive costs as the main reasons for the market's underdevelopment. Indeed, as the housing price appreciation of the 1980s failed to match the accrued interest on mortgages, borrowers found themselves owing more than their property was worth, raising the need for a no negative equity guarantee.
In Italy, the product was formally introduced in 2005 under the name prestito vitalizio ipotecario available to homeowners over 65 whose housing equity exceeds €70,000. So far, only a few credit institutions offer home equity conversion products: Deutsche Bank's PatrimonioCasa Footnote 7 and Euvis’Footnote 8Prestito Vitalizio are available only as a lump sum, while Banca Monte dei Paschi di Siena offers PrestiSenior Footnote 9 to those over 70 as either a lump sum or an annuity for a maximum of 20 years.
Only a few theoretical papers, namely Nakajima and Telyukova (Reference Nakajima and Telyukova2013) and Michelangeli (Reference Michelangeli2008) have generated guesses concerning household characteristics that are most likely to influence the benefits or costs of RM. More specifically, Nakajima and Telyukova estimate increasing welfare gains for individuals aged between 75 and 85, low income households, those in poor health and owners whose housing value is relatively high. Among the potential reasons for low take up rate, they list, first and foremost a bequest motive, without with the simulated take up rate would increase eight fold, secondly house price risk, thirdly the loan's cost and finally the risk of moving to a nursing home. This latter risk is also investigated by Michelangeli who sees it, together with the lack of diversification in elderly's portfolios, as the main cause of welfare losses provoked by a RM. Michelangeli also claims that RM as a good option for ‘house rich, cash rich’ households, not ‘house rich, cash poor’ as first maintained by the economic literature (Case and Schnare, Reference Case and Schnare1994).
When RM was first introduced, most scholars focused on the potential market size. For instance, Mayer and Simons (Reference Mayer and Simons1993) noted a high potentiality of RMs, since many elderly could use them to pay off pre-existing debts. Conversely, Venti and Wise (1987) saw a limited scope for RMs, claiming that low-income elderly generally have little housing equity available. A few years later, Caplin (Reference Caplin and Mitchell2001) suggested that, even with the most pessimistic assessments, the RMs market should be much larger than it was (in the US), and highlighted transactions costs, moral hazard and uncertainty about future needs and preferences as the main economic forces that hinder its development.
To explain why the market is so thin, other researchers focused on the high costs of RMs. For example, the possibility of moral hazard in the case of meagre home maintenance by homeowners intending to default on their contract obligationsFootnote 10 (Caplin, 2000) and the adverse selection of longer-lived mortgagorsFootnote 11 (Davidoff and Welke, Reference Davidoff and Welke2005) can translate into high insurance fees and make the product rather expensive. Leviton (Reference Leviton2002) also mentions that taking out a RM conflicted with the desire to leave a legacy. Conversely, other studies reported that the elderly would use the RM annuity to help their children (Rodda et al., Reference Rodda, Herbert and Lam2000).
Gibler and Rabianski (Reference Gibler and Rabianski1993) mention debt aversion among the elderly as a barrier to the uptake of RMs. The authors report that older consumers generally dislike buying on credit and would rather live on less income than take out a loan. Caplin (Reference Caplin2000) also suggests that households may prefer a lower level of consumption in a debt-free house to a higher level in a debt-ridden one, relating the presence of debt with an increase in uncertainty. Finally, Shan (Reference Shan2011) indicates that an increased tendency to take on debt over the past few years can explain part of the substantial growth of the US RM market.
Another possible explanation for the limited interest in RMs may be financial illiteracyFootnote 12. Gibler and Rabiansky (Reference Greene1993) differentiate between financially sophisticated homeowners, who may see RMs as part of an investment portfolio decision, and financially unsophisticated ones, who are less likely to be interested in a product that is both unknown and complex. Leviton (Reference Leviton2002) explains how, because of poor financial education, many elderly homeowners overestimated the net worth of their RMs and felt disappointed when given the real figures by mortgage counsellors. Reed (Reference Reed2009) finds that, among Australian homeowners who claimed to be aware of RMs, only 40% understood the basic features, specifically, that no repayments were due and that the house would not be sold. Duca and Kumar (Reference Duca and Kumar2010) also report a positive correlation between households with mortgage equity withdrawals and lack of financial literacy. Finally, Fornero and Monticone (2011) relate financial literacy with effective retirement planning and report that most Italian heads of household lack knowledge of basic financial concepts. It is also worth noting that the US law establishes that borrowers obtain independent (HUD approved) financial counselling before they can apply for a HECM loan (Rodda et al., Reference Rodda, Herbert and Lam2000), while, to our knowledge, this is not yet the case in Europe.
3 Data and descriptives
3.1 Data
Our analysis draws from a unique source of data, the UCS, carried out in 2007. The UCS draws from the population of clients of one of the three largest European banking groups, with over 4 million accounts in Italy.
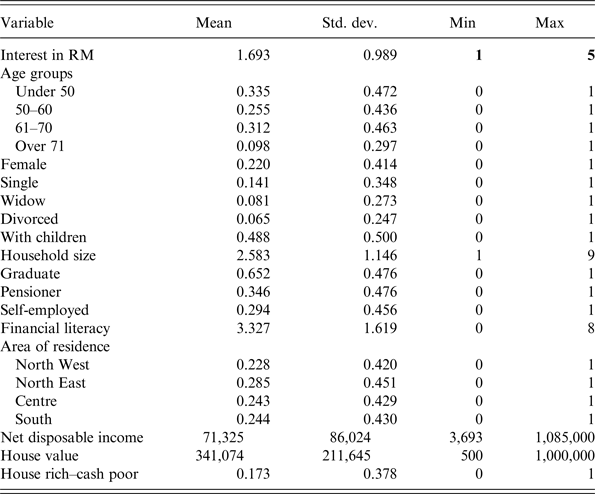
The sample is representative of the eligible population of customers, excluding customers younger than 20 or older than 75, and those who hold accounts of less than 10,000 or more than 2.5 million euro. The goal of the survey is to study retail customers’ financial behaviour and expectations, therefore it has detailed information on household demographic structure, individual financial assets holding (both within and outside the bank), real wealth components and income. Furthermore, it has data on attitudes towards saving and financial investment, risk propensity, as well as financial literacy, assets knowledge and trust in markets/banks. Most importantly, it features a specific question to ascertain the interest in RM, measured on a likert scale from 1 to 5. Summary statistics for the estimation sample are reported in Table 1.
Summary statistics of estimation sample (# 1,070)

Source: UCS.
The UCS dataset has a total of 1,686 observations, and no missing data on income and housing value. The variable we use for household income is imputed by the survey providers, so we did not have to deal with it. As per the other variables, particularly the dependent variable ‘interest in reverse mortgage’, there were no missing values, since all respondents who were asked the question provided an answer. However, since only homeowners who were client of a private bank were asked the question, the number of observations in our estimation sample shrinks to 1,070.
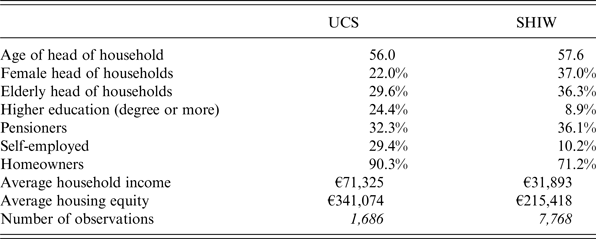
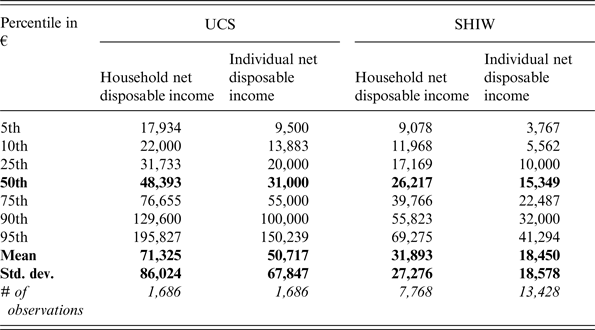
Additional data were extracted from the Bank of Italy's 2006 Survey of Household Income and Wealth (SHIW) to compare the characteristics of UCS respondents with those of a representative sample of the entire Italian population (see Tables 23).
Comparing UCS and SHIW
Source: UCS and SHIW.
Summary statistics by income level and distribution
Source: UCS and SHIW.
The level of interest in RMs is expressed by head of households who own their home. A brief description of the product was given by the interviewer (see the appendix), who then asked respondents to assign a value between 1 and 5 according to their level of interest: 1.1% claimed to be ‘very interested’, 6.2% ‘quite interested’, 12.9% ‘somewhat interested’, 20.4% ‘barely interested’ and 59.4 ‘not interested’.
The average household income in the UCS is €71,325 (median €48,393), roughly 2.2 times the average SHIW household income of €31,893 (median €26,217). The rate of homeownership is also substantially higher: approximately 90% of the UCS households own their home, versus 71% in the SHIW, and the rates of homeownership among the elderly are even higher, 93% in the UCS versus 78% in the SHIW. Also educational attainment is higher in the UCS, as the percentage of respondents who have at least an upper secondary certification is more than double that for the SHIWFootnote 13. As for housing wealth, the table shows how the average house value in the UCS is 1.8 times that in the SHIWFootnote 14, with a mean value of €341,074.
The trade-off between risk and return on investments reveals a majority of moderately risk-averse respondents: Only 1.8% would rather have high returns and high risks, 27.6% prefer good returns and sufficient safety, 52% prefer sufficient returns and good safety and 18.6% prefer low returns but no risks. Expectations of future public pensions is ascertained by asking respondents how worried they felt about their standard of living after retirement, with nearly 40% answering ‘quite worried’ or ‘very worried’. Over 85% of respondents consider not having future debts an important reason for saving, and over 70.5% are averse to debt (questions in the appendix).
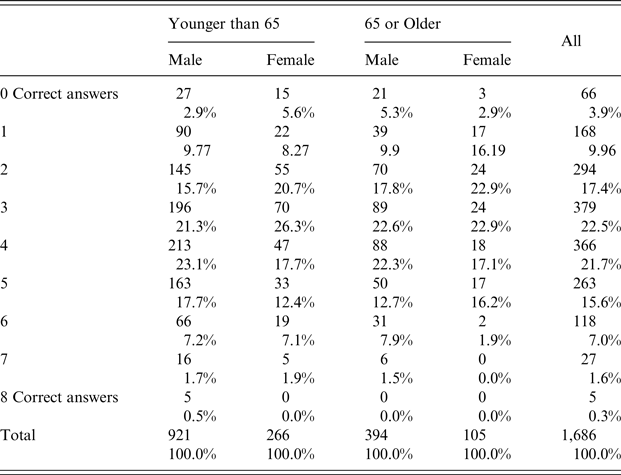
The respondents’ financial literacy was gauged using the same index as in Guiso and Jappelli, Reference Guiso and Jappelli2009 (questions in the appendix). As Table 4 shows, males give on average more correct answers than females, and heads of households younger than 65 perform better than the 65 or over. Older women (over 65) show the lowest levels of financial literacy.
Financial literacy by age group and gender
Source: UCS.
The percentage of ‘house rich cash poor’ households, i.e., those in the top quintile of the housing wealth distribution and bottom quintile of family income distribution, is approximately 17%, and it is higher among the over 65 (18.2% vs. 16.9%).
A preliminary descriptive analysis shows how the distribution of interest in RMs differs according to the previously described variables. The percentage of ‘not interested’ appears slightly higher among individual aged 65 or over, both male and females (Figure 1), while interest is slightly higher among respondents in the lowest quintile of housing wealth (Figure 2).
Interest in RMs – age category and gender
Interest in RMs – by housing quintiles
One potential problem is that our sample is truncated since the UCS restricts participation to clients with at least 10,000 euros in depositsFootnote 15, and the RM question was asked only to homeowners, which is why from the roughly 1,700 observations we are left with about 1,100. The reason we are using the UCS rather than the more representative SHIW is that, to our knowledge, it is the only survey in Italy that includes a specific question on RMs. However, we must also bear in mind that 89.2% of households have a bank or post office account (SHIW 2006), with average financial assets well above €10,000, so hopefully the truncated fraction should be rather small. Furthermore, the UCS surveys our population of interest, since only wealthier homeowners, i.e., those whose housing equity exceeded 70,000 euros (in 2005) can purchase RMs.
4 Estimating the money's value of RMs
Our analysis cannot directly estimate the impact of the monetary value of an RM on actual demand for the product, since we do not have the relevant data; we can, however, appraise its impact on potential demand, as proxied by interest in the product.
We first define the money's value of an RM as the percentage increase in income a household would gain by taking out an RM; we then provide some descriptive statistics for a given demographic and housing equity level, and identify the potential beneficiaries. In the next section, we will use the obtained measure as a regressor.
We adopt the sinking fund formula based on the Evaluation Report of FHA'sFootnote 16 Home Equity Conversion Mortgage Insurance Demonstration by Rodda et al., (2000). The formula yields the payments generated by RMs for a given housing equity level, interest rate and life expectancy of the head of household and assumed house price appreciation rate.
The yearly payment to the borrower under the tenure plan can be computed as an annuity, using the formula
 $$RM_i = L_i^0 \displaystyle{{r(1 + r)^{e_i}} \over {(1 + r)^{e_i + 1} - (1 + r)}},$$
where RM i is the yearly payment to borrower (household) i; L i is the net principal limit to borrower i or maximum loan advance, which is a function of housing equity, the borrower's age and the interest rate. More specifically,
 $$L_i^0 = H(1 + \pi )^{e - 1} /(1 + r)^{e_i} - C_i, $$
where H is the housing equity, π is the net average housing price appreciation, r is the approximated interest rate, e i is the life expectancy (calculated as 100 minus current age) and C i includes all initial costs and fees, which for simplicity we will set as equal to zeroFootnote 17.
For example, if r = 0.08, π = 0.02 and H i = 200,000, a 65-year-old borrower would be entitled to a maximum loan advance of approximately €31,000 or a RM annuity of roughly €2,500 per year; if r = 0.05, the same borrower would be entitled to a maximum loan advance of roughly €80,000 or receive an annuity of roughly €4,700 per year.
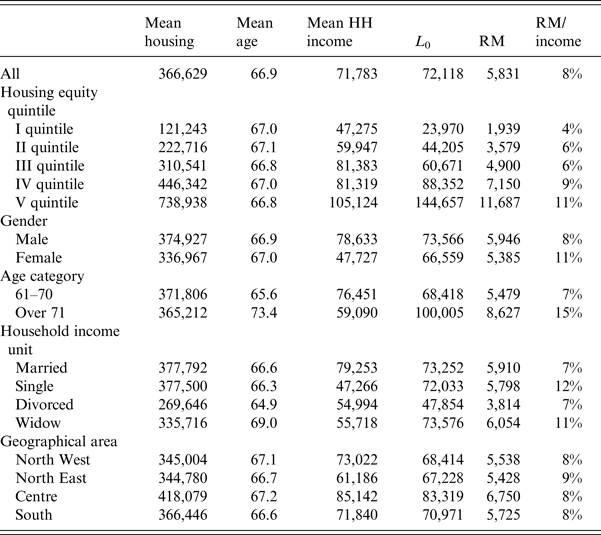
Table 5 describes the results of our calculations for the UCS sample restricted to 65 years old and over.
Estimating the monetary value of RMs (sample 60 years and over)
Source: own calculations from UCS data
Only respondents aged 65 and over selected; r = 0.073, π = 0.02, e = 100-average age for relevant group.
We set the borrower's life expectancy at 100 minus the current age as in Rodda et al., Reference Rodda, Herbert and Lam2000; the interest rate at 7.5% per annum, an average of Deutsche Bank's (7.3%)Footnote 18, and Monte dei Paschi di Siena's (7.9) pre crisis RM interest rate; the house price appreciation rate π is set at 2% a year, while the average housing wealth and average income are estimated from our sample homeowners.
The first column reports estimates of the average housing wealth by housing quintile, age, household income units and geographical area. The second column shows the maximum loan advance L i, the third column reports the annuity A i; the fourth column shows the estimated average income Y i for the categories reported above and the last column calculates the potential benefit from taking a RM as a percentage of income, A i/Y i.
The results are qualitatively similar to those reported by Ong (Reference Ong2008), since those over 75 and single females with lower incomes and above average housing equity would benefit the most from taking out a RM (however the increase is far from spectacular).
5 Econometric specification
We now further our analysis and investigate the determinants of interest in RMs. The respondent's interest in RMs is measured on an ordinal scale, and the levels of interest are represented by a discrete variable that can take one of the following five values:
y i = 1 if the respondent is not interested
y i = 2 if the respondent is barely interested
y i = 3 if the respondent is somewhat interested
y i = 4 if the respondent is interested
y i = 5 if the respondent is very interested
We assume that the discrete values are based on an underlying continuous and latent variable and estimate the marginal effect of x 1 for the jth response using an ordered probit model by the maximum likelihood method (Greene 1999; Train., Reference Greene2003).
The vector of covariates × includes the following: age categories for the head of household, the RM annuity as a percentage of household income (A i/Y i), the log of the household income, the log of housing wealth, a financial literacy index, a dummy for household house rich–cash poor, dummies for macro-areas (north-east, centre and south) and several dichotomous variables to control for heterogeneity (single/divorced, widower, female, retired, self-employed, university graduate, household with or without children).
A second set of psychological controls (risk index, aversion to debt, negative retirement expectations and planning behaviour) are then used to enrich the analysis (the survey's questions used to build the variables are reported in the appendix).
5.1 Estimation results
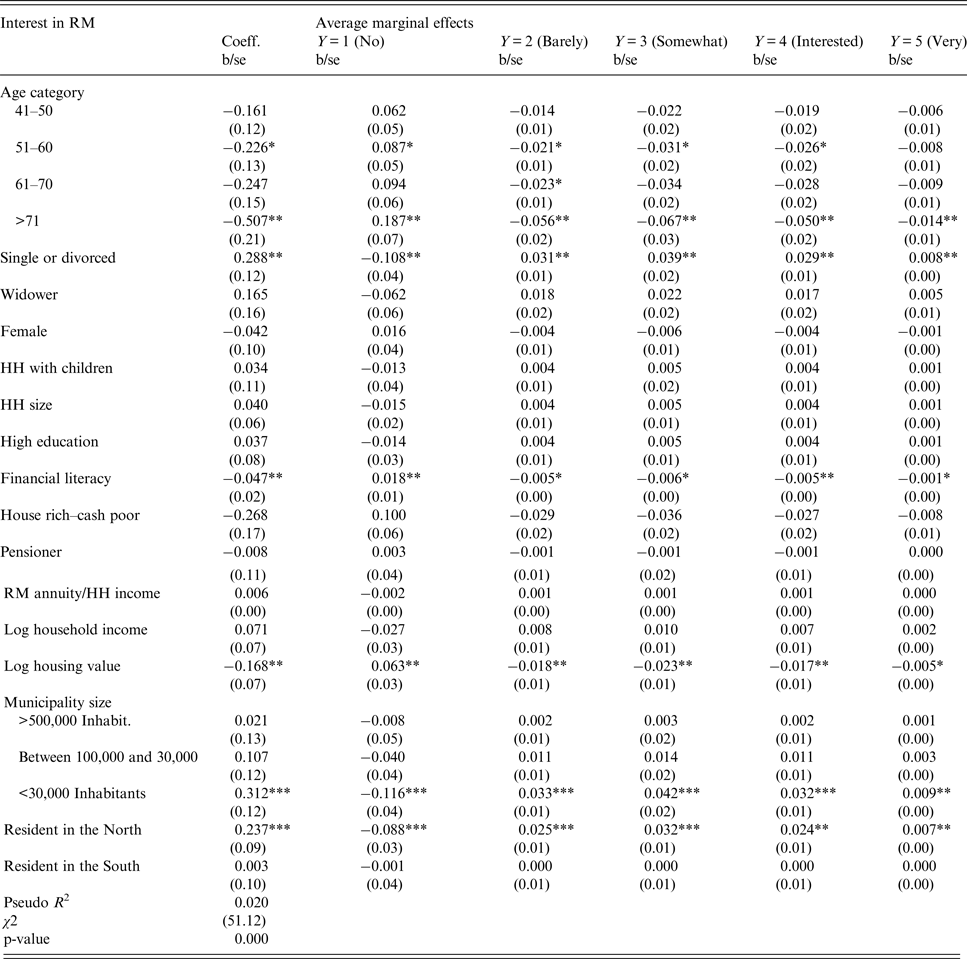
A first-order probit was carried out using only demographic and socioeconomic variables as controls (see Table 6). The only significant predictor of high interest in the product is the dichotomous variable for single or divorced, since among them the probability of answering ‘not interested’ (y = 1) is 10.8 percentage points lower compared to married or cohabiting couples (the reference category). Most age categories are not significant, except for being over 71 which, counterintuitively, has a negative sign. Being resident in the North and in a small municipality (fewer than 30,000 inhabitants) are predictors of being interested. Some of the variables which according to the literature should predict a higher level of interest show, in fact, a negative association: housing value and higher financial literacy. Others like gender, being house rich cash poor and having children in the household, are not significant. The RM annuity as a percentage of income, A i/Y i, is positive, albeit not significant.
Ordered probit regression, controlling for demographics only
Significance ***p<0.01, **p<0.05, *p<0.1.
Standard errors reported in parentheses are robust to heteroskedasticity.
The negative sign of the financial literacy indicator is somewhat puzzling, since a lack of basic understanding may be seen a barrier to the uptake of the loan (Gibler and Rabiansky, 1993). A possible explanation is that, since more financially sophisticated individuals are better at retirement planning (Lusardi and Mitchell, Reference Lusardi and Mitchell2007; Fornero and Monticone, Reference Fornero and Monticone2011), they have already set up alterative schemes and would not benefit as much from an RM. Furthermore, more financially literate elderly homeowners are found to hold a lower share of illiquid assets in their portfolio (Calcagno and Urzì Brancati, 2014) which makes them not only less financially fragile (Lusardi and Mitchell, Reference Lusardi and Mitchell2007), but also potentially less in need of RMs.
As for the negative effect of housing wealth, it is plausible to attribute it to ‘pride of ownership’ or some other kind of less rational attitude. In this case, promoting some counselling for the elderly, for instance offering financial literacy courses in which people are given the basic concept of the feasibility of asset decumulation, may generate higher welfare by informing people about their consumption possibilities.
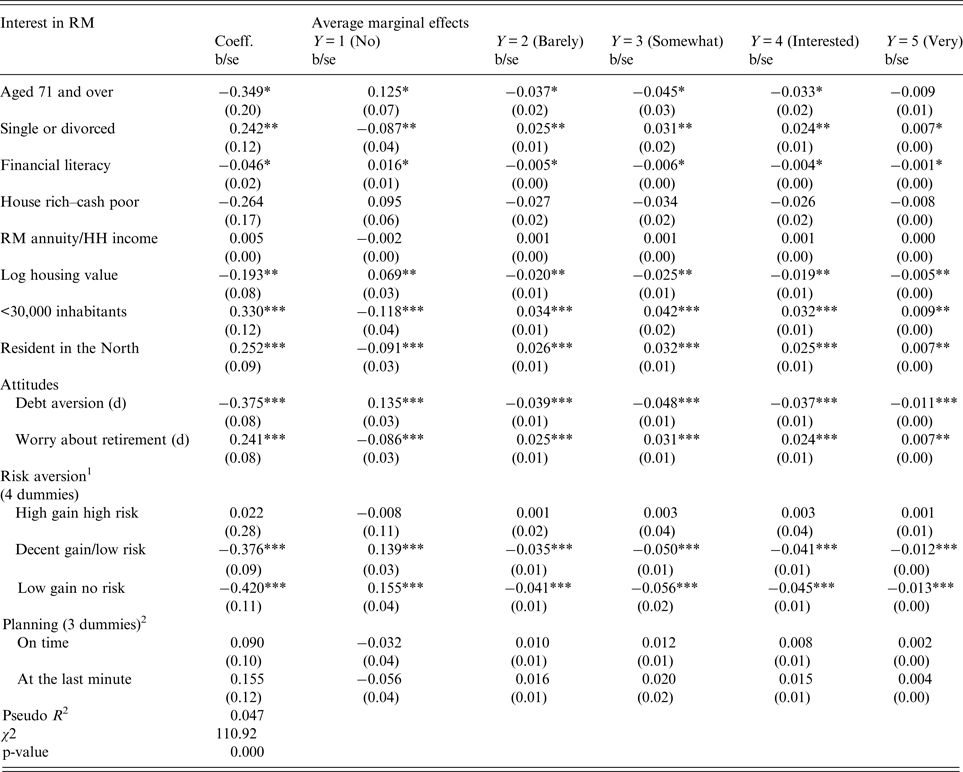
In order to allow for heterogeneous psychological characteristics, we carry out a second-ordered probit regression and include extra controlsFootnote 19. In particular, we add a risk aversion measure, a dummy for negative retirement expectations and debt aversion, and a proxy for tendency to plan (survey questions in the appendix).
Table 7 shows how most results remain unchanged, except that the standard errors for the dummy for age 71 and over and the financial literacy indicator increase. Surprisingly, individuals who would rather have a lower return as long as they have low risk are less likely to be interested than individuals who would accept a higher risk. An aversion to debt raises the probability of saying ‘Not interested’ by 13.5 percentage points, while having negative expectations on the standard of living after retirement reduces the probability of ‘Not Interested’ by 8.6 percentage points, suggesting that, as future pension provisions will shrink and expectations worsen, the demand for this kind of products might increase. The proxies for planning have no effect.
Ordered probit regression, controlling for demographics and attitudes
Significance ***p < 0.01, **p < 0.05, *p < 0.1. Standard errors reported in parentheses are robust to heteroskedasticity.
Other control variables include in the regression but not reported: other age categories, head of household (HH) female, HH widow, HH with children, household size, HH graduate, head of household retired, log of household income, other municipality sizes and resident in the south.
1 Baseline: decent gain, moderate risk.
2 Baseline: well in advance.
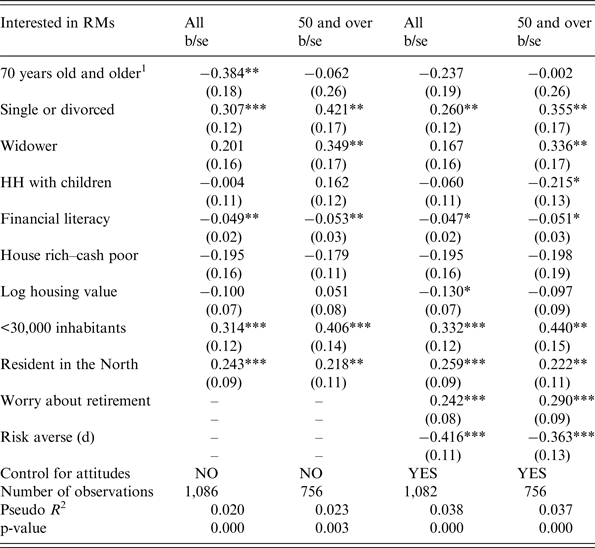
If we restrict the sample size to the 50 years old or over, which leaves us with a total of 756 observations, the main results do not change (see Table 8), except for the dummy for widower which becomes statistically significant and positively associated with interest in the product, both with and without the extra controls. The dummy variable for having children in the household also becomes significant (but only in the specification including the extra controls and only at the 10% level) and negatively associated with interest in the product, providing some kind of support for the bequest motive.
Sensitivity analysis (coeff. only)
Other control variables include in the regression but not reported as they had no significance: age categories 50–60 and 61–70, head of household female, widow, household size, household with children, head of household with degree, head of household self-employed, head of household retired, log of household income; extra controls: planning tendency and debt aversion.
1 Baseline: head of household younger than 40.
6 Conclusions
Understanding the prospective role of RMs is important for both micro and macroeconomic reasons. RM can increase income security in old age and allow better consumption smoothing, as well as alleviate the burden of an ageing population on public budgets. However the product is little known and even less appreciated. This paper contributes to the general discussion on RM by focusing on the Italian potential market.
Since approximately 70% of the Italian households are homeowners, with housing wealth representing over 80%Footnote 20 of their assets, the availability of home equity release instruments is an important determinant of the timing and dimension of wealth depletion with old age. We estimate head of household characteristics most significantly correlated with a given level of interest: being single or divorced predict a higher level of interest, while being over 70 and living in the centre/south has the opposite effect. The bequest motive emerges, if only weakly, and for the older subsample.
We find that the main potential beneficiaries – i.e., women, older individuals as well as individuals with above average housing wealth – appear less likely to be interested. Furthermore, we see that it is mainly among those who worry about their post-retirement standard of living that RM has an appeal, suggesting that, as pension income will decrease, for any given age, in consequence of reforms, the demand for RM may effectively increase in the future. Indeed, since the role of reverse mortgage is to smooth the standard of living throughout the lifetime, and particularly in old age, its demand could significantly increase in the future, in parallel with the reduced role of public pension systems in providing old age income security. As households seem to perceive that they could rely upon these products in case of necessity, the demand side could not be an obstacle to their expansion.
Financial education and independent counselling to the elderly appear to be good instruments to make people aware of the main characteristics of equity release products in order to enhance their role also for consumption smoothing and not just as a response to an emergency situation.
Appendix
Appendix 1 Survey questions used to construct the control variables
(i) Reverse mortgage question/description
A reverse mortgage gives you the possibility to obtain an immediate lump sum or an annuity to supplement your pension, equal to the value of your house, while maintaining the ability to live in it. The repayment of the loan will be responsibility of your heirs, who can choose whether they want to sell the house to pay the loan, or keep it and repay the loan with other funds.
In order to have financial resources/an annuity in old age/retirement age, how interested would you in a reverse mortgage? (likert scale from 1 to 5)
Note, the scale was inverted in the regression for ease of interpretation.
Financial literacy: The respondent is awarded one point for answering correctly questions 1 to 8.
1. Inflation
Suppose a bank account yields a 2% interest per annum (after expenses and taxes). If actual inflation is 2% per year (assuming you did not access your account) after 2 years, the amount deposited can buy you (select one answer):
(a) More than it can buy today; (b) less than it can buy today; (c) the same as it can buy today (correct); and (d) cannot answer/cannot understand.
2. Interest rates
Imagine having a ‘tip’ and knowing for certain that in 6 months interest rates will rise. Do you think it is appropriate to purchase fixed rate bonds today?
(a) Yes; (b) no (correct); (c) I do not know.
3. Diversification
In relation to investments, people often talk about diversification. In your opinion, to have proper diversification of one's investments means (select one response):
(a) To have in one's investment portfolio bonds and shares; (b) not to invest for too long in the same financial product; (c) to invest in the greatest possible number of financial products; (d) to invest simultaneously in multiple financial products to limit exposure to the risks associated with individual products (correct); (e) to not invest in high-risk instruments; (f) I do not know/cannot understand.
4. Diversification 2
Which of these portfolios is better diversified?
(1) 70% T-bills, 15% European equity fund, 15% in 2–3 Italian stocks; (2) 70% T-bills, 30% European equity fund; (3) 70% T-bills, 30% in 2–3 Italian stocks; (4) 70% T-bills, 30% in stocks of companies I know well; (5) Do not know
(ii) Four other financial literacy indicators are based on the question: How risky do you think these products are?
The answers can be from 1=Not risky at all, to 5=Very risky, and ‘Do not know’ is always an option. One point is given if the respondent can correctly state that:
5. : Private bonds are at least as risky as deposits
6. : Stocks at least are as risky as government bonds
7. : Stocks mutual funds are at least as risky as bonds mutual funds
8. : Housing is at least as risky as deposit
The Financial literacy indicator is built by summing up all correct answers from 1 to 8 and
(iii) Risk propensity index
Generally, when I invest I look for
A. HIGH RETURNS even if it entails a HIGH RISK of losing part of the investment
B. DECENT RETURNS but at the same time MODERATE RISK of losing part of the investment
C. DECENT RETURNS but at the same time LOW RISK of losing part of the investment
D. LOW RETURNS but NO RISK of losing part of the investment
(iv) Debt aversion
What is your opinion about borrowing? (select one answer)
(a) I have no qualms/impediments to using loans should I need to (10.5%); (b) I am willing to resort only to limited borrowing, since I would rather not encumber my future with excessive burdens (18.9%); (c) I would rather not have debts (70.6%).
(v) Post-retirement expectations – select one answer
How worried are you about your economic well-being in old age/after you retire?
1. Not worried; 2. barely worried; 3. quite worried; 4. very worried.
(vi) Shop around (Bargain)
Before purchasing something worth a relatively large amount of money (e.g., cars, appliances, furniture, etc.), some people tend to visit more shops/contact multiple vendors to make comparisons and tick the best product in terms of quality/price ratio. How much do you feel this behaviour is like you?
1. Not at all like me; 2. barely; 3. somewhat; 4. quite; 5 very much like me.