



Introduction
Solanum sarrachoides Sendtner (SOLSA) is an annual species that is part of the so-called ‘Solanum nigrum complex’ (Solanum section Solanum), which is composed of many morphogenetically different taxa (Edmonds and Chweya, Reference Edmonds and Chweya1997). This species is morphologically similar to the species Solanum physalifolium Rusby var. nitidibacatum (Bitter) Edmonds (SOLPH); for this reason, both species have frequently been considered to represent the same species (Solanum sarrachoides Stend.) (Edmonds and Chweya, Reference Edmonds and Chweya1997). Both species are native to South America and currently distributed worldwide (Edmonds and Chweya, Reference Edmonds and Chweya1997). Both species are also present in Spain as non-native weeds in fields of irrigated crops (Sobrino and Del Monte, Reference Sobrino and Del Monte1994). However, the distribution and habitat of these species differ completely. For example, SOLPH is widely distributed in the Northern Plateau (and continues to expand its range), whereas SOLSA is confined to a small area in central Spain (Toledo) (Sobrino and Del Monte, Reference Sobrino and Del Monte1994), near to the location where it was initially discovered by Laorga (Reference Laorga1983). This suggests that the germination process of SOLSA may be restricted and its range therefore limited.
The germination process is very important in the life cycle of a plant, affecting the survival, development and population dynamics of a species. These processes are controlled by both genetics and the environment (Gutterman, Reference Gutterman, Black, Bradford and Vazquez-Ramos2000; Meyer and Pendelton, Reference Meyer and Pendleton2000; Del Monte and Dorado, Reference Del Monte and Dorado2011). A plant species can adapt to local habitats by adopting genotypic changes; in addition, phenotypic variability can produce temporal variations in the germination process by maintaining a seed bank in the soil that facilitates dispersal over time. However, dormancy is a common attribute of many weed seed populations, which can only be measured by the absence of germination. Dormancy [‘internal condition of the seed that impedes its germination under otherwise adequate hydric, thermal and gaseous conditions’ (Benech-Arnold et al., Reference Benech-Arnold, Sánchez, Forcella, Kruk and Ghersa2000)] should not just be associated with the absence of germination; rather, it is a characteristic of the seed that determines the conditions required for germination. When dormancy is considered in this way, any environmental cue that alters the conditions required for germination is, by definition, altering dormancy (Finch-Savage and Leubner-Metzger, Reference Finch-Savage and Leubner-Metzger2006).
The loss of dormancy following seed dispersion, and subsequent germination, can be promoted by: (1) environmental factors such as the ambient temperature, water potential of the soil, the amount of light, etc. (Bewley and Black, Reference Bewley and Black1994; Pérez-Flores et al., Reference Pérez-Flores, Carrari, Osuna-Fernandez, Verónica Rodriguez, Enciso, Stanelloni, Sanchez, Bottini, Iusem and Benech-Arnold2003; Finch-Savage and Leubner-Metzger, Reference Finch-Savage and Leubner-Metzger2006) [Each of these factors may act individually or in combination; in addition, these factors tend to vary by season in the area where the seeds are distributed. Seeds often incorporate the effects of these factors over time (Del Monte and Dorado, Reference Del Monte and Dorado2011).]; (2) endogenous growth regulators, i.e. promoters such as gibberellic acid (GA) or inhibitors such as abscisic acid (ABA) (Karssen et al., Reference Karssen, Groot, Koornneef, Thomas and Grierson1987; Groot and Karssen, Reference Groot and Karssen1992; Ni and Bradford, Reference Ni and Bradford1993).
Temperature is the environmental factor that has the greatest effect on dormancy and seed germination. The temperature affects germinability by regulating dormancy or the germination rate of seeds that do not exhibit dormancy (Totterdell and Roberts, Reference Totterdell and Roberts1980; Roberts and June, Reference Roberts and June1983; Murdoch et al., Reference Murdoch, Roberts and Goedert1989; Bouwmeester and Karssen, Reference Bouwmeester and Karssen1992). Numerous studies have sought to determine the effect of different temperature regimens (T), i.e. constant temperatures (Covell et al., Reference Covell, Ellis, Roberts and Summerfield1986; Dahal et al., Reference Dahal, Bradford and Jones1990; Bradford et al., Reference Bradford, Tarquis and Durán1993) or alternating temperatures (Murdoch et al., Reference Murdoch, Roberts and Goedert1989; Ellis and Barrett, Reference Ellis and Barrett1994), on seed germination.
The loss of dormancy in seeds is associated with an increase in GA biosynthesis and a degradation of ABA (Karssen et al., Reference Karssen, Groot, Koornneef, Thomas and Grierson1987; Groot and Karssen, Reference Groot and Karssen1992; Ni and Bradford, Reference Ni and Bradford1993). The ABA–GA balance is modified by environmental factors. For example, a regimen of alternating temperatures appears to promote germination by enabling the embryo to overcome physical limitations. It is also possible that the regulation of dormancy status results from the response of this balance through hormone signalling networks that influence sensitivity to ABA and GA (Huarte and Benech-Arnold, Reference Huarte and Benech-Arnold2010, Footitt et al., 2011).
Population-based models have been used to successfully predict the occurrence of seed germination. Two approaches, an empirical model and a mechanistic model, have been used to model seed germination. Empirical models incorporating various levels of empiricism can effectively match individual-level data on germination over time; however, these models may need more empirical variables (Brown and Mayer, Reference Brown and Mayer1988). The empirical approach may be useful for a specific purpose; however, it is difficult to interpret the biological significance of derived model parameters (Bradford, Reference Bradford1990; Forcella et al., Reference Forcella, Benech-Arnold, Sanchez and Ghersa2000). Mechanistic threshold models for seed germination have achieved some success (Forcella, Reference Forcella1993; Benech-Arnold and Sánchez, Reference Benech-Arnold, Sánchez, Kigel and Galili1995; Allen et al., Reference Allen, Meyer, Khan, Black, Bradford and Vazquez-Ramos2000; Roman et al., Reference Roman, Murphy and Swanton2000; Bradford, Reference Bradford2002; Rowse and Finch-Savage, Reference Rowse and Finch-Savage2003). Population-based modelling approaches investigating the occurrence of germination as a function of temperature and/or water potential have been well developed in recent decades, using concepts of thermal time (θ T ) (Garcia-Huidobro et al., Reference Garcia-Huidobro, Monteith and Squier1982) and hydrothermal time (θ HT ) (Bradford, Reference Bradford, Kigel and Galili1995; Finch-Savage et al., Reference Finch-Savage, Steckel and Phelps1998; Allen et al., Reference Allen, Meyer, Khan, Black, Bradford and Vazquez-Ramos2000, Dorado et al., Reference Dorado, Fernández-Quintanilla and Grundy2009).
Thermal time (degree-day or degree-hour) is a well-established developmental mathematical parameter that is used to model the effect of temperature on the development of seed germination (García-Huidobro et al., Reference Garcia-Huidobro, Monteith and Squier1982; Ellis et al., Reference Ellis, Covell, Roberts and Summerfield1986; Dahal et al., Reference Dahal, Bradford and Jones1990; Bradford, Reference Bradford, Kigel and Galili1995; Kebreab and Murdoch, Reference Kebreab and Murdoch1999a, Reference Kebreab and Murdochb, Reference Kebreab and Murdoch2000; Alvarado and Bradford, Reference Alvarado and Bradford2002). According to the model, the thermal time θ T (g) for the percentile g is:
 $$ \theta _{ T }( g ) = ( T - T _{ b }) t _{ g } $$
where T is the actual temperature (incubation mean temperature), T b is the base or minimum temperature required for germination and t g is the time to germination for a given percentile g. Because the germination rate (GR) is defined as the inverse of the time to radicle emergence of a specific percentile of the population, equation (1) can be rewritten:
 $$ GR _{ g }\, = \,\frac {( T - T _{ b })}{ \theta _{ T }( g )}\, = \,\frac {1}{ t _{ g }}. $$
GR is linearly related to temperature within a range of sub-optimal temperatures ranging from the base temperature (T b ) to the optimal temperature (T o), i.e. the temperature at which maximum germination rate occurs for non-dormant seeds. The linear relationship between GR g and T [i.e. the slope of the linear regression line, which is equal to the reciprocal of thermal time (θ T (g))] varies among different subpopulations. Equation (2) was also described previously by Covell et al. (Reference Covell, Ellis, Roberts and Summerfield1986), indicating that it was also valid for a range of temperatures above the optimal temperature.
If the variation in θ T (g) within a seed population follows a log-normal distribution (Covell et al., Reference Covell, Ellis, Roberts and Summerfield1986; Ellis et al., Reference Ellis, Covell, Roberts and Summerfield1986), then the change in germination time with thermal time can be described using repeated probit analysis:
 $$ probit ( g )\, = \,\left (\frac {1}{ \sigma _{ \theta _{ T }}}\right )\,^{\ast }\,log(( T - T _{ b }) t _{ g })\, - \,\frac {log( \theta _{ T }(50))}{ \sigma _{ \theta _{ T }}} $$
where probit(g) is the probit transformation of the cumulative germination percentile g, θ T (50) is the thermal time to 50% germination (or median thermal time to germination) and σθ T is the standard deviation of θ T for individual seeds in the population. Once T b is estimated, the thermal time to germination t(g) can be normalized on a thermal time scale by multiplying this parameter by (T – T b ). Thermal time models have been used successfully to predict the occurrence of seed germination under non-water-limiting conditions, thus explaining approximately 80% of the variation in the cumulative percentile (Garcia-Huidobro et al., Reference Garcia-Huidobro, Monteith and Squier1982; Covell et al., Reference Covell, Ellis, Roberts and Summerfield1986).
Under current environmental conditions, the habitat of SOLSA appears to be restricted to a small area in the centre of the Iberian Peninsula where its potential to act as an invasive weed is currently limited. In this paper, we propose a thermal model of SOLSA germination (using different temperature regimes and GA concentrations as a way to overcome dormancy) to model, understand and to justify its behaviour in this environment and under a warmer climate in the near future, if increased average temperatures in the Mediterranean area occur as a result of global warming (UNEP and WMO, Reference Solomon, Qin, Manning, Chen, Marquis, Averyt, Tignor and Miller2007), which could increase the distribution area of this weed.
Materials and methods
Plant material
SOLSA seeds were collected in 2009 from corn fields in La Puebla de Montalban (Toledo, Spain) where the plant grew as a weed. SOLSA normally germinates in late spring and early summer among irrigated crops. The soil water content did not limit germination, as the zone is irrigated. The typical temperature regimen in this area is shown in Table 1 (SIAR, 2013). The climate of the area is classified as continental Mediterranean and characterized by hot and dry summers.
Typical temperatures encountered at La Puebla de Montalban, Toledo, Spain during different seasons: T max, average maximum temperature; T m , average medium temperature; and T min, average minimum temperature. Historical data obtained from SIAR (2013)

Weed populations were mostly concentrated along the edge of the crops and consisted of 11–15 individual plants. The mature berries of all observed specimens were collected and pooled; the berries were crushed and the seeds were washed for 1–2 min in a sieve under running water to eliminate all traces of the berries; the seeds were then cleaned, initially dried on filter paper to eliminate excess water and then air dried and stored at room temperature for 2 months. Experiments lasted for 16 weeks thereafter. A previous experiment with 1-year-old SOLSA seeds showed no variation in the germination levels. Immediately prior to the germination experiments, the seeds were treated with 1% sodium hypochlorite for 3 min (to prevent infections during the assay) (Chen and Chang, Reference Chen and Chang1972), washed with distilled water to eliminate any residue and dried at room temperature.
Experimental design
Germination tests were carried out in a growth chamber with a constant 12 h light/12 h dark photoperiod and two different types of temperature regimens: a constant temperature regimen (ΔT= 0) and alternating temperatures (ΔT ≥ 5°C) (see Table 2). The factors used to build the model included the average incubation temperature (T m ) with constant and alternating temperatures (when using alternating temperatures the thermal regime was 12/12 h with the high temperature coinciding with the period of light, and obviously T m ± ½ temperatures), the temperature difference (ΔT) and the concentrations of GA in which the seeds were incubated. Fifteen thermal treatments with different values of T m and ΔT and five treatments with GA doses ranging from 0 to 1000 ppm (G0 to G4) were established, for a total of 75 distinct treatments with three replicates per treatment. Each treatment is defined by a specific combination of a thermal treatment and a GA concentration, as shown in Table 2 (e.g. T10/0G0 = average temperature of 10°C, temperature range of 0°C (constant temperature) and GA concentration of 0 ppm).
Thermal treatments and gibberellic acid concentrations used in the experiment

Gibberellin treatments and temperature regimes
Gibberellic acid 3 (GA3, the most commonly used commercial form of GA) has been shown to disrupt dormancy in, and promote the germination of, the seeds of several genera of plants. The GA used in this experiment consisted mostly (90%) of GA3 (Fluka, Sigma-Aldrich, St. Louis, Missouri, USA), a form of gibberellin frequently used in seed germination assays. This commercial formulation of GA3 contains no surfactants or other related compounds. Two types of experiments have been conducted to examine the association between GA and seed germination: in a first type of experiment, the germination solution contained a constant concentration of the plant growth regulator (Groot and Karssen, Reference Groot and Karssen1992; Ni and Bradford, Reference Ni and Bradford1993); in a second type of experiment, the plant growth solution was applied only at certain times (mainly at the imbibition phase) and replaced with a water solution (Andreoli and Khan, Reference Andreoli and Khan1999; Jusaitis et al., Reference Jusaitis, Polomka and Sorensen2004, Machado de Mello et al., Reference Machado de Mello, Streck, Blankenship and Paparozzi2009). We used the latter approach in this experiment.
Seeds were imbibed for 24 h (Machado de Mello et al., Reference Machado de Mello, Streck, Blankenship and Paparozzi2009) on paper soaked in 5 ml of one of the different GA solutions in Petri dishes (9-cm diameter) at each temperature regimen [this time period (24 h) was included to calculate the accumulated thermal time, because in some of the treatments the seed germination started during this period]. Subsequently, the seeds were rinsed with distilled water and immediately placed in Petri dishes (9-cm diameter) only with water up to the end of the assay.
Five different concentrations of GA3 (Table 2) were prepared by dissolving GA in distilled water. The solutions had a final pH of 7 ( ± 0.1), they were buffered and the pH adjusted with phosphate buffer (pH 7.0). Initially, only GA concentrations lower than 1000 ppm were used. However, because no significant differences between these concentrations and G0 were observed, we increased the GA concentration to 1000 ppm, as the aim of the study was not to determine the minimum dose needed to reach germination but rather to determine the role of GA in the germination process.
Germination tests
Three replicates of at least 90 seeds were placed on blotter paper in 9-cm glass Petri dishes and moistened with distilled water (3 ml). All of the replicates were randomized within each temperature and incubated in a growth chamber. Three identical growth chambers were used, and the temperatures were monitored every 20 min using temperature sensors linked to HOBO_U12 data loggers (Onset Computer Corporation, Pocasset, Massachusetts, USA). Data were considered acceptable if the recorded temperature remained within the prescribed limit of ± 0.5°C. A 12 h light/12 h dark photoperiod was used for all of the temperature regimens. All the experiments were set up at 10.00 hours, the first hour of the light cycle. The occurrence of germination was recorded daily for at least 21 d. The emergence of a radicle of length 1.0 mm was counted as a germinated seed. All Petri dishes were moistened with distilled water as needed to replace evaporation losses. Mean germination rate (GR50, d− 1) is the inverse of mean time (t 50) value, and t 50 is the time taken for seeds to reach 50% germination.
Data analysis for the thermal time model
The final germination percentile was calculated on the total incubated population per treatment. Germination rates (GR g ) for g= 30, 50 and 70% within a given GA treatment were calculated using equation (2) (1/t g ) when the percentiles of germination in each treatment reached the mentioned values of g. The T b parameter was obtained by combining the data from a range of mean incubation temperatures (T m ) and germination rates (g) within a given GA treatment (see Figs 1 and 3). A linear regression analysis was used to obtain the intercept; the average intercept of all cases represents the estimated value of T b . Although this method is more time consuming than other commonly used methods (Ellis et al., Reference Ellis, Covell, Roberts and Summerfield1986), we were able to verify that T b had a constant value for each population.
(colour online) Relationship between germination rate (GR) (30, 50 and 70%) and T m with ΔT= 0°C (dashed line) or ΔT ≥ 5°C (solid line) in the G4 treatment. T b is the point of intersection of the regression lines and the x-axis. The percentiles shown in the figures were of the treatments: T15/0 (all), T20/0 (all), T25/0 (all), T30/0 (all), T15/10 (all), T17.5/5 (all), T17.5/15 (all), T20/10 (all), T20/20 (all), T22.5/5 (all), T22.5/15 (all), T25/10 (all) and T27.5/5 (all).

The mean thermal time to 50% germination for the log thermal time distribution at alternating temperatures (θ T (50)) was calculated using the T b value obtained previously for a g value of 50%:
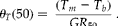 $$ \theta _{ T }(50) = \,\frac {( T _{ m } - T _{ b })}{ GR _{50}}\,. $$
T m values (i.e. temperatures above T b ) were used to estimate the thermal time; more specifically, T m was multiplied by a factor that expressed the proportion of hours per day during which this temperature occurred. If T m was lower than T b , the thermal time was null (but never negative). Data from different temperature regimens can be normalized on a thermal time basis (Covell et al., Reference Covell, Ellis, Roberts and Summerfield1986) and will follow the linear relationship described in equation (3). The estimated thermal time θ T (50) values were used in equation (3) to calculate the standard deviation of the log thermal time distribution at alternating temperatures (σ θt ). Using the probit model, the median germination time was estimated using values corresponding to probit 0.5 (Bradford, Reference Bradford1990; Tompsett and Pritchard, Reference Tompsett and Pritchard1998). An analysis of variance (Statgraphic Plus 5.1, Statistical Graphics Corp., Virginia, USA) was performed to probe relationships between T m, ΔT and GA. Statistical significance was defined as P< 0.05. Tranformation of the data was applied as necessary to achieve normality.
Results and discussion
The final germination percentiles achieved in each treatment and the results of the multiple range tests are presented in Table 3. In treatments with ΔT =0°C and GA < 1000 ppm, no germination (i.e. percentile germination of 0%) occurred after 3 weeks of incubation. This suggests that the natural dormancy of SOLSA cannot be overcome by increasing T m and GAs below 150 ppm. These results are not consistent with those obtained by Dahal et al. (Reference Dahal, Bradford and Jones1990) in different tomato cultivars (Solanaceae), where the authors observed a linear relationship between germination and incubation temperatures ranging from the base temperature to the optimal temperature.
SOLSA germination percentage ± standard deviation and results of the multiple range test for the different treatments (n=90; P<0.05)

To overcome this presumed dormancy of SOLSA seeds, a treatment of 1000 ppm GA (G4) was applied to new batches of seeds incubated in temperature regimens with ΔT= 0°C and fixed T m values (previously used). High concentrations of GA have been similarly used for this purpose by Riley (Reference Riley1987), who used concentrations of up to 2000 ppm, and Rosner et al. (Reference Rosner, Harrington, Dreesen and Murray2002) and Machado de Mello et al. (Reference Machado de Mello, Streck, Blankenship and Paparozzi2009) who used concentrations of up to 1000 ppm. Once applied, the G4 treatment was able to disrupt seed dormancy in thermal treatments with T m values greater than 15°C. In all cases, full germination (>90%) was achieved and no significant differences among the treatments were observed (Table 3). As can be deduced, the disruption of dormancy requires a high concentration of GA (G4) and a minimum value of T m . This relationship between T m and germination has been observed previously in other crops, such as melon (Welbaum and Bradford, Reference Welbaum and Bradford1991), weeds such as Solanum (Del Monte and Tarquis, Reference Del Monte and Tarquis1997) and nine annual weed species (Steinmaus et al., Reference Steinmaus, Prather and Holt2000).
The relation between germination rate GR g and temperature was plotted for different values of g (30, 50 and 70%) in Fig. 1 (dashed line) and a linear relationship was observed. The intercept on the x-axis (14 ± 0.27°C) of previous linear relationships for the different values of g represented the estimated T b value of the population under the experimental conditions (Ellis et al., Reference Ellis, Covell, Roberts and Summerfield1986; Kebreab and Murdoch, Reference Kebreab and Murdoch1999a, Reference Kebreab and Murdochb; Steinmanus et al., Reference Steinmaus, Prather and Holt2000). Similar linear relationships and similar T b values (14 ± 0.23°C) were obtained for G4 treatments with ΔT values greater than 5°C (Fig. 1, solid line). The T b value obtained in treatments with G4 explains the absence of germination for T m values less than 15°C.
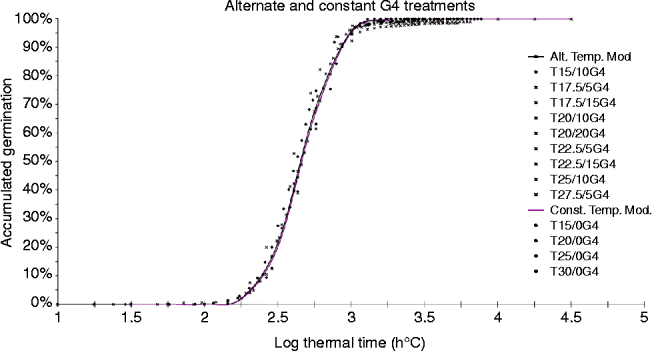
Figure 2 shows the relationship between the percent germination and log θ T (g) of SOLSA seeds treated with G4 for all thermal regimes. The similarity of the two curves confirms that both types of treatments (constant and alternating temperatures) have common θ T (50) and σ θT values (19.40 d°C and 0.2, respectively). Regardless of the ΔT, full germination was achieved in all treatments, albeit at different times. More specifically, the time to full germination was increased as T m approached T b (14°C). In treatments with alternating temperatures (ΔT ≥ 5°C) and GA values of less than 1000 ppm, the germination pattern was different from that observed in the previous cases. Alternating temperatures favoured the disruption of SOLSA seed dormancy (Table 3). These results are consistent with those obtained by Totterdell and Roberts (Reference Totterdell and Roberts1980) and Murdoch et al. (Reference Murdoch, Roberts and Goedert1989) in different plant species. Ellis and Barrett (Reference Ellis and Barrett1994) studied the germination of lentils (Lens culinaris Medic.) under an alternating temperature regimen and proposed a model whereby temperature changes decrease the thermal time θ T (g) while maintaining T b constant.
(colour online) Relationship between accumulated germination (%) and log θ T (g) in the G4 treatments.
As with G4 treatments, in treatments with GA doses ≤ 150 ppm, a linear relationship between GR g and T m was observed for different values of g. In Fig. 3 this linear relationship is shown for treatments which reached values of 30, 50 and 70 percentiles. However, the estimated T b was 16 ± 0.54°C in these treatments, and germination did not occur in treatments with T m < 16°C. These results suggest that T b was constant when GA dose was ≤ 150 ppm and that T b up to 14°C when GA was 1000 ppm. The occurrence of a constant T b in Lens culinaris Medic. was described by Ellis and Barrett (Reference Ellis and Barrett1994). Other authors (Covell et al., Reference Covell, Ellis, Roberts and Summerfield1986; Del Monte and Tarquis, Reference Del Monte and Tarquis1997; Grundy et al., Reference Grundy, Phelps, Reader and Burston2000; Kebreab and Murdoch, Reference Kebreab and Murdoch2000; Alvarado and Bradford, Reference Alvarado and Bradford2002) have stated that T b varies with alternating temperatures.
Relationship between germination rate (GR) (30, 50 and 70%) and T m with ΔT ≥ 5°C for different concentrations of GA: (a) G0, (b) G1, (c) G2 and (d) G3. T b is the point of intersection of the regression line with the x-axis. The percentiles shown in the figures were of the treatments: T17.5/15 (30 and 50%), T20/10 (all), T22.5/5 (all), T22.5/15(all), T25/10 (all) and T27.5/5 (all).

If we ignore the results obtained with G4, the highest percent germination was achieved in treatments with a ΔT value between 5 and 10°C and a T m value between 20 and 27.5°C (Table 3); these conditions were thus considered optimal for germination. A clear reduction in the final percentage germination was observed only when ΔT was ≥ 15°C and when T m approached T b , such as happens on treatments T17.5/5 and T17.5/15 which have the same T m but ΔT was different (5°C and 15°C, respectively). In addition, this reduction increased as ΔT increased. This inhibition of germination with increasing values of ΔT was consistent with the observations of Kebreab and Murdoch Reference Kebreab and Murdoch(1999a). The optimal conditions described in this experiment suggest that with these conditions the seeds of SOLSA reach full germination without requiring the addition of GA. This could be due to de novo synthesis of GA or by reducing the balance of ABA/GA. This aspect has not been evaluated in this paper, but in both cases germination was promoted (Table 3).
The de novo synthesis of GA appears to be an important requirement for overcoming dormancy (Jacobsen and Olszewski, Reference Jacobsen and Olszewski1993; Huarte and Benech-Arnold, Reference Huarte and Benech-Arnold2010), as an increase in GA resulted in the disruption of dormancy and induction of seed germination (Finch-Savage and Leubner-Metzger, Reference Finch-Savage and Leubner-Metzger2006). According to Kucera et al. (Reference Kucera, Cohn and Leubner-Metzger2005), the production of GA may result in an increased growth potential of the embryo during germination by relieving the mechanical constraints associated with the layered lining of the seed, and acting to weaken the tissues surrounding the radicle. The germination of Solanaceae seeds may be inhibited by the micropylar endosperm cap. Therefore, an increase in the biosynthesis of GA and an increased degradation of ABA in Solanaceae could result in a mitigation of the overall effect produced by these tissues. The members of Solanaceae appear to be highly sensitive to GA (Finch-Savage and Leubner-Metzger, Reference Finch-Savage and Leubner-Metzger2006), as the addition of GA appeared to facilitate the germination of seeds. Nevertheless, according to Huarte et al. (Reference Huarte, Luna, Pagano, Zavala and Benech-Arnold2014), alternating temperatures reduce ABA/GA ratios through a reduction in ABA accumulation during incubation but without altering GA synthesis as compared to that observed under constant temperatures; and alternating temperatures did not increase sensitivity to GA.
The germination rate of SOLSA appears to be influenced by the concentration of GA. Figure 4 shows the relationship between g and log θ T (g) for treatments with ΔT ≥ 5°C and varying GA concentrations (G0, G1 and G2). Under these conditions, θ T (g) was inversely related to the concentration of GA, whereas σ θT was not affected by increasing values of GA (Table 4). According to these results, we can observe a logarithmic relationship between GA concentrations and the log θ T (50) characterized by an R 2 value of 0.97 (Fig. 5). Figure 6 illustrates the relationship between accumulated germination and log θ T (g) at different concentrations of GA; the thermal time decreased for each percentile increase in the concentration of GA. As was discussed above, for alternating and constant temperatures, thermal time values were markedly lower in the G4 treatment than in the other GA treatments.
(colour online) Relationship between accumulated germination (%) and log θ T (g) for G0, G1 and G2 treatments with ΔT ≥ 5°C.

Parameters of the model for SOLSA germination at different alternating temperatures and for different GA treatments. Log θ T (50)=log thermal time to 50% germination in d°C; σ θT =standard deviation of the log thermal time distribution within the seed population; θ T (50)=thermal time to 50% germination in d°C; T b =base temperature of the alternating regimen

* Alternating and non-alternating regimens are included.
(colour online) Relationship between log θ T (50)°C and GA concentration.

(colour online) Relationship between g and log θ T (g).

A proposed model for the relationship between SOLSA germination and temperature regimens (alternating or constant) shows that dormancy can only be overcome with an exogenous treatment of 1000 ppm GA, a thermal time of 19.40 d°C and when T m >T b (14°C). Similar values were obtained for an alternating temperature regimen and the same exogenous GA treatment. For other alternating temperature treatments, dormancy was overcome when T m >T b (16°C) and when a minimum thermal time of 66.00 d°C was achieved in the absence of exogenous GA. The thermal time was reduced to 27.30 d°C with the addition of 150 ppm GA. These results indicate that a direct relationship exists between germination, T m , ΔT≥ 0°C, and decrease in the ratio ABA/GA (by means of an increase in GA biosynthesis or a degradation of ABA). These results also suggest that a ΔT value between 5 and 10°C and a T m value between 20 and 27.5°C were optimal for germination.
Values of T m near T b and ΔT values greater than 15°C are commonly encountered in the study area (Table 1). These values appear to negatively affect SOLSA germination and establishment, which enables other species to compete with SOLSA for resources. In the study to assess the impact of global warning in Spain (Castro et al., Reference Castro, Martín-Vide and Alonso2005) an increase in the average temperature, every 30 years, throughout the 21st century is foreseen, between 1.1 and 1.2°C in winter and between 1.8 and 2°C in summer. If this increase in the average temperature occurs, SOLSA could readily germinate, the time when it germinates will also be longer and its range will extend. In these circumstances, the presence of SOLSA as a weed in crops is likely to be more frequent in the Iberian Peninsula. However, the temperature difference will still occur, which may act as partial restriction on their ability to germinate.
Financial support
This research received no specific grant from any funding agency, commercial or not-for-profit sectors.
Conflicts of interest
None.



