


List of Symbols
c b concentration of dissolved air or impurity at center of contact
c s concentration of dissolved air or impurity in pore water
d thickness of liquid film between particles
D displacement of contact surface
D i coefficient of diffusion of dissolved impurity
F force between particles
h height of melt cap
k i thermal conductivity of ice
K thermal diffusivity of ice
L latent heat of fusion of ice
n number of dissociated ions per molecule of solute

Introduction
The sintering and deformation of snow at sub-freezing temperatures has been studied extensively but very little work has been done on the physics and deformation of wet snow. In general, information about the deformation of dry snow cannot be applied to that of wet snow since the deformational processes are very different.
The introduction of the third phase, liquid, causes rapid changes in the material properties of snow. Hydrologists, concerned with the “ripening” of a seasonal snow cover, are familiar with these changes and the thermodynamics of this ripening process are used here to construct a physical model of the response of wet snow to an applied stress. The central feature of this model of wet snow is pressure melting at the inter-particle contacts. The input parameters required for the model include the stress, initial grain size, liquid-water content, and ionic impurity content. In order to make the model more quantitative, further work is being done to include time-dependent stereological effects such as grain growth and the number of stressed contacts per particle. The thermodynamics of the pressure-melting process itself are adequately described by the current model, hence many qualitative and semi-quantitative conclusions can be made.
The Geometry
Rapid grain growth occurs in wetted snow until grain diameters of 1 to 2 mm are attained and, in the absence of an applied load, the grains are well rounded. Wakahama (1968) observed these particle-size distributions changing with time and a thermodynamic model of this process was developed by Colbeck (1973, [1975]). Peppiatt and Sambles (1975) and Peppiatt (1975) observed similar behavior with lead crystallites.
A typical particie shown in cross-section.

Before the stress is applied, the deformation model assumes a cubic packing of well-rounded ice spheres at least partially saturated by liquid. Upon the application of stress, pressure melting causes the growth of flat spots at the stressed contacts and the snow densifies as the particle centers move closer together. In a cubic packing, each particle melts a t six contacts (see Fig. I), a close a pproximation to the 6-4 contac ts per particl e calculated by Visscher and Bolsterli (1972) for ra ndomly packed , equal-size sphe res. From Figure 1 it can be seen that

and

Since the me lting taking pla ce a t the contacts is balanced by freezing on the free particle surfaces, the mass of each pa rticle is conserved, hence

where rp and rb both incrcase with time. T he d ensity of the snow (neglecting the mass of the pore fluids) a t a ny time during the deforma tion is
Regelation
Pressure melting occurs at the inter-particle contacts because the phase-equilibrium tempera ture is lowered by the normal stress at these contacts. The presence of dissolved air and ionic impurities in the thin liquid film of melt water which sepa rates the ice particles also affects the contact temperature. Accordingly, the temperature at the contact is

where the first term is the temperature d pression due to the normal stress at the contact, the second term is the temperature increase due to the relative absence of dissolved air in the melt water which comprises the liquid film, and the third term is the temperature decrease due to the presence of dissolved ionic impurities in the liquid (the dissolved air and ionic impurity concentrations are considered later). The normal stress at the contact is greater than the bulk stress on the sample by a factor equal to the ratio of the area of the unit cell to the contact area, or

The heat flow which controls the rate of pressure-melting at the bond is in turn controlled by the temperature difference between the bond and the particle’s free surface. The temperature of the free surface depends upon the radius of curvature of the particle, the liquid water content of the sample, and the ionic impurity content of the pore water. There are two distinct regimes of liquid saturation in a porous medium that require separate thermodynamic descriptions. At lower liquid saturations where air occurs in continuous paths throughout the pore volume, the phase equilibrium temperature of the pore-particle surfaces is (Colbeck, 1973)

where the first term represents the temperature depression due to the capillary pressure p c, the second term represents the effect of particle radius r p, and the third term arises due to ionic impurities in the pore water. The capillary pressure, or “liquid tension”, is determined by the radius of curvature of the liquid-air menisci, which in turn is determined by the degree of liquid saturation of the wet snow sample.
At higher liquid saturations the air occurs in individual bubbles and the phase equilibrium temperature of the free particle surfaces is (Col beck, 1973)

where the first term is due to the radius of curvature of the trapped air bubbles r a. The temperature difference ΔT between the melting contacts and the pore surfaces is then specified by Equations (5), (6), and (7) or (8). The temperature difference is highly variable depending on both constant parameters (σb, r o, p c, n, S s) and time-dependent variables (r b, D, r p, c b, S b, d). The resulting heat flow into the contact is approximately

where the “area factor” δ serves to reduce the heat flow at high densities when more than 50% of the particle surface is covered by the six melting contacts. Accordingly, the rate of increase of volume of a “melt cap” is given by

where

The rate of increase of particle size is now

and the rate of increase of ice density is

Liquid Film
For a given situation, the compaction under an applied load can be calculated iteratively from the starting point p o as long as ΔT can be found. Assuming the liquid film was saturated with dissolved air, Colbeck (1976) made these calculations, obtaining results which were qualitatively correct but which greatly overestimated the rates of densification. If dissolved air is only partially able to diffuse from the pore water into the liquid film, the contact temperature T b would be increased by as much as 0.002 4 deg thus causing a very significant drop in temperature difference and heat flow. Likewise, if ionic impurities diffuse from the pore water into the liquid film, a significant temperature decrease would occur in the film. Thus the rate of densification is very sensitive to the relative balance between the advection and diffusion of both ionic impurities and dissolved air through the film. An analogous situation was described by Drake and Shreve (1973) who showed that the rate of movement of a wire through a block of ice by regelation is very sensitive to the movement of dissolved impurities around the wire. Morris (1976) reported a similar discrepancy between theory and observation in other regelation experiments.
The liquid film is disc-shaped (see Fig. 2) with radial flow of the melt water from the center and radial diffusion of the impurities towards the center of contact. The general solution of the Navier-Stokes equations for this problem is unknown (Wang, 1976) and most existing solutions (e.g. Wang, 1976) are too limiting for the present problem. Problems which arise in lubrication theory, for example, arc usually treated by assuming the film thickness and/or the pressure distribution (see Cameron, [c1966]). Assuming the average liquid film is axially symmetric, we adopt the quasi-steady solution for the average flow speed v in the squeeze film under a disc (see Moore's (1965), review of squeeze films)

Continuity of liquid flow between two melting contacts requires that

hencc the thickness of the liquid film is

where the rate of increase of height of the melt cap (dD/dt) is given by

and dV/dt is known from Equation (10).
Assuming a quasi-steady distribution of dissolved impurities at any time, advection and diffusion are in balance when the concentration c at any radius r is described by

or
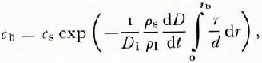
where c b is the concentration at the center of the contact, c s is the concentration in the porc liquid, and D i is the diffusion coefficient for the solute under consideration. The experimental evidence suggests that the thickness of the liquid film d is independent of the radial position (i.e. the contacts are flat) hence Equation (19) can be simplified somewhat. Nevertheless, the impurity concentration in the liquid film c b is sensitive to the rate of melt-cap growth (dD/dl) which is in turn sensitive to the impurity concentration. During the early stages of deformation the film thickness is of little consequence because the large stress concentration at the contacts causes a large temperature depression regardless of the impurity content (a measurement of contact temperature as a function of time is shown in Figure 3). However, the thickness of the liquid film becomes a very important parameter later in the deformation process when the liquid film dominates the temperature gradient which drives the pressure melting. The rate of deformation is particularly sensitive to the thickness of the film because of the positive feed-back mechanism involving the film velocity, impurity concentration, temperature gradient, rate of melting and, again, the film velocity. This makes the iterative calculations difficult and requires carefully specified initial conditions.
Neighboring parldes are separated by a liquid film through which the melt water is discharged.

The contact temperature measured in wet snow is a decreasing function of time. The temperature drops rapidly upon the application of a stress but then quickly, decays as the contact radius increases.

Other Considerations
The freezing of pore water on the free-particle surfaces releases latent heat which balances the consumption of latent heat by melting at the contacts. In principle, supercooling associated with freezing and superheating associated with melting reduce the temperature gradient which drives the regelation. Taking an average of the values of supercooling summarized by Drake and Shreve (1973), the temperature difference is reduced by approximately

Although this is a very small correction to ΔT, it is included in the model. Superheating in the liquid film, an even smaller effect, is ignored.
The available experimental evidence suggests that the model overestimates the rate of densification at the lower densities, hence we consider the heat capacity of the particles and transient heat conduction as possible mechanisms for slowing the calculated rate of pressure melting. First, the heat capacity of 1 mm radius ice spheres is insignificant because the ratio of thermal mass to the rate of heating suggests that a time lag of only one second is needed for the ice particles to adjust to temperature changes as large as 0.01 deg. A calculation of the temperature midway between the surface and center of a sphere provides an additional measure of the rapid time response in these small particles. If a sphere is heated uniformly over its surface, the mid-point temperature is given by (Carslaw and Jaeger, 1947, p. 222)

where K is thermal diffusivity and q is the surface heat source. For a large heat source at the early stage of deformation and a 1 mm radius sphere, the internal temperature adjusts quickly. As shown by Table I, the 1/e response time following the sudden application of the heat source is about 7 s. Accordingly, we conclude that the quasi-stead y approximation to heat conduction is ad equate.
An Example of Internal Temperature Versus Time

Other explanations must then be used to account for the difference between the computed rates of deformation and those being observed in current laboratory experiments. There are two important explanations which are reported here but will be described in detail later; both a rise because grain growth occurs simultaneously with deformation. First, the concurrent grain growth reduces heat flow to the melting contacts by diverting heat flow to the smaller particles which are disappearing by melting. Second, the number of melting contacts per particle is reduced because some of the contacts are not stressed. Both of these phenomena are most active during the early stages of deformation, which is when the calculated rates of deformation are too large.
Computed Results
In Figure 4, the computed ice density of the snow is shown as a function of time for pore water saturated with dissolved air but with various sodium chloride contents (these contents were chosen to correspond with experiments in progress). Clearly, higher impurity concentrations reduce the rate of pressure melting by decreasing the phase equilibrium temperature at the site of freezing, the pore surfaces. There is a corresponding decrease in the rate of deformation, although the decrease is moderated somewhat by the diffusion of impurities into the liquid film between the particles. The deformation cannot be stopped altogether by the presence of ionic impurities unless, in the absence of an applied stress at the inter-particle contacts, the liquid film at the contact freezes by reversed heat flow. This appears to happen on the surface of wet snow at ski areas when salt is applied and the surface of melting snow quickly hardens.
The result of increasing capillary pressure (decreasing liquid-water saturation) is shown in Figure 5. At higher capillary pressures, the rate of densification is less because the phase equilibrium temperature in the pore space is reduced by increasing capillary pressure, just as it is reduced by increasing the ionic impurity contents. The major difference between the effects of capillary pressure and ionic impurities is that impurities decrease their own influence by diffusing into the liquid film between the particles, whereas capillary pressure introduces a constant reduction in the temperature difference between contact and pore surfaces. The experimental evidence of Kinosita (1963), Kojirna (1967), and Tusima (1973) all show that the compressibility of wet snow increases with liquid content as shown in Figure 5. Tusima’s data (see Fig. 6) shows a reduction in compressibility with decreasing liquid-water content (or increasing capillary pressure) which is qualitatively similar to the computed results shown in Figure 5.
Ice density computed as a function of time for various sodium chloride contents (hydrostatic stress 12 000 N/m2, saturated sample, r0 = 1 mm). The ionic impurity content is expressed as (gram) moles of solute per kilogram of solution times the number of ions per molecule (2). The pore water is always saturated with dissolved air.

Ice density computed as a function of time for various capillary pressures (hydrostatic stress of 12 000 N/m2, 0.000 38 mol NaCl/kg times number of ions per molecule, ro - 1 mm).

Ice density is shown as a function of time using data taken from Tusima (1973). The samples were repeatedly loaded (36 loads per minute) with a stress of 3.25 × 10⁵ N/m2.

The computed temperature difference driving the pressure-melting process is shown as a function of time in Figure 7. The main feature is the rapidly decreasing temperature difference (or rapidly increasing temperature at the contact) up to about 50 000 s. This rapid temperature rise occurs because the area of the contact increases rapidly immediately after the stress is applied but the rate of increase of contact area slows markedly as the densification proceeds. The small increase in temperature difference (decrease in contact temperature) after about 250 000 s occurs because impurities diffuse in to the liquid film at the contacts once the rate of melting and liquid-film speed decrease.
Computed temperature difference and liquid thickness shown versus time (hydrostatic stress of 12 000 N/m2, 0.000 38 mol NaCl/kg times number of ions per molecule, r0 - 1 mm).

The computed thickness of the liquid film is also shown versus time in Figure 7. Initially, the thickness of the liquid film decreases rapidly because of the rapidly decreasing rate of flow through the film but, subsequently, the rate of decrease slows because of the decreasing stress at the contact. The minimum values of the thickness of the film are about 2 × 10 −5 mm or one-tenth of the values reported by Nye (1967) for the regelation of wires through ice. It appears that the film is stable a t a size which is just barely large enough to accommodate the necessary liquid and impurity movements. If for given conditions the film size decreases or is too small for the effective movement of impurities, the reduced impurity flow would cause an increase in the film temperature and the rate of melting. As shown by Equation (16), the film size would increase accordingly.
The initial particle radius is a very important parameter in this model because, as shown by Equation (13), the rate of densification is dependent on r 0, T p, and r b). The result of increasing r o is to decrease the heat flow to the melting contacts and decrease the rate of densification (see Fig. 8). Grain growth during a period of 10 6 s can increase the average particle size from 0.5 to 1.0 mm and have a very large effect on the rate of densification. As stated earlier, particle growth also decreases the rate of densification by reducing the number of stressed contacts. Clearly these stereological features of wet-snow deformation must be the subject of further study.
Computed ice density is shown against time for various values of the initial particle radius (hydrostatic stress of 12 000 N/m2, 0.000 38 mol NaCl/kg times number of ions per molecule, saturated samples).

Summary
Wet snow is a very peculiar material whose physical properties are largely controlled by the thermodynamics of phase equilibrium. The most important thermodynamic variables are the liquid-water content, particle size, ionic impurity content, and inter-particle stress. To understand the deformation caused by pressure melting, we have described the interparticle contact size, the thickness of the liquid film separating the particles, the diffusion of dissolved impurities into the liquid film, and the rate of heat flow towards the contacts. By assuming a simplified geometrical packing and neglecting grain growth, a physical model of the densification of wet snow is constructed. The model calculates the ice density as a function of time following the application of stress. The results given here show the effect of liquid-water content, ionic impurity content, and initial particle size on the compressibility of wet snow. The results are qualitatively accurate and suggest that the physical description of wet-snow mechanics is meaningful. This model will be more quantitative once concurrent grain growth is introduced.
Discussion
J. HALLETT: Have you investigated the effect of CO2?
S. C. COLBECK: I have included the effect of dissolved air in the liquid water and therefore the effect of dissolved CO2. I have not looked at the effect of dissolved CO2 on the phase boundaries in any other way.
D. TABOR: I note that the authors have emphasized the role of ions in the regelation process. I wonder therefore if they have considered the possible role of the electrically charged double layer in reducing the force between the ice particles. In colloidal systems the double layer produces repulsive pressures of the order of a fraction of an atmosphere for liquid films of the order of a few 100 Å thick. Could this play a significant part in the processes they have described ?
COLBECK: Since my calculated values of the thickness of the water film are as low as 200 to 300 Å I have worried a great deal about what is happening between the particles. It appears to me that the water film begins at a fairly large value but then decreases to a size which is only barely large enough to allow the diffusion of dissolved impurities into the film. If the film size is small enough to prevent the diffusion of dissolved impurities, then the temperature gradient would increase and the rate of melting would increase accordingly. Presumably the water-film thickness would have to increase to pass the larger quantities of melt water, and diffusion of the impurities would then be restored to achieve a proper balance. Therefore I think the assumption of a layer of homogeneous water is reasonable.
One of the reasons I came to this conference was to get new ideas about the behaviour of this thin film and I would be happy to have any thoughts about it.
J. W. GLEN: Is the complexity of the feed -back process such that very small variations in the parameters lead to impossibly large variations of calculated quantities-in other words, is it useful for calculating actual results or not?
COLBECK: Physically, the processes appear to be fairly stable over the range of parameters which we have examined. Therefore useful results can be achieved although with some computational difficulties. The computational problems arise because we must have a good idea of the correct values before the computations begin. We expect to improve on the computational methods by work now in progress.



