




No CrossRef data available.
Age of immersion as a predictor of foreign accent
Published online by Cambridge University Press: 19 July 2005
Abstract
This study examines the relationship between age of immersion (AOI) and the degree of perceived accent (DPA) that raters who speak native English perceive in the speech of Mandarin speakers who learned English as a second language. AOI and speech samples of variable length and linguistic context (single words, sentences, short paragraph, and self-generated picture narration) were collected from the target group (n=32, AOI=3–16) and from native speaker controls. A moderately trained native speaker panel of college students then rated the samples on how “native” they sounded using a continuous scale. Rating was broken over three separate sessions to relieve fatigue, and a reliability measure was administered at the onset and termination of each session to ensure consistency. Reliable performance was demonstrated both across judges and across sessions and indicated no single AOI demarcated a “critical period.” Instead, DPA was found to deviate from native in a highly linear manner with AOI, as did speakers' tendencies to noticeably deflect from this line. These deviations began at an AOI of about 5, although some speakers bottomed out with an AOI as early as 7, whereas nearly native ratings were given to others whose AOI was greater than 5. Females were rated as more native and variably accented than males. Ratings of native decreased with sampling length but increased with extemporization, the effect of AOI on DPA being similar for all sampling types.
Information
- Type
- Articles
- Information
- Copyright
- © 2005 Cambridge University Press
The amount of research committed to studying the relationship between the age at which one begins to acquire a language and one's final ability at pronunciation is at near parity with the amount of controversy this research has generated (for reviews see Harley & Wang, 1997; Hyltenstam & Abrahamsson, 2000; Long, 1990; Piske, MacKay, & Flege, 2001; Scovel, 2000; Singleton, 2001). Over time this controversy appears to have grown larger, not smaller, despite the even larger commitment of time, energies, and minds to this problem. It is widely agreed upon that age of immersion (AOI) into a language is linked to the degree of perceived accent (DPA). However, there is dispute as to the character of this connection and how it relates to other factors that may bear upon second language (L2) attainment: for example, neurological plasticity, cognitive development, motivation, psychosocial states, formal instruction, language learning aptitude, and first language (L1) versus L2 usage.
One reason for dispute is that the set of factors that influence perceived accent is not constant over the timeline of chronological age. Different factors may combine to yield an apparent effect of AOI, yet each factor may evolve in its own manner, influencing L2 acquisition to a greater or lesser extent, depending upon the learner's age and personal circumstances. Although how “native” a speaker sounds in an L2 acquired at age 2 versus age 5 may be more a function of neurological plasticity than psychosocial factors, the opposite may be true of L2s acquired at age 12 versus age 15 (Birdsong, 1999a). To make matters worse, many of the candidate factors such as neurological plasticity and psychosocial state are currently unknowable and/or immeasurable. Much of the controversy can be provisionally obviated by regarding AOI as a single numerical predictor of DPA. This is a useful approach because both variables are straightforwardly knowable and measurable. However, AOI remains confounded with chronological age, which itself drives the schedule of the causal factors. In this sense, AOI may be regarded as summing over the collection of causal factors at each age. As such, it can provide a useful heuristic for estimating learners' chances of attaining a given level of proficiency in an L2, given the age at which they approach that language. What remains then is to elucidate the structure of the mapping between the initial AOIs and the ultimate DPAs (AOI–DPA) for the average L2 learner.
Many trace the first sketch of an AOI–DPA map to Lenneberg (1967) and his notion of a “critical period” for language acquisition. He characterized the AOI–DPA relationship as a discrete function, marking puberty (AOI ≅ 12) as the cutoff for attaining a native DPA. However, his comments on accent and age are no more than a brief aside from the thread of his monograph on the Biological Foundations of Language. Moreover, Lenneberg did not actually test this hypothesis behaviorally, but rather was informed by folk knowledge on accent and neurological evidence of precipitous pubertal changes. Since then, prodigious empirical research examining the AOI–DPA relationship has produced four major patterns: “constant ability,” “critical/sensitive period,” “linear decline,” and “sigmoid decline.” These are illustrated in Figure 1 and can be regarded as competing models.

The competing (idealized) models of the AOI–DPA relationship
One set of contentious results embodies a pattern of constant ability and claims that the potential for learning a language does not change with AOI. In this view there is no “real” difference in the outcomes between younger and older AOIs and all L2 learners retain the complete ability to achieve native accents (Figure 1, constant ability model; see Bongaerts, 1999; Bongaerts, van Summeren, Planken, & Schils, 1997; Moyer, 1999; Neufeld, 1977; Neufeld & Schneidermann, 1980). It explains some slight disparities between some older and younger learner data in favor of youth as a consequence of possible input differences and not learner ability. Some of this research even suggests a possible advantage for older learners, rejecting the common notion that “younger is better.” This model has the advantage of incorporating reports of late AOIs with native or nativelike pronunciation by diminishing the “inevitability” of maintaining an accent.
Another set of results embodies Lenneberg's notion of a single critical period, in showing that L2 acquisition outcome drops abruptly and irreversibly (Figure 1, critical period model; see David, 1985; Hyltenstam, 1992; Lenneberg, 1967; Patkowski, 1990; Ramsey & Wright, 1974; Scovel, 1969), although the reported ages have varied, as have the methods. That is, one's ability to achieve a native sounding accent takes a quantal plunge at some common juvenile age. The softer “sensitive period” variant put forth by Oyama (1979) claims a malleable period of potential L2 acquisition outcomes encased by beginning-lower and ending-upper bounds (Figure 1, sensitive period model). This model attempts to reconcile findings of different critical periods for different speakers, albeit within a fairly narrow range. With regard to the shape of the AOI–DPA relationship, the sensitive period model says little about the structure of what happens in between these limits, but implies a sudden drop in ability over a short span of years from “an interval of heightened responsiveness” (Oyama, 1979, p. 100) to a state of reduced sensitivity (Asher & Garcia, 1969; Long, 1990; Oyama, 1976; Tahta, Wood, & Loewenthal, 1981).
A third set of results favors a pattern of linear decline in L2 acquisition ability throughout the entire human life span of a single, monotonic, negative slope (Figure 1, linear decline model; see Bialystok & Hakuta, 1999; Birdsong, 1999a; Flege, Munro, & MacKay, 1995; Hyltenstam & Abrahamsson, 2000; Thompson, 1991). It is a major divergence from previous findings of discontinuous (critical period and sensitive period models) or absent change (linear decline) in DPA. An important issue of past studies that fit this model, however, is the failure to test age spans of significant length.
A final set of results favors a continuous sigmoid pattern of progressively shifting slope and final accent outcomes (Figure 1, sigmoid decline model; see Flege & Fletcher, 1992; Flege et al., 1999). Unlike the rival models, this sigmoid model is often described with likelihoods of outcome instead of “guarantees,” “inevitables,” or “ineluctables.” Expected DPA as well as tendencies to deviate from that expectation are estimated by the mean and standard deviation at each AOI. By combining the notion of a gradually evolving sigmoid pattern and probabilistic outcomes for DPA, the sigmoid model can be integrally profiled as (a) a brief initial period during which the predicted DPA is overwhelmingly native; (b) a longer period of linearly increasing deflection away from native wherein L2 learners, on average, are increasingly less likely to obtain their AOI-predicted DPA the later their AOI; and (c) a final period of maximal deflection from native for the expected DPA, but a minimal likelihood of obtaining the DPA that is predicted by AOI. It is important to note also that the transitions between periods are not sudden, but rather of a gradually changing slope. Figure 2 overlays the models so that these model patterns can be contrasted. Using the sigmoid model to generate a hypothetical population in Figure 3, one can see how it could be that, although competing models would account for a large part of this data and may in fact return significant results under analysis, only the sigmoid model would provide the best characterization and fit. The sigmoid model is a prosperous step forward in that it incorporates the notion that both average outcome and the likelihood of individual outcome evolve gradually and continuously, while explaining past conflicting results and retaining empirical evidence that there are certain “turning points[s]” (Lenneberg, 1967, p. 150) at which the AOI–DPA distribution alters its conformation.

An overlay of competing models. Lo and hi indicate AOI bounds for the sensitive period model; the upper area delimited by dashed lines indicates the native range

The hypothetical data distribution of the probabilistic sigmoid model. The global shape is sigmoidal over the entire AOI range, and the local shape is linear over AOI=3–16 range; the upper area delimited by dashed lines indicates the native range
Although AOI turning points have not yet been reliably identified, they can be estimated from previous studies of the critical period. In a widely cited review by Long (1990), AOIs 6 and 12 were concluded as capturing a crucial range for acquiring pronunciation for most learners, but were still guarded as fairly malleable bounds. More recent empirical findings that AOIs 3 and 15 appear to encapsulate a more inclusive range is further support for this additional buffer (Flege & Fletcher, 1992; Flege et al., 1995; Thompson, 1991). Three years appears to be the earliest AOI at which the likelihood of native speech begins to decay from its highest point, and 15 years seems to be about the latest AOI at which the likelihood of native speech probably reaches its lowest point.
Flege, Yeni–Komshian, and Liu (1999) and Newport, Bavelier, and Neville (2001) ask if the presence of turning points constitutes evidence for a critical (or sensitive) period. Traditional theories and evidence for a critical period have stipulated a more abrupt age-related change and more deterministic outcomes in performance. More recent evidence and theorizing have questioned this logic and attempted to reformulate a more empirically accurate and logically plausible representation of the critical period (Newport et al., 2001). In our view, the question as to what constitutes a realistic critical period model is premature; what is first needed is an accurate mathematical demarcation of the AOI–DPA relationship.
The “likelihoods” considered in the sigmoid model are not those often found in research that considers accent as binary: native or nonnative. Such studies measure the percentage of L2 learners who attain a native accent and those who do not at a given AOI. This percentage reflects the mean likelihood of success or failure at attaining a native sounding L2. For later AOIs at which a native accent is regarded as highly unlikely, it gives no sense of the distribution of the remaining bulk of the L2 accents. A binary approach made sense when the goal was to evaluate bimodal critical period models. However, evaluation of linear and sigmoid models requires an alternative, finely graded measure of L2 accentedness at each AOI that is commensurate with the gradual and continuous character of these functions.
Likelihood as it is used here refers to accent variability when AOI or speaker is held constant. Holding AOI fixed, we may find that individuals have different DPAs. This interspeaker variability may be regarded as the deviations of actual speaker accent ratings from their expected values based on a given model. If these differences are small for a given AOI, then there is little interspeaker variability. Holding speaker constant, a second form of variability appears within an individual when his or her utterances deviate from each other in apparent accent. Intraspeaker variability depends not on model fit, but rather is the difference of utterances from their speaker's mean accent. If all instances of speech for a speaker are homogeneously accented, then this value will approach zero. Interspeaker variability is an important measure of how well a model predicts real speakers' DPAs, whereas intraspeaker variability estimates the relative consistency of a given speaker's DPA and can also point to the existence of sampling effects due to sample duration or extemporaneity.
One aspect that the sigmoid decline model does share with its competitors is its conceptual and graphical perspective on accent. One could focus on accent as a positive “rising” quantity with native speakers as low in accent and foreigners as high. This makes certain intuitive sense in that one expects a speaker to be “more accented” as AOI increases. However, it provides no grounded reference point to compare speakers. Another perspective is to regard accent as a “falling” quantity in which case the native speakers are high in degree of native accent and foreigners are low. As seen from this view, increasing AOI produces speakers who sound less native and grounds measurements logically as distances from native controls. We have taken this falling perspective because it is consistent with the language surrounding the issue of L2 acquisition. However, this does open the question of what counts as native (to be discussed below).
The present study focuses on the association between AOI and perceived accent and the deviations from this association as a function of AOI. It is not a test of the case that AOI “causes” accent or failure to become native sounding (Johnson & Newport, 1989). AOI is tethered to such causal factors as neural plasticity, cognitive development, psychosocial state, and L2 context through the umbilical of chronological age and it is these that nurture or deprive L2 pronunciation success. AOI is a nonnutritive variable with regard to accent. However, AOI accounts for too much of the variance, much more than any other variable, and it would be too hasty to call it “junk food” just yet. This is especially true considering the lack of any better predictor of L2 performance to be found in the prodigious amount of L2 acquisition research. Therefore, it may be healthier to constrain our conception of this statistically powerful predictor variable and to recognize its interpretational limitations. A better understanding of the development of DPA along AOI may provide future inlets into which more effective investigations into the causal factors may be explored.
OTHER RELEVANT CONTROVERSIES
The controversy in the literature concerning L2 acquisition, ages, and accents is not limited to the notion that “correlation does not imply causation.” Nor does it stop at the appropriate shape for an AOI–DPA link. There continues to be disagreement on several other important issues that are relevant to this study. Because many of our premises depend on them, we therefore clarify our interpretation of and stance on these issues.
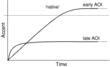
A first matter concerns ultimate attainment in an L2. After how much time spent learning an L2 can one conclude that a learner will no longer make significant improvements? In addition, lingering questions about the characterization of this time frame motivate a need to distinguish long-term “level of ultimate attainment” and short-term “rate of acquisition” advantages for younger and older learners, respectively (Krashen, Long, & Scarcella, 1979; Krashen, Scarcella, & Long, 1982; Slavoff & Johnson, 1995). Figure 4 shows an idealized progression from no L2 ability (i.e., an initial “least native” point of 0) for both an early and a late AOI learner. Both learners are displayed side by side as if they were beginning acquisition at the same point in time (t=0), and it is their differential progressions (rate, time to asymptote, and ultimate asymptote) in their acquisition of the L2 that are plotted. This is quite different from the model plots (Figures 1 and 2) that have speakers aligned with their differential AOI (not a common t=0 point) and collapses entirely the evolutions of their progression in the L2, plotting only individuals' ultimate level of attainment. Assuming that there is a range of learner AOIs between the two extremes of Figure 3, the models would then appear as interpolations of those asymptotic points creating the variously structured models. Thus, recalling that in the present study we are only interested in drawing a relationship between AOI and asymptotic DPA, we need to identify a minimal length of immersion necessary for ultimate attainment. Although studies vary on the minimal requisite time for all learners to achieve asymptote, reviews by Long (1990) and Piske et al. (2001) hover around 1–3 years depending on the study, although 3 years appears to be the more inclusive estimate. To be conservative, we consider an additional buffer of 2 years and thus a cutoff of 5 years appropriate to safely assume asymptote. Setting a minimum length of immersion is an important prerequisite in order to appropriately fit the AOI–DPA relationship with a model.

The trade-off between short- and long-term advantages. There is rapid but limited acquisition for late learners and slower but more complete acquisition for early learners
A second matter is the question as to what counts as a native accent (Hyltenstam & Abrahamsson, 2000; White & Genesee, 1996). Are L2 learners only capable of nativelike or nearly native accents because they were not by definition learners from the time of nativity (birth)? Can L2 learners always be distinguished from true native speakers by the highly trained ear or silicon chip? These larger questions aside, distinguishing native from its approximants is of particular importance to measuring DPA. Such a nuanced distinction requires a continuous measure that returns very finely graded values. It also requires that those making ratings be provided with a native anchor so that they have a common, firmly grounded benchmark against which to rate.
A third matter is that the study of L2 acquisition is the study of bilinguals. Research into “multicompetence” would assert that consideration be given to a speaker's L1 and L2 DPAs (Bley–Vroman, 1989; Cook, 1995; Felix, 1985; Magiste, 1979; Major, 1992). That is because languages may interfere with each other in the cognitive system, and performing well in one language may preclude performing well in the other as can be seen in titles such as “Losing English as a first language” (Major, 1992). For example, one can imagine two speakers with equal AOIs who upon testing are determined to have differing L2 DPAs. It is not known whether they both maintain equal L1 DPAs and underwent dissimilar interference between their two languages, whether they underwent similar interference but had started with unequal L1 DPAs, whether one of them improved L2 DPA more significantly than the other but at the cost of L1 DPA, and so forth. This is an important contention, and it may become important to assess speakers' L1 DPA in order to correctly understand the relationship between their AOI and L2 DPA. That said, although important, this issue will not be considered in this study for several reasons: (a) it is not certain in what way and to what extent languages do in fact interfere with each other, (b) it is uncertain whether this is similar for any arbitrary set of languages or (c) group of people, and (d) “interference” enters into the category of “causal factors” that this study explicitly debars.
KEY FEATURES OF THE RESEARCH DESIGN
Hyltenstam and Abrahamsson (2000) have suggested that the vagaries of prior research into L2 acquisition reflect four major problems. These include lack of explicit hypotheses, insufficiently sensitive research instruments, conceptual elusiveness, and ideological loading (p. 151). In the present study we attempt to avoid each of these problems in the following ways.
We have explicitly stated our hypotheses and predictions, and we use mathematical models that carry with them testable and rejectable distributions. We improve upon instrument sensitivity and reliability, we employ a moderately sized panel of 14 raters, we attempt to overcome human factors (such as fatigue) by having multiple sessions, and we include measures of consistency within and across sessions. We use well-defined endpoints and finely grade and ground our measurements by employing a continuous scale of DPA to provide ratings of accent and a native anchor against which to measure. Because there is no consensus as to the “best” sampling type (Piske et al., 2001) that can serve as a research instrument, we include speech samples of differing duration and extemporization and attempt to identify the most effective.
We restrain our modeling to clearly defined and measurable concepts. AOI is “the age at which a person becomes immersed in and begins to become a speaker of a second language.” DPA is “the relative degree of accent that a rater perceives in a token and hence its speaker.” DPA is not a measure of accent in any real sense; rather, it is a quantum that expresses accent as it occurs in the perceptual system of a listener. We explicitly state the “correlated,” not “causal,” nature in which we relate our two variables, AOI–DPA. Last, we focus upon a single L1–L2 population to avoid artifacts that can result from comparing more than one language pair. We leave it to other research to compare among languages (Delamere, 1996; Major, 1987b, 1998).
By identifying and setting aside notions that are of ideological value, most notably those that carry notions of “nature versus nurture” and their sociopolitical implications, we open up an avenue by which we may make dispassionate conclusions purely on mathematical grounds.
QUESTIONS AND HYPOTHESES
There are four questions of focal concern in this study, each of which is summarized below along with a hypothesis based on the considerations outlined above.
Question 1: Rater reliability
Can raters be consistent with their ratings over time? No effects of fatigue or rater differences have been reported in past research; we propose that that there will be no differences for the method we employ.
Question 2: Model comparison
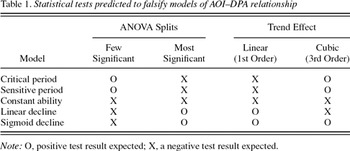
Which of the models is the best fit for the data? Based on the fact that the sigmoid decline model is a more natural fit to maturational functions having no subitaneous (critical and sensitive period), monotonic (linear decline), or nonexistent (constant ability) changes in performance, as well as the results from Flege and Fletcher (1992) and Flege et al. (1999), we predict that a sigmoid function will not be rejected when tested against the competing models. However, given the span of AOIs (3–16) that we wish to examine, a linear trend should be the best fit for this range (see Figure 3). We inventory the exact statistical predictions for analyses of variance, linear trend, and cubic trend in Table 1. The hypothetical population of Figure 3 shows what a cubic trend over the entire span as well as a linear fit on the investigated range plots should look like.

Question 3: Sigmoid model particulars
How well does the sigmoid mode account for inter- and intraspeaker variability and is there an effect of gender? Based on the probabilistic nature of the sigmoid model we predict that both inter- and intraspeaker variability will increase linearly with increasing AOI for the 3–16 age range. Because this model has only a single predictor variable (AOI) of accent (DPA), there are no formally predicted gender differences. However, because gender is commonly considered an important L2 acquisition factor and given that it is both well defined and measurable, we investigate it here.
Question 4: Sampling effects
Do sample length or sample extemporaneity affect DPA? Longer samples present greater amounts of information where extemporaneous samples can allow speakers to avoid problematic aspects of pronunciation (Oyama, 1976; Piske et al., 2001; Thompson, 1991). We therefore predict a durational effect in which mean DPA and/or variability increase with length (words<sentences<paragraph) but decrease with extemporaneity (picture narration<scripted paragraph).
METHODS
Participants
Two groups of participants were included in this study, 42 who provided speech samples and 14 who served as raters of DPA. All were recruited from the Human Subjects Pool of the University of California at Irvine under IRB Approval 2001-1956 and given extra credit for course work. A linguistic background questionnaire was administered to participants of both sections of the study upon recruitment. This data was used as a basis for inclusion and to assess the qualifying and confounding variables, as well as the predictor variables of interest. Based on these data, populations were balanced for gender and, if relevant, AOI. The participants who provided speech samples were 37 Mandarin speakers for whom English is an L2 of which 32 were used in the experiment proper, 2 in training raters, and 3 in the reliability assessment. Mandarin was chosen because it is less frequently studied in the literature and the local college student body afforded a relatively large subject pool of native speakers who varied in AOI. Recruitment flyers asked for native speakers of Mandarin Chinese who began learning English in the United States between ages 3 and 16, who have never had a speech impairment or delay, and who are literate in English. To control for level of attainment and additional language confounds, only those participants who had a length of immersion ≥5 consecutive years in the United States and who had Mandarin/English as their L1/L2 were included. The mean length of immersion was of 11.6 years, the standard deviation was 3.2, and the range was 6–19 years. As controls for establishing the endpoint values for most native accent, the participants further included 5 monolingual, native speakers of American English, 4 for the experiment proper and 1 for reliability assessment. In this case the recruitment flyer requested native, monolingual speakers of American English with no marked regional or dialectical accent and no prior speech impairment or delay and who are literate in English.
The participants who comprised the DPA rating portion of the study included a further 14 native speakers of American English. In this case participation was restricted to native, monolingual speakers of American English who have not had extensive contact with Chinese languages/dialects or its speakers and who have never had a speech impairment or delay or any form of hearing loss or dysfunction.
Materials
All speakers provided four types of speech samples. Three of these were prescripted samples that differed in duration: single words, sentences, and a short paragraph. The fourth type of sample was a picture narration used to produce an extemporaneous speech sample of a duration and structure comparable to the prescripted paragraph. Although the picture narration allows speakers to avoid pronunciations they find difficult and speak in a more comfortable style, it is more likely to contain syntactic errors and word choice and stylistic differences between speakers that may exacerbate assessments of accent. For this reason, we directed raters to ignore all nonphonological speech content and assess only the perceived accent at the segmental and suprasegmental levels.
The materials used to collect speech samples were partly inspired by Rogers and Dalby's (1995; Rogers, 1997) investigation of English phonemes and phoneme clusters that pose a problem for Mandarin Chinese learners. They appear in Appendix A and Appendix B. The written sampling materials contained a wide range of English prosody patterns at the single word, sentence, and paragraph level and maximized the occurrence of phonemes that would pose a problem for Mandarin speakers. A total of 30 contrast pairs of words and 16 sentences were collected. These contained problem phonemes and their word positions (initial, medial, final) and a subset of the Harvard Sentences (IEEE Subcommittee on Subjective Measurements, 1969) that contained instances of these problematic features. The written paragraph was an extract from “The Rainbow Passage” (Fairbanks, 1940) as modified by Rogers and Dalby (1995) to replace unfamiliar words with higher frequency ones. It matched the expected duration of the picture narration, which used as its sampling material a clipart representation of a situation that all speakers would recognize, be familiar with, and not require jargon words to explain (e.g., a stressed man answering the phone at his cluttered desk). No scene (even a natural one) is devoid of cultural contexts. Nevertheless, all participants' narrations proved quite similar and all identified and described the scene accurately.
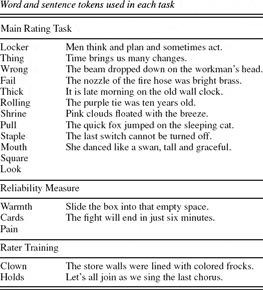
Although recordings of all types and tokens of the speech samples were collected from all speakers, not all word and sentence tokens were included in the final rating procedure. Some were used to train participants on the rating procedure, while others were used in the reliability measure. Several had to be discarded to trim down the duration of the rating task or because of ambient noise in the recordings. Each word and sentence was randomly assigned to its task. The final counts for the main rating task were 12 words, 10 sentences, 1 read paragraph, and 1 spontaneous paragraph. The reliability measure was the same scheme but employed only 3 words and 2 sentences. Likewise, the identical rater training scheme employed only 2 words and 2 sentences. Appendix A organizes the words and sentences by task usage.
Procedures for collecting speech samples
Collection
The procedure for collecting the speech samples was the same for all speakers. Participants first filled out the two-page linguistic background questionnaire and were then seated at a computer. The program was designed to run autonomously so that participants would feel more relaxed and not as if an experimenter were testing them. Audio was sampled at a rate of 44.1 kHz to prevent any aliasing and was stored under the WAV format with no peak clipping.
Collection was done in blocks of sampling type and their order randomized. Runs of words and sentences were also randomized. Participants were allowed to control their pace from run to run; however, once a run was started the recording duration was limited to 2 s for words, 5 s for sentences, and 30 s each for the paragraph and picture narration. After recording a sample, participants were offered the option to proceed to the next or redo the current one if they felt that they had “messed up the recording” (e.g., by coughing, sneezing, dropping something, etc.). Participants were not allowed to listen to the recordings of their utterances and samples, other than the one just recorded, and could not be revisited. Special instructions for the picture narration instructed participants to imagine an appropriate narrative for the scene and to take as much time as they needed to prepare their thoughts, but not to write them down.
Preparation
In order to achieve optimal conditions for the rating task, the speech samples were screened for ambient noises (coughing, chair movement, etc.) and recording errors (speakers speaking too early/late causing clipping). Dead air that preceded and followed the speech samples was eliminated in order to alleviate demands on energy and attention while rating. Samples were scaled to an arbitrary reference volume so as to eliminate speaker identification by volume and assessments unrelated to accent. This did not alter signal noise by a noticeable degree.
Rating DPA
Rating scale
Raters assessed accent by clicking on a continuous vertical scale with a mouse pointer. The scale spanned a 10-cm bar anchored with the words Most Accented and 100% Native. Numerical values were not marked on the bar but for the purpose of analysis the mouse clicks were coded into a 0.00–400.00 point scale with 400 representing the most native accent. These numerical values have no inherent significance except to allow for a wide range and high resolution; it is the relative difference between ratings and their variance that is of interest here. Before each rating, the mouse pointer automatically returned to a neutral point to the side of the rating bar to assure that rating was unbiased by pointer position on each trial. Several studies have used a continuous scale (Flege, 1988; Flege & Fletcher, 1992; Flege et al., 1995) and have found this method to be reliable. Additional research by Southwood and Flege (1999) found the perception of accents to be a metathetic continuum, and therefore the values derived from the continuous measure were assumed to be representative of equal intervals.
Presentation of samples
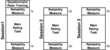
The rating of stimuli was broken over three 1-hr sessions completed on separate days. It was thought that by breaking the session up into less demanding chunks, raters would be more reliable between the first and the last samples they rated. The linguistic background questionnaire and a short rating procedures task were given at the beginning of the first session, and each session was started and ended with the reliability measure task (Figure 5). The different sample types were broken up so that the main rating task of each session contained: only words, only sentences, or the short paragraph and picture narration. These last two, although appearing on the same day, were presented in separate blocks. Sampling types were not intermixed to mitigate bias.

The organization of sessions
The sampling types were organized by Latin square to balance ordering effects. This was done across sessions for the main rating task and within both the start and end reliability measures for each session. The scripted paragraph and picture narration, although combined on the same day, were balanced for order. Finally, runs within each sampling type, including sampling tokens and individual speakers, were randomized.
At the start of the first session raters were instructed to focus only on phonological aspects of speech and to ignore extraneous speech irregularities or errors. They were given a brief explanation of phonological accent at the segmental and suprasegmental levels as well as a few examples. This was explained with colloquial language and illustrative examples. Additionally, measures were taken to ensure that raters understood these instructions. The instructions were repeated at the start of each session. Raters were trained on the accent endpoints during the very first reliability assessment, although that was not its real intention. The reliability assessment included one native and one heavily accented speaker, along with two speakers in between these points. There were no exemplars of rating endpoints in the training per se, but, again, that was not the aim of training. It was only supposed to help participants get familiar with the computer environment, task procedures, and sampling types. However, exemplars of the endpoints were present in the reliability assessment, the focus of which was the perception of the accent space.
Samples were played through speakers located in front of the rater and the volume was preset to an average of 60-dB SPL to replicate natural speech conditions. Participants were able to simultaneously view the target sample phrase or picture while it was played so they could compare what they heard with what was intended. Once the sample was completed, raters marked the sample DPA and were asked to confirm their rating in order to prevent erroneous marks. If confirmed, raters advanced to the next sample; if declined, they were allowed to mark their rating again, but not to hear it a second time.
ANALYSIS AND RESULTS
Rater consistency
Measuring reliability
The logical and statistical analysis of the data depends on the raters' ability to produce reliable data. A series of repeated-measures analyses on the reliability measure data looked at group and individual rater behavior, grouping measurements as all around (1s–1e–2s–2e–3s–3e), across sessions (1s–2s–3s | 1e–2e–3e), and within sessions (1s–1e | 2s–1e | 3s–3e). Failure to find an effect would indicate unchanged rating behavior in that grouping. Analyzing the all-around reliability revealed a mildly significant effect, F (4.63, 26536.28)=2.38, p=.041, adjusting by Greenhouse–Geisser ê. There was no linear or quadratic effect; however, a barely significant third-order effect, F (1,391)=3.94, p=.048 was found. This suggests that dividing the rating task into two sessions probably had minimal effects. A subsequent across-sessions analysis produced no significant effect, F (1.98,1550.33)=1.279, p=.278, again adjusting with Greenhouse–Geisser, and no significant first- or second-order structure. The final within-sessions analysis looking at session start to end changes produced no effect either, F (1,2726.85)=1.277, p=.259, also adjusted by Greenhouse–Geisser.
Having found that raters were collectively consistent within and across sessions, individual rater behavior was next examined with the result that not all raters were equally congruous. Six of the 14 raters had no significant differences on any of the three bracketings. Two of the remaining 8 raters had very slight and restricted differences that were just marginally significant (p=0.049 and 0.046) on only one test. The remaining 6 raters obtained more than one significant grouping. To further investigate these results, the six reliability measures were plotted for each rater. Upon visual inspection it was clear that there were also pattern inconsistencies between raters by which they could be grouped. Some raters were very consistent over time, but did not make use of the full range of DPA ratings. Conversely, other raters made wide use of the entire DPA range over the rating bar, but had several minor fluctuations per sampling over time. A few remaining raters filled in the range between these two complementary methods of rating. That is, there appeared to be a trade-off between temporal consistency and spectral variability in ratings of DPA. Those raters who were more consistent by rating in a bimodal manner were more likely to render statistically significant changes in the repeated-measures analysis due to the greater sensitivity of the test over the reduced variance. Conversely, those raters who were less consistent over time, but who made more finely resolved distinctions in ratings, were less likely to produce statistically significant changes over time owing to the repeated-measures reduced sensitivity to deviations amid the augmented variance. Given that temporal consistency and spectral variability in ratings are both desirable traits, it was decided that no raters should be discarded. Instead, the main rating task data were transformed to clean up artifacts tied to individual rater tendencies and variance.
Transforming the data
A “rater-specific” z transformation was first performed utilizing individual rater means and standard deviations to reduce differences in the data resulting from individual rater tendencies. A second, rater-session specific z transformation was also performed on the raw data using session means and standard deviations for each rater to reduce any fluctuating tendency across sessions.
All analyses were conducted on the raw and transformed data to compare effects. The rater-specific transformation affected the magnitude of results of the subsequent analyses of the data, but not the pattern of significance (all ps<.000). The rater-session specific transformation had little effect on the numerical results and none on the overall results. This lack of effect when session was included is further support that cross-session rater reliability is fairly high and that most of the variability in the reliability measure is tied to differences in individual rater behaviors, not the three-session paradigm. Consequently, only the rater-specific transformed data are reported in the Analysis and Results.
We recognize that the sample types were unequally represented in performing our analyses: each speaker was rated on 12 words and 10 sentences, but only 1 paragraph and 1 picture narration. Thus, we attempted to weight samples with respect to the sample type frequency during the overall analysis. Although this slightly exaggerated the numerical results, it did not change the overall observations or conclusion. We note that this weighting procedure is not the equivalent of having an equal number of each sample type; consequently, the sample-frequency weighted results are not reported further.
Model comparison
Testing the predictions
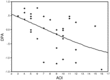
In accordance with Table 1, a first attempt to search for a single or multiple critical periods was performed through a series of analyses of variance (ANOVAs) that split the population at each of the sampled AOIs. No subset of critical AOIs was found. Instead, highly significant (p<.000) differences in accent ratings were found for all possible population splits of the range. Next, a linear regression of the entire 3–16 AOI range revealed a highly significant linear trend, F (1,10750)=1355.57, p<.000, represented by ŷ=(-0.103)x+(0.775)+ε. Finally, a cubic trend was tested in this AOI range and was also found to be statistically significant at F (3,10748)=504.10, p<.000, although to a weaker degree than the first-order trend, as can be seen in Figure 6. This dominating linearity was to be expected, given the AOI range of 3–16. Given the results of these tests and the table of statistical predictions set up in the hypotheses, all other models had to be rejected in favor of the sigmoid model.

Speaker means with third-order effects. Linearity over AOI=3–16 range dominates over the third-order effect
The sigmoid as a possible epiphenomenon
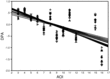
It could be the case that each rater is perceiving and rating an AOI-based bimodal distribution such as would be predicted by divaricate models: early AOIs would have a uniformly high native rating, late AOIs a uniformly low one, and little or no intermediary population. If so, all 14 rater bimodals would average together to cumulatively approximate a group sigmoid pattern, each having its center slightly shifted due to inherent rater perceptual differences and error. To test the possibility that the sigmoid is an epiphenomenon of rater differences, we examined the AOI–DPA for each individual rater and found a highly significant linear trend for each rater (p<.000 for all raters) with approximately equal slope (Figure 7). What is more, a similar third-order analysis revealed a unanimous cubic trend (p<.000 for all raters). Although raters vary in the size of their first- and third-order effects, as expressed by their F values, all these effects are on the same order on a rater by rater basis, indicated by their similar first- and third-order F ratios (Table 2). Consequently, the overall linear and cubic trends can be considered quite robust being as true of individual raters as of the group.

The AOI means with the first-order effect by rater

Sigmoid decline model
Speaker variability
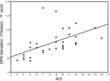
Having found linear and cubic decreases in native ratings of DPA with AOI on the 3–16 range as predicted by the sigmoid model, the next step is to investigate variations between and within speakers as a function of AOI. Recall that the interspeaker variance is borne out as deviations of speaker utterances from the model predictions and the intraspeaker variance is evidenced in the deviations of speaker utterances from their own mean DPA. To test interspeaker variability, we calculated the distance between the DPA for each token utterance and the corresponding AOI-group-mean DPA value (normed difference: |ytoken-

AOI|) and then fit these with a linear trend along AOI. It was found that speakers' DPAs were increasingly more likely to deviate from their predicted DPA with increases in AOI and that these deviations expand linearly with AOI: F (1,10750)=500.36, p<.000 and ŷ=(0.031)x+(0.552)+ε (Figure 8). Thus, individual speakers have an increasing likelihood of obtaining a DPA value other than the one predicted from their AOI and this probability amplifies linearly with AOI.

The interspeaker variability
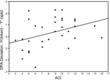
An analogous operation was performed with respect to intraspeaker variability. We calculated the distance between the DPA for each token utterance and the speaker-mean DPA corresponding to it (normed difference: | ytoken-
spk|) and then fit these with a linear trend along AOI. Again, we found a highly significant linear effect, F (1,10750)=103.89, p<.000, taking the form ŷ=(0.014)x+(0.512)+ε (Figure 9). In comparing the inter- to intraspeaker variability, it is important to note the different magnitudes and ranges as marked by their different ordinate axes. Thus, individual speakers are more likely to demonstrate variably accented speech (either in magnitude of difference or in frequency of occurrence) with increasing AOI.

The intraspeaker variability
Gender differences
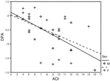
With respect to gender differences, we found males to produce statistically less native ratings of accentedness than females, F (1,10733)=196.11, p<.000, but there was a significant interaction between this effect and AOI, F (6,10733)=220.10, p<.000. We therefore decided to test the effect of AOI separately for males and females and discovered that the ratings of female DPA, F (1,5710)=545.55, p<.000, b1=-0.092, dropped less steeply than that of males, F (1,5038)=875.37, p<.000, b1=-0.116.
Examining gender-linked variance between speakers we also found females to be more variable than males, F (1,10750)=115.74, p<.000, along AOI. The interspeaker variability is roughly equal for early AOIs, but increases more rapidly for females, F (1,5710)=381.74, p<.000, b1=0.037, compared to males, F (1,5038)=141.57, p<.000, b1=0.024. In contrast, intraspeaker variance is greater among males than females, F (1,10750)=77.76, p<.000. Intraspeaker variability along AOI also starts with less variability in females, F (1,5710)=118.98, p<.000, b0=0.422, b1=0.021, than males, F (1,5038)=9.24, p=.002, b0=0.621, b1=0.006, but this disparity closes with AOI (Figure 10).

Linear trends by gender
Sampling patterns
Comparing sampling effects
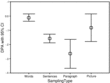
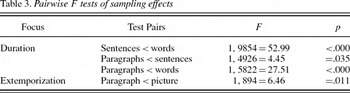
To examine the effects of employing durationally and extemporaneously varying sampling types we first calculated the mean values and 95% confidence intervals for each type of sample, ignoring AOI (Figure 11). This indicated important differences in DPA means and variances. The relative duration of the sample associates with mean DPA “nativeness” are paragraphs are the least native, followed by sentences, and then words. Pairwise ANOVAs all had highly statistically significant differences (Table 3): the longer the sample type length, the less native the mean DPA rating. Conversely, the more extemporaneous the sampling type, the more native the mean DPA rating: picture narration ratings were more nativelike than scripted paragraph ratings (Table 3).

Sampling means with error bars

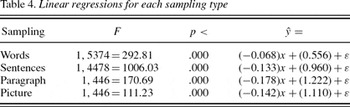
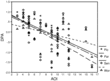
Incorporating AOI into these comparisons, we found highly significant linear trends for each of the four sample types (Table 4), although the slopes differed in important ways. Words yielded a much flatter slope than either of the other three as evidenced in Figure 12. Scripted paragraphs can be further separated from the remaining three by a notably steeper slope, although this difference is less remarkable than that of the words condition. The sentences and picture narration conditions hardly differ in slope or intercept.


Sampling-type linear trends
Reexamining the sigmoid for sampling effects
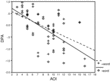
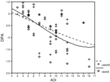
Given that words appear to overestimate DPA nativeness globally, effectively nullifying AOI, we decided to reconsider the effects of this condition on the sigmoid model results. We reported an earlier linear effect of F (1,10750)=1355.57, p<.000, with a slope of b1=-0.103. Removing the words condition from this analysis did not increase the effect size, F (1,5374)=1277.20, p<.000, but did change the slope (b1=-0.138) markedly (Figure 13). Similarly, the earlier cubic result, F (3,10748)=504.1, p<.000, was not noticeably enlarged by removing the words condition from the analysis, F (3,5372)=493.12, p<.000; however, a more conspicuous curvature emerged in the sigmoid (Figure 14).

Speaker means with first-order effect (±) word sampling. There is increased AOI effect without accent neutralizing the effect of words

Speaker means with third-order effect (±) word sampling. There is increased curvilinear effect without accent neutralizing the effect of words
DISCUSSION
Considering the results
Although the data support the superior fit of the sigmoid model over the three competing models, because of the restricted AOI range the linear trend dominated over any cubic curvature. However, had the sampled AOI range been broader the sigmoid shape might have been more prominent in the data. Thus, finding a significant third-order effect on the examined AOI range of 3–16 can still be considered support for a larger, likely more prominent, sigmoid pattern over an expanded AOI range.
Whatever the final shape of the function, it only predicts the expected and hence most likely DPA for a given AOI. Both inter- and intraspeaker variabilities increase with AOI, implying that expected DPAs become increasing less representative of actual speakers and their utterances, the later a speaker is immersed. Thus, although the model predicts accents farther from native for later AOIs, this variability always allows for the possibility that native sounding DPAs can occur at late AOIs; however, such an event becomes increasingly less likely. These findings concerning the AOI–DPA trend and variability, although diverging with some previous findings, maintain at least the commonly held view that “earlier is better.”
The lack of a sharp gender effect indicates that males and females likely go through the same developmental time course with respect to accent. Thus, the onset of puberty, for example, does not seem a critical factor in DPA, else females should have shown an earlier time course. However, collimating all the results for analyses of gender, it becomes clear that interspeaker variability is the most important, itself a consequential result, as well as illuminating issues of main effect. Although we report a nominal effect of gender due to a significant interaction, this result appears to depend upon this rather large gender-linked difference in variance.
With regard to instrumental biases, we have found that subtle sampling effects can confound the measurement of perceived nativeness. The use of single words appears to overestimate speakers' abilities at L2 pronunciation and to wash out effects. Thus, longer materials may be the best method of elicitation as they more accurately probe speakers' accents and are durationally more representative of how people communicate. However, the picture narration, although a more natural form of speech, allows speakers to temporarily circumlocute their problem areas and may allow the introduction of morphosyntactic influences on rating that may interfere with assessments of purely phonological accent. The only visible pitfall of these two longer sampling types is that from a practical standpoint they may allow fewer trials, reducing statistical power. Thus, with regard to the selection of materials along durational lines, there appears to be an important trade-off with both methods offering potential statistical advantages. On the one hand, utilizing shorter speech samples allows for the collection of more data points. On the other hand, utilizing longer speech samples allows for more informational cues to assess speaker accent, increasing rating, and therefore data, accuracy. It seems sentences occupy the middle ground, offering a large number of runs but sufficient duration for higher accuracy. Extemporaneity appears to have trade-off as well between uniformity and realism of the speech sample. This issue is partially mitigated by finding little difference between these two sampling types. It is further attenuated by the fact that sentences appear to offer the best tool for assessment of accent. Whatever the case, given the unequal number of sampling types for each durational type, future investigations should consider more even counts for each type in their designs as that choice may allow for more meaningful results and productive comparisons. Likewise, tacit differences between ad lib and scripted speech also makes comparison less meaningful.
Although increasing sampling types duration or number might increase fatigue and skew results, it appears that dividing over multiple sessions is a suitable solution following from the collective reliability measure results. Although there was larger rater variability tied to individual differences and not the three-session paradigm, this could be the result of important perceptual differences and not simply an innocuous artifact of the rating procedure. If the dichotomous rating strategies of “temporal consistency” and “spatial variability” run the deeper route and give meaning to the precept that accent is in the ear of the beholder, this could call into question certain aspects of mode fit as well as sources of AOI dependent variability. Transforming the data on the basis of individual rater tendencies appears to be an effective remedy for now.
Future directions
The findings in this study immediately generate several avenues of useful future investigation. One first important direction is to cultivate the model. Although we have found very strong statistical success with this initial approach, there are several directions for betterment. First, the current distribution is restricted to the 3–16 AOI range and is fit with a relatively small population size. Consequently, an immediate future direction would be to extend the range and/or flesh out the mass of the distribution with a larger study. Second, another possible step would involve finding a more appropriate, better fitting model, such as the Gompertz–Makeham (Flege et al., 1999), an exponential model frequently used when describing ontogenetic processes. An improvement keeping with the current model could be to incorporate additional predictor variables so as to perhaps account for more of the variance. Third, another possible step may be to test the assumption that DPA is normally distributional across individuals at each AOI. There may possibly be a ceiling effect for earlier AOIs. Fourth, it is not clear whether all raters perceive accent as a continuum or with the same range. Despite Southwood and Flege's (1999) finding that the rating of accents is metathetic in nature, hints of a possible failure of this assumption are visible in our earlier reliability measure results. Thus, it may be interesting to find a more appropriate way of pooling raters, instead of just averaging over them.
Tweaking the model requires, of course, dependable data to constrain it. Finding a neutralizing effect of words and maximal DPA accentuation with paragraphs poses an array of questions. Are durational effects additive: is the whole of a sentence or paragraph more than the sum of the constituent words or sentences? It is uncertain that appending more phonemes or words to a sample truly adds more accent in a linear manner. It may, in fact, take an exponential shape, decaying rapidly after only a few elements. Alternatively, what distinguishes words from sentences from paragraphs could be their differential nonadditive suprasegmentals. This is an especially interesting question for the L1-Mandarin population, given the significance of syllable-level prosody in that language. Sampling effects also occurred when comparing read material to spontaneous utterances of dissimilar lexica. Thus, a spontaneously generated narration of a scene using a list of keywords could be compared with a scripted paragraph containing the same keywords. The question of sampling still remains highly relevant if the model is to be accurately fit and used for reliable predictions.
Knowing the shape of the DPA distribution for an L2 speaker's production may also be followed up by investigating the L2 speaker's perception of accent. The question remains whether the function of accent perception in nonnative speakers would take the same sigmoid form that we have documented for production. It may be particularly interesting to investigate how these perception and production functions overlap and differ along AOI, both in expected DPA and probability of outcomes. One might, for example, test whether the ability to perceive the phonological space of an L2 does in fact equal or exceed one's ability to produce it and whether the two abilities show parallel fluctuations with AOI. It need not be the case that both production and perception of accent are two sides of the same coin.
Some research has found that it is possible to use a computational–analytical technique to model native accented speech and consequently detect very subtle deviations from these reference parameters (Gerrat & Kreiman, 2001; Major, 1987a). These measurements can be more sensitive to deviations from native than those by human listeners. These data could then be used to model a more reliable AOI-based function of phonation that was unaffected by the artifacts of human raters. Replicating the relationship between AOI and accent through physical and objective analysis may help to yield nuances of production that have their origins outside the domain of perception.
The present study has limited itself to degree of phonological nativeness in one population of English as an L2 individuals. The success of the sigmoid model in this limited case now raises two related areas of possible examination or application. One would be to generalize to other linguistic L1–L2 pairs to test its robustness, an obvious step. Another would be to apply it to higher linguistic levels to test its transferability. There is cause to believe that there are effects of AOI for performance at other linguistic levels: or, morphology, syntax, semantics, and so forth. There is substantial evidence for a claim of “morphosyntactic accent” among L2 speaker populations (Ioup, 1984; Johnson & Newport, 1989; Patkowski, 1990; for reviews see Harley & Wang, 1997; Long, 1990). Writing samples from nonnative speakers reveal characteristic patterns of omissions of articles, confusions of gender, and the dropping of pronouns that suggest this to be true. In any case, an issue for investigation is whether the sigmoid model has applications across language pairs and linguistic levels.
As the replicability, generalizability, and transferability of AOI effects become known, it should be possible to go beyond AOI to perform a more productive examination of causal factors that exist within subranges of ages, perhaps understanding why some learners are propelled toward native and others the opposite direction. On the more applied front, this approach may illuminate the optimal points at which to concentrate educational energies. With additional research into the L2 acquisition factors at each age, pedagogic strategies and efforts can be more accurately tailored to overcome the most inhibiting factors and bolster facilitating ones.
CONCLUSION
Variability is as much a part of L2 acquisition as is regularity. No model of an age–accent connection should ever hope to claim “before age X, a person is guaranteed to develop a native accent and, after age Y, a foreign accent is unavoidable.” In reality, DPA is being pushed and pulled at each AOI by a multitude of factors, providing for myriad accent nuances. These factors, neurological and psychosocial, cognitive and contextual, are constantly changing for every change in AOI and varying for every person, creating increasing inter- and intraspeaker variabilities. They may be sufficient to push a late-L2 learner in with the natives or possibly even give an early-L2 learner an accent. All told, within this tumultuous mix of factors, AOI appears to provide an effective, ideologically noncontentious heuristic for forecasting a speaker's ultimate accent. The AOI–DPA function, although heavily linear on a restricted range, seems to be globally sigmoid. Gender does not conclusively seem to offer a secondary predictor variable for DPA; however, this appears to be due to gender-linked differences in variance. Sentences appear to be the ideal sampling choice, offering the heterozygous advantage of small rating bias, yet large trial repeatability. Finally, fracturing rating over several periods has relatively little effect when compared to the variance of individual rater strategy.
APPENDIX A

APPENDIX B
Scripted paragraph and picture used to elicit extemporaneous speech

ACKNOWLEDGMENTS
This work benefited from the assistance of Maia Cook and Zheng Bian and discussions with Mark Steyvers.
References
Asher J., &
Garcia R.
1969.
The optimal age to learn a foreign language.
Modern Language Journal,
53,
334–
341.Google Scholar
Bialystok E., &
Hakuta K.
1999.
Confounded age: Linguistic and cognitive factors in age differences for second language acquisition.
In D. Birdsong (Ed.),
Second language acquisition and the critical period hypothesis
(pp. 161–
181).
Mahwah, NJ:
Erlbaum.
Birdsong D.
1999a.
Why and why nots of the critical period hypothesis for second language acquisition.
In D. Birdsong (Ed.),
Second language acquisition and the critical period hypothesis
(pp. 1–
22).
Mahwah, NJ:
Erlbaum.
Birdsong D. (Ed.).
1999b.
Second language acquisition and the critical period hypothesis.
Mahwah, NJ:
Erlbaum.
Bley–Vroman R.
1989.
What is the logical problem of foreign language learning?
In S. Gass &
J. Schachter (Eds.),
Linguistic perspectives on second language acquisition
(pp. 41–
68).
Cambridge:
Cambridge University Press.
Bongaerts T.
1999, August.
Native-likeness of pronunciation in naturalistic post-critical period second language acquisition.
Paper presented at the 12th World AILA Congress,
Tokyo.
Bongaerts T.,
van Summeren C.,
Planken B., &
Schils E.
1997.
Age and ultimate attainment in pronunciation of a foreign language.
Studies in Second Language Acquisition,
19,
447–
465.Google Scholar
Cook V.
1995.
Multi-competence and effects of age.
In D. Singleton &
Z. Lengyel (Eds.),
The age factor in second language acquisition
(pp. 51–
66).
Philadelphia, PA:
Multilingual Matters.
David S.
1985.
The acquisition of the phonological features of a second dialect.
Unpublished master's thesis,
University of South Carolina,
Columbia.
Delamere T.
1996.
The importance of interlanguage errors with respect to stereotyping by native speakers in their judgments of second language learners' performance.
System,
24,
279–
297.Google Scholar
Fairbanks G.
1940.
Voice and articulation drill book.
New York:
Harper.
Felix S. W.
1985.
More evidence on competing cognitive systems.
Second Language Research,
1,
47–
72.Google Scholar
Flege J. E.
1988.
Factors affecting degree of perceived foreign accent in English sentences.
Journal of the Acoustical Society of America,
84,
70–
79.Google Scholar
Flege J. E., &
Fletcher K. L.
1992.
Talker and listener effects on the perception of degree of foreign accent.
Journal of the Acoustical Society of America,
91,
370–
389.Google Scholar
Flege J. E.,
Munro M. J., &
MacKay I. R.
1995.
Factors affecting strength of perceived foreign accent in a second language.
Journal of the Acoustical Society of America,
97,
3125–
3134.Google Scholar
Flege J. E.,
Yeni–Komshian G. H., &
Liu S.
1999.
Age constraints on second-language acquisition.
Journal of Memory and Language,
41,
78–
104.Google Scholar
Gerrat B. R., &
Kreiman J.
2001.
Measuring vocal quality with speech synthesis.
Journal of the Acoustical Society of America,
110,
2560–
2566.Google Scholar
Harley B., &
Wang W.
1997.
The critical period hypothesis: Where are we now?
In A. M. B. de Groot &
J. F. Kroll (Eds.),
Tutorials in bilingualism: Psycholinguistic perspectives
(pp. 19–
51).
Mahwah, NJ:
Erlbaum.
Hyltenstam K.
1992.
Non-native features of near-native speakers: On the ultimate attainment of childhood L2 learners.
In R. J. Harris (Ed.),
Cognitive processing in bilinguals
(pp. 351–
368).
Amsterdam:
North–Holland.
Hyltenstam K., &
Abrahamsson N.
2000.
Who can become native-like in a second language? all, some, or none?
Studia Linguistica,
54,
150–
166.Google Scholar
IEEE Subcommittee on Subjective Measurements.
1969.
IEEE recommended practice for speech quality measurements.
IEEE Transactions on Audio Electroacoustics, AU-17,
227–
250.
Ioup G.
1984.
Is there a structural foreign accent? A comparison of syntactic and phonological errors in second language acquisition.
Language Learning,
34,
1–
17.Google Scholar
Johnson J. S., &
Newport E. L.
1989.
Critical period effects in second language learning: The influence of maturational state on the acquisition of English as a second language.
Cognitive Psychology,
21,
60–
99.Google Scholar
Krashen S. D.,
Long M. H., &
Scarcella R. C.
1979.
Age, rate, and eventual attainment in second language acquisition.
TESOL Quarterly,
13,
573–
582.Google Scholar
Krashen S. D.,
Scarcella R. C., &
Long M. H. (Eds.).
1982.
Age, rate, and eventual attainment in second language acquisition.
In S. D. Krashen,
R. C. Scarcella &
M. H. Long (Eds.),
Child–adult differences in second language acquisition
(pp. 161–
172).
Rowley, MA:
Newbury House.
Lenneberg,E. H.
1967.
Biological foundations of language.
New York:
Wiley.
Long M. H.
1990.
Maturational constraints on language development.
Studies in Second Language Acquisition,
12,
251–
285.Google Scholar
Magiste E.
1979.
The competing language systems of the multilingual: A developmental study of decoding and encoding processes.
Journal of Verbal Learning and Verbal Behavior,
18,
79–
89.Google Scholar
Major R. C.
1987a.
Measuring pronunciation accuracy using computerized techniques.
Language Testing,
4,
155–
169.Google Scholar
Major R. C.
1987b.
Phonological similarity, markedness, and rate of L2 acquisition.
Studies in Second Language Acquisition,
9,
63–
82.Google Scholar
Major R. C.
1992.
Losing English as a first language.
The Modern Language Journal,
76,
190–
208.Google Scholar
Major R. C.
1998.
Interlanguage phonetics and phonology: An introduction.
Studies in Second Language Acquisition,
20,
131–
137.CrossRefGoogle Scholar
Moyer A.
1999.
Ultimate attainment in L2 phonology: The critical factors of age, motivation, and instruction.
Studies in Second Language Acquisition,
21,
81–
108.CrossRefGoogle Scholar
Neufeld G.
1977.
Language learning ability in adults: A study on the acquisition of prosodic and articulatory features.
Working Papers on Bilingualism,
12,
45–
60.Google Scholar
Neufield G., &
Schneidermann E.
1980.
Prosodic and articulatory features in adult language learning.
In R. Scarcella &
S. Krashen (Eds.),
Research in second language acquisition
(pp. 105–
109).
Rowley, MA:
Newbury House.
Newport E. L.,
Bavelier D., &
Neville H. J.
2001.
Critical thinking about critical periods: Perspectives on a critical period for language acquisition.
In E. Dupoux,
Language, brain and cognitive development: Essays in honor of Jacques Mehler
(pp. 481–
502).
Cambridge, MA:
MIT Press.
Oyama S.
1976.
A sensitive period for the acquisition of a nonnative phonological system.
Journal of Psycholinguistic Research,
5,
261–
283.Google Scholar
Oyama S.
1979.
The concept of the sensitive period in developmental studies.
Merrill–Palmer Quarterly,
25,
83–
103.Google Scholar
Patkowski M. S.
1990.
Age and accent in a second language: A reply to James Emil Flege.
Applied Linguistics,
11,
73–
89.Google Scholar
Piske T.,
MacKay I. R., &
Flege J. E.
2001.
Factors affecting degree of foreign accent in an L2: A review.
Journal of Phonetics,
29,
191–
215.Google Scholar
Ramsey C. A., &
Wright E. N.
1974.
Age and second language learning.
The Journal of Social Psychology,
94,
115–
121.Google Scholar
Rogers C.
1997.
Intelligibility of Chinese-accented English.
Unpublished Ph.D. dissertation, Indiana University, Department of Linguistics and Cognitive Science Program.
Rogers C. L., &
Dalby J. M.
1995.
Intelligibility assessment of Chinese-accented English.
Paper presented at the 130th Meeting of the
Acoustical Society of America,
St. Louis, MO.
Scovel T.
1969.
Foreign accents, language acquisition, and cerebral dominance.
Language Learning,
19,
245–
253.Google Scholar
Scovel T.
2000.
A critical review of the critical period research.
Annual Review of Applied Linguistics,
20,
213–
223.Google Scholar
Singleton D.
2001.
Age and second language acquisition.
Annual Review of Applied Linguistics,
21,
77–
91.Google Scholar
Slavoff G. R., &
Johnson J. S.
1995.
The effects of age on rate of learning a second language.
Studies in Second Language Acquisition,
17,
1–
16.Google Scholar
Southwood M. H., &
Flege J. E.
1999.
Scaling foreign accent: Direct magnitude estimation versus interval scaling.
Clinical Linguistics and Phonetics,
13,
335–
449.Google Scholar
Tahta S.,
Wood M., &
Loewenthal K.
1981.
Foreign accents: Factors relating to transfer of the accent from the first language to a second language.
Language and Speech,
24,
265–
272.Google Scholar
Thompson I.
1991.
Foreign accents revisited: The English pronunciation of Russian immigrants.
Language Learning,
4,
177–
204.Google Scholar
White L., &
Genesee F.
1996.
How native is near-native? The issue of ultimate attainment in adult second language acquisition.
Second Language Research,
12,
233–
265.Google Scholar
The trade-off between short- and long-term advantages. There is rapid but limited acquisition for late learners and slower but more complete acquisition for early learners
Statistical tests predicted to falsify models of AOI–DPA relationship
The organization of sessions
Speaker means with third-order effects. Linearity over AOI=3–16 range dominates over the third-order effect
The AOI means with the first-order effect by rater
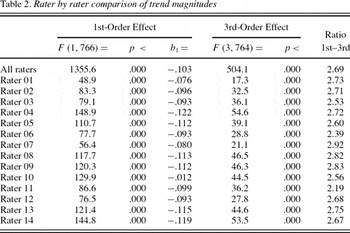
Rater by rater comparison of trend magnitudes
The interspeaker variability
The intraspeaker variability
Linear trends by gender
Sampling means with error bars
Pairwise F tests of sampling effects
Linear regressions for each sampling type
Sampling-type linear trends
Speaker means with first-order effect (±) word sampling. There is increased AOI effect without accent neutralizing the effect of words
Speaker means with third-order effect (±) word sampling. There is increased curvilinear effect without accent neutralizing the effect of words
Word and sentence tokens used in each task

 You have
Access
- 48
- Cited by