Behavior problems are prominent features of etiological models of adolescent alcohol use (AU). A large body of literature suggests that some children initiate substance use after a long cascade of problems that begin in early childhood (e.g., Dodge, Malone, Lansford, Miller, Pettit, & Bates, Reference Dodge, Malone, Lansford, Miller, Pettit and Bates2009). These models largely focus on externalizing problems (e.g., rule breaking, aggression) and research has consistently supported externalizing problems as a robust prospective correlate of adolescent AU (Chassin, Colder, Hussong, & Sher, Reference Chassin, Colder, Hussong, Sher and Sameroff2016; Hussong et al., Reference Hussong, Jones, Stein, Baucom and Boeding2011; Witkiewitz et al., Reference Witkiewitz, King, McMahon, Wu and Luk2013; Zucker, Reference Zucker and Sameroff2016), peer delinquency (Burt, McGue, & Iacono, Reference Burt, McGue and Iacono2009; Brook et al., Reference Brook, Brook, Rubenstone, Zhang and Saar2011; Scalco et al., Reference Scalco, Colder, Hawk, Read, Wieczorek and Lengua2014), alcohol use disorder (AUD; Sung et al., Reference Sung, Erkanli, Angold and Costello2004; Zucker, Reference Zucker and Sameroff2016), and other illicit substance use (Chassin et al., Reference Chassin, Colder, Hussong, Sher and Sameroff2016; Dodge et al., Reference Dodge, Malone, Lansford, Miller, Pettit and Bates2009). Evidence suggests that externalizing problems promote affiliation with delinquent peers, who in turn provide support for and access to alcohol and drugs.
In contrast to robust findings for an externalizing pathway, findings regarding the link between internalizing problems (e.g., emotional distress including depression and anxiety) and AU and AUD have been inconsistent, making the role of internalizing symptoms in the development of AU and AUD unclear (Chassin, Pitts, DeLucia, & Todd, Reference Chassin, Pitts, DeLucia and Todd1999; Colder, Chassin, Lee, & Villalta, Reference Colder, Chassin, Lee, Villalta and Kassel2010; Colder et al., Reference Colder, Scalco, Trucco, Read, Lengua and Wieczorek2013; Costello, Erkanli, Federman, & Angold, Reference Costello, Erkanli, Federman and Angold1999; Foster, Hicks, & Zucker, Reference Foster, Hicks and Zucker2018; Hussong et al., Reference Hussong, Jones, Stein, Baucom and Boeding2011; Hussong, Ennett, Cox, & Haroon, Reference Hussong, Ennett, Cox and Haroon2017; Little et al., Reference Little, Hawkins, Sanson, O'Connor, Toumbourou, Smart and Vassallo2013; Marmorstein, White, Loeber, & Stouthamer-Loeber, Reference Marmorstein, White, Loeber and Stouthamer-Loeber2010; Scalco et al., Reference Scalco, Colder, Hawk, Read, Wieczorek and Lengua2014; Stice, Barrera, & Chassin, Reference Stice, Barrera and Chassin1998). Some of this research even suggests that internalizing might reduce risk for substance use (SU) in early adolescence (Colder et al., Reference Colder, Scalco, Trucco, Read, Lengua and Wieczorek2013, Reference Colder, Frndak, Lengua, Read, Hawk and Wieczorek2018; Mason et al., Reference Mason, Hitchings and Spoth2008; Scalco et al., Reference Scalco, Colder, Hawk, Read, Wieczorek and Lengua2014) yet still increase risk for AUD later in adolescence (Costello et al., Reference Costello, Erkanli, Federman and Angold1999; Stice et al., Reference Stice, Barrera and Chassin1998). Research and theoretical work suggests that whether internalizing problems are associated with adolescent AU and AUD may depend on the co-occurrence of internalizing symptoms with externalizing symptoms, the degree of affiliation with peers that are involved in substance use and delinquency, and the stability of problem behavior across developmental periods (Foster et al., Reference Foster, Hicks and Zucker2018; Hussong et al., Reference Hussong, Jones, Stein, Baucom and Boeding2011; Mason, Hitchings, & Spoth, Reference Mason, Hitchings and Spoth2008; Scalco et al., Reference Scalco, Colder, Hawk, Read, Wieczorek and Lengua2014; Zehe et al., Reference Zehe, Colder, Read, Wieczorek and Lengua2013).
Given the mixed literature and findings, it is likely that internalizing problems are involved in both risk and protective pathways, and to understand this complexity, it is critical to consider internalizing symptoms within the context of externalizing symptoms. A notable dearth of research has considered theoretical transactions between internalizing and externalizing problem behavior while considering multiple mechanisms of AU and AUD. In the current paper, we considered several competing theoretical perspectives to develop hypotheses about how internalizing and externalizing symptoms may operate together in developmental pathways to AU and AUD. These included the delayed onset and rapid escalation hypothesis (Hussong et al., Reference Hussong, Jones, Stein, Baucom and Boeding2011), the co-occurring hypothesis (Colder et al., Reference Colder, Frndak, Lengua, Read, Hawk and Wieczorek2018), and the dual failure hypothesis (Capaldi, Reference Capaldi1992). Each theoretical perspective posits differing roles (protective, risk, null) for internalizing symptoms in the prediction of AU and AUD. In doing so, we emphasize several key issues that have been regarded as being important in understanding the role of internalizing symptoms in developmental models of addiction including the evolution of co-occurring internalizing and externalizing symptom patterns, the potential role of delinquent peers and perception of peer delinquency, the stability of behavior problems, and late versus early onset of use. Additionally, we examined whether behavior problems operate directly on AUD symptoms or operate on AUD symptoms through levels of use.
Theoretical Formulations of an Internalizing Pathway to AU and AUD
Colder et al. (Reference Colder, Chassin, Lee, Villalta and Kassel2010) and Hussong et al. (Reference Hussong, Jones, Stein, Baucom and Boeding2011) posited that hallmark features of internalizing symptoms such as fearfulness, social withdrawal, and avoidance might protect some youth from AU in early adolescence but then lead to rapid escalation later in adolescence when AU becomes more normative. Delayed onset and rapid escalation is believed to be a result of the emergence of perceived acceptability of AU to cope with emotional distress. Indeed, previous research has found that internalizing problems protected youth from selecting into delinquent peer networks, which in turn decreased the likelihood of early adolescent AU (Fite, Colder, & O'Conner, Reference Fite, Colder and O'Connor2006; Mason et al., Reference Mason, Hitchings and Spoth2008; Scalco et al., Reference Scalco, Colder, Hawk, Read, Wieczorek and Lengua2014). However, only one study has supported the notion of rapid escalation to problem AU later in adolescence (Kushner, Maurer, Menary, & Thuras, Reference Kushner, Maurer, Menary and Thuras2011) and this study was based on retrospective self-report. Other studies that have used longitudinal designs have failed to find support for the hypothesis that internalizing symptoms predict rapid escalation of AU later in adolescence, even when considering chronically elevated symptoms (e.g., Colder et al., Reference Colder, Frndak, Lengua, Read, Hawk and Wieczorek2018), an important feature of the theory that is presented in Hussong et al. (Reference Hussong, Jones, Stein, Baucom and Boeding2011). Here we refer to this hypothesis as the delayed AU onset and rapid escalation hypothesis. It is notable that Hussong et al.’s (Reference Hussong, Jones, Stein, Baucom and Boeding2011) description of this internalizing pathway is quite similar to the well-established externalizing pathway (involving rejection from mainstream peers and selection into deviant peer networks later in adolescence). Accordingly, it is important that externalizing symptoms are considered in such a model to ensure that the proposed internalizing pathway is not simply due to externalizing symptoms that commonly co-occur with internalizing symptoms (Colder et al., Reference Colder, Chassin, Lee, Villalta and Kassel2010, Reference Colder, Frndak, Lengua, Read, Hawk and Wieczorek2018; Hussong et al., Reference Hussong, Jones, Stein, Baucom and Boeding2011, Reference Hussong, Ennett, Cox and Haroon2017).
It is possible that the delayed onset and rapid escalation pathway articulated in Hussong et al. (Reference Hussong, Jones, Stein, Baucom and Boeding2011) is a function of co-occurring symptoms and not internalizing symptoms alone. We refer to this as the co-occurrence hypothesis. Prior work on co-occurring symptoms suggests that the strongest correlates of a co-occurring symptom constellation are peer rejection (Keiley et al., Reference Keiley, Lofthouse, Bates, Dodge and Pettit2003); peer victimization, peer delinquency (Dishion, Reference Dishion2000; Scalco et al., Reference Scalco, Trucco, Colder, Lengua, Wiezcorek and Hawk2012); deficits in executive functioning (Martel et al., Reference Martel, Pan, Hoffmann, Gadelha, do Rosário, Mari and Salum2017; Scalco et al., Reference Scalco, Trucco, Colder, Lengua, Wiezcorek and Hawk2012); and poor social skills (Ingoldsby, Kohl, McMahon, & Lengua, Reference Ingoldsby, Kohl, McMahon and Lengua2006). As such, some aspects of the pathway described in Hussong et al., (Reference Hussong, Jones, Stein, Baucom and Boeding2011) seem relevant to a co-occurring pathway, in which co-occurring problem behavior leads to peer rejection, selection into delinquent peer networks, early AU (Colder et al., Reference Colder, Scalco, Trucco, Read, Lengua and Wieczorek2013; Scalco et al., Reference Scalco, Colder, Hawk, Read, Wieczorek and Lengua2014), and possibly AUD. Even though lower levels of AU have been linked to youth with co-occurring symptoms compared to youth with externalizing symptoms alone, co-occurring symptoms are associated with poorer executive functioning, suggesting that these youth may then progress more rapidly to AUD.
Given the potential importance of co-occurring internalizing and externalizing symptoms in developmental pathways to AU and AUD, it is notable that few studies consider theoretical models of the development of co-occurring symptoms and their relevance to AUD. One possibility is a developmental progression from externalizing symptoms to co-occurring symptoms to AU and AUD. According to the dual failure hypothesis (Capaldi, Reference Capaldi1991; Reference Capaldi1992) and evidence from prior research (Chassin et al., Reference Chassin, Pitts, DeLucia and Todd1999; Copeland, Shanahan, Costello, & Angold, Reference Copeland, Shanahan, Costello and Angold2009; McElroy, Shevlin, & Murphy, Reference McElroy, Shevlin and Murphy2017; Owens & Hinshaw, Reference Owens and Hinshaw2016), externalizing symptoms can lead to internalizing symptoms as a result of peer rejection, alienation from school and parents (Capaldi Reference Capaldi1991, Reference Capaldi1992; Chassin et al., Reference Chassin, Pitts, DeLucia and Todd1999), and the negative consequences of delinquent behavior in adolescence (Lahey & Waldman, Reference Lahey, Waldman, Beauchaine and Hinshaw2017). The implications of the emergence of internalizing symptoms secondary to externalizing symptoms for AU and AUD are unclear. Some work suggests lower risk for AU among youth with co-occurring symptoms relative to those with elevated externalizing symptoms alone (Colder et al., Reference Colder, Scalco, Trucco, Read, Lengua and Wieczorek2013, Reference Colder, Frndak, Lengua, Read, Hawk and Wieczorek2018; Scalco et al., Reference Scalco, Colder, Hawk, Read, Wieczorek and Lengua2014) but increased risk for co-occurring symptoms relative to internalizing symptoms alone, a finding that has been replicated in several samples (Colder et al., Reference Colder, Scalco, Trucco, Read, Lengua and Wieczorek2013; Foster et al., Reference Foster, Hicks and Zucker2018; Mason et al., Reference Mason, Hitchings and Spoth2008). Furthermore, some studies have found a direct effect of internalizing symptoms on AUD when externalizing symptoms were included as a statistical control (Costello et al., Reference Costello, Erkanli, Federman and Angold1999; Stice et al., Reference Stice, Barrera and Chassin1998). It is plausible that such direct effects are due to co-occurring symptoms given (a) that interactions between internalizing and externalizing are not typically included in analytic models (Scalco et al., Reference Scalco, Colder, Hawk, Read, Wieczorek and Lengua2014) and (b) that co-occurring symptoms have a stronger relationship with poor executive functioning than with internalizing symptoms alone in adolescence (Colder et al., Reference Colder, Scalco, Trucco, Read, Lengua and Wieczorek2013; Keiley et al., Reference Keiley, Lofthouse, Bates, Dodge and Pettit2003; Scalco et al., Reference Scalco, Trucco, Colder, Lengua, Wiezcorek and Hawk2012).
Another possibility is that externalizing symptoms develop secondary to internalizing symptoms. Hussong et al. (Reference Hussong, Jones, Stein, Baucom and Boeding2011) hypothesized that chronic internalizing symptoms result in peer problems and then selection into peer delinquency. Following socialization theory, this process could then result in socialization of externalizing behavior or the development of co-occurring symptoms. Following the research linking co-occurring symptoms to AU, subsequent co-occurring symptoms may then predict AU and AUD later in adolescence.
Taken together, the dual-failure hypothesis, the delayed onset/rapid escalation hypothesis, and the co-occurring hypothesis postulate different and competing starting points (internalizing/externalizing alone versus co-occurring symptoms), different and competing mechanisms (development of internalizing and externalizing symptoms second to externalizing and internalizing, respectively), and common mechanisms (peer behavior and social norms) to explain the development of AU and AUD in adolescence. Previous research has failed to compare and contrast these different theoretical and mechanistic accounts of the etiology of developmental pathways to AU and AUD (e.g., Foster et. al., Reference Foster, Hicks and Zucker2018) to provide a rigorous test of theory. This is a notable gap in the research literature and informs the objectives of the current study.
Summary and the Present Study
Despite a plethora of theory and empirical evidence, no studies to our knowledge have tested developmental pathways from internalizing and externalizing symptoms and their co-occurrence to AUD through theoretical mediators such as changes in problem behavior, peer delinquency, and changes in AU across adolescence. The dual failure hypothesis proposes that externalizing symptoms lead to co-occurring symptoms, both of which should increase risk for peer delinquency, AU, and possibly AUD. Therefore, this theory emphasizes the role of externalizing symptoms, while internalizing symptoms and peer delinquency are part of a cascade that follows from externalizing symptoms to a constellation of co-occurring symptoms. Alternatively, the delayed onset and rapid escalation hypothesis predicts that chronic internalizing symptoms should decrease risk for peer delinquency and AU in early adolescence, but this results in rapid escalation in AU and eventually AUD later in adolescence. This perspective doesn't explicitly address the role of externalizing symptoms and hypothesizes a primary role for internalizing symptoms. However, Hussong et al. (Reference Hussong, Jones, Stein, Baucom and Boeding2011) suggest that chronic internalizing symptoms may lead to peer problems and selection into delinquent peer networks. Following socialization and influence theories, peer delinquency may then increase externalizing symptoms and eventually lead to AU and AUD later in adolescence. According to this perspective, internalizing symptoms are expected to be prospectively associated with the emergence of externalizing symptoms and a co-occurring symptom constellation (the opposite prediction of the dual failure model) via peer delinquency. Third, the co-occurring hypothesis suggests that stable co-occurring symptoms may lead to peer delinquency, AU, and AUD similarly to externalizing symptoms, but then lead to earlier AUD symptoms given poorer executive functioning and more severe social problems among youth with stable co-occurring symptoms (Keiley et. al., Reference Keiley, Lofthouse, Bates, Dodge and Pettit2003; Scalco et al., Reference Scalco, Trucco, Colder, Lengua, Wiezcorek and Hawk2012).
Finally, selection and socialization mechanisms are important factors in the development of problem behavior and AU (Cruz, Emery, & Turkheimer, Reference Cruz, Emery and Turkheimer2012; Curran, Stice, & Chassin, Reference Curran, Stice and Chassin1997; Dishion & Skaggs Reference Dishion and Medici Skaggs2000; Haynie & Osgood, Reference Haynie and Osgood2005; Hill, Emery, Harden, Mendle, & Turkheimer, Reference Hill, Emery, Harden, Mendle and Turkheimer2008; Knecht, Burk, Weesie, & Steglich, Reference Knecht, Burk, Weesie and Steglich2010; Osgood et al., Reference Osgood, Ragan, Wallace, Gest, Fienberg and Moody2013; Scalco, Meisel, & Colder, Reference Scalco, Meisel and Colder2016; Scalco, Trucco, Coffman, & Colder, Reference Scalco, Trucco, Coffman and Colder2015; Trucco, Colder, & Wieczorek, Reference Trucco, Colder and Wieczorek2011). We expected that both perceived and actual peer behavior will be important in understanding the role of selection and socialization in our proposed developmental pathways. For instance, the perception that peer delinquency is normative may result in selection into delinquent peer networks and socialization of either externalizing symptoms or early AU, eventually leading to AUD.
Hypotheses were tested using a longitudinal community sample with assessments that spanned from early to late adolescence. Our longitudinal design offered a number of advantages over previous research (e.g., Foster, et al., Reference Foster, Hicks and Zucker2018), which did not assess AUD symptoms and mediation by peer delinquency. Furthermore, given our focus on co-occurring symptoms, we used a longitudinal bifactor model, which partitions variance in problem behavior into four orthogonal dimensions: “pure” internalizing, “pure” externalizing, co-occurring symptoms, and error. This allowed us to examine the transactional effects between pure and co-occurring continuous symptom dimensions as well as peer delinquency, AU, and AUD while adjusting for measurement error. The advantages of this design include considering co-occurring internalizing and externalizing symptoms within a dimensional and latent framework (Markon, Chmielewski, & Miller, Reference Markon, Chmielewski and Miller2011), considering the stability of problem behavior symptoms across developmental periods (Hussong et al., Reference Hussong, Jones, Stein, Baucom and Boeding2011, Reference Hussong, Ennett, Cox and Haroon2017), modeling growth in levels of AU during critical periods of development for AU and AUD (Sung et al., Reference Sung, Erkanli, Angold and Costello2004), and considering multiple reporters of peer delinquency (Scalco, et al., Reference Scalco, Meisel and Colder2016) while assessing the sequencing of competing theoretical mediators within a transaction framework (MacKinnon, Reference MacKinnon2008; Sameroff & MacKenzie, Reference Sameroff and MacKenzie2003).
Methods
Participants
The participants were part of a longitudinal study of risk and protective factors for adolescent substance use. The original sample included 387 families (caregiver median income = $70,000; the adolescents were 55% female and 83.1% Caucasian) who were assessed annually. The average age of the adolescent participants at each assessment wave (W) was 11.6 at W1, 12.6 at W2, 13.6 at W3, 14.6 at W4, 15.5 at W5, 16.6 at W6 and 17.9 at W7. The second through seventh assessments occurred at the one-year anniversary of the prior assessment. From W2 to W7 the sample size ranged from N = 354 (91%) to N = 373 (96%). In previous papers (Colder et al., Reference Colder, Frndak, Lengua, Read, Hawk and Wieczorek2018), we have tested for differences between families who completed all seven assessments and families who missed at least one measurement on minority status, gender, age, parental education, marital status, family income, lifetime alcohol use, lifetime cigarette use, and internalizing and externalizing problems. There was only a difference on externalizing symptoms, and this difference did not meet conventional criteria for statistical significance (p = .056) and was small (Cohen d = .27). The low attrition rate and few differences on the baseline variables suggest that missing data likely had a limited influence on the study findings. Nonetheless, full information maximum likelihood (FIML) was used to estimate the parameters for the full sample (N = 387), an approach which is comparable to multiple imputation when variables related to missingness are included (Schafer & Graham, Reference Schafer and Graham2002).
At W1–W3, target adolescents provided the names of four close friends and one was recruited into the study (close friend) to provide collateral reports of the target adolescent's peer environment. Peers were required to be within two years of age of the target adolescent and could not be a sibling. To account for the fluid nature of adolescent peer relationships, targets were allowed to nominate different peers at each wave. The mean ages of peers (53% to 56% female) at W1–W3 were 11.5 (SD = 1.15), 12.4 (SD = 1.27), and 13.4 (SD = 1.18), respectively. Peers were not sampled after W3. The proportion of missing peer data was 8.3, 13.9, and 18.6% for W1–W3, respectively. In prior papers, we have tested for differences amongst those with and without peer data on 31 total variables, and the results have suggested that missing peer data was associated with lower socioeconomic status (SES), minority status, or being from a single-parent family and with increased likelihood of cigarette use, peer cigarette use, and perceived peer cigarette use (all ps < 0.05); however, these effects were small (R 2 = .4%; phi range = 0.07–0.13, (see Scalco, Meisel, & Colder, Reference Scalco, Meisel and Colder2016; Scalco, Trucco, Coffman, & Colder, Reference Scalco, Trucco, Coffman and Colder2015). Missingness was not related to the remaining 24 variables. These findings suggest that missing peer data also likely had a limited influence on the study findings. Full information maximum likelihood was used to handle missing data so that all possible cases were included in the analysis. For the peer sample, a more detailed description of recruitment, demographics, and procedures can be found in (Scalco et al., Reference Scalco, Trucco, Coffman and Colder2015).
Procedure
Procedural information and demographics have been reported in previous papers (Colder et al., Reference Colder, Scalco, Trucco, Read, Lengua and Wieczorek2013; Scalco et al., Reference Scalco, Colder, Hawk, Read, Wieczorek and Lengua2014), Briefly, from W1–W3 families were interviewed in university research offices and parents and adolescents were assessed in separate rooms. The assessments included laboratory tasks and questionnaires. The present study uses adolescent-reported questionnaires that assessed problem behavior, peer delinquency, AU, and AUD. The families were compensated 75, 85, and $120 at the first, second, and third assessment, respectively. At W4–W6, only substance use was measured, and adolescents entered their responses into an audio-Computer Assisted Self Interview (CASI) system that took 10–15 minutes to complete. The W7 measurement occurred 13 months after the W6 assessment. The procedures were similar to those that were used in W1–W3 and can be found in Colder et al. (Reference Colder, Frndak, Lengua, Read, Hawk and Wieczorek2018). The adolescents were compensated $125 for completing the full assessment. A small number of participants moved out of the area and were compensated $50 for completing an online questionnaire (n = 18 or 5% of sample). The caregivers were compensated $40.
Measures
Adolescent Problem Behavior (W1–W3)
Problem behavior was assessed by using the Youth Self Report (YSR) form of the Achenbach System of Empirical Behavioral Assessment (Achenbach & Rescorla, Reference Achenbach and Rescorla2001). The rule breaking and aggressive scales were used to measure externalizing problems, and the withdrawn depressed and anxious depressed scales were used to measure internalizing problems. The YSR has been used extensively and has been shown to have good reliability and validity (Achenbach & Rescorla, Reference Achenbach and Rescorla2001). Cronbach α for externalizing symptoms ranged from 0.87 to 0.90 at all three waves, while the value for internalizing symptoms ranged from 0.83 to 0.88. Item parcels were bundled to form indicators to reduce the complexity of the model. These bundles were based on our prior work at the item level of the YSR (Colder et al., Reference Colder, Scalco, Trucco, Read, Lengua and Wieczorek2013). Furthermore, different bundling strategies produced similar findings in prior work (see Scalco et al., Reference Scalco, Colder, Hawk, Read, Wieczorek and Lengua2014) and also showed excellent construct validity at W1 (see Colder et al., Reference Colder, Scalco, Trucco, Read, Lengua and Wieczorek2013; Scalco et al., Reference Scalco, Trucco, Colder, Lengua, Wiezcorek and Hawk2012). The T-scores for our sample were similar to those that were reported by Achenbach and Rescorla (Reference Achenbach and Rescorla2001) in their nonreferred sample. For example, 11- to 18-year-old males and females were reported to have an average T-score of approximately 54 for anxious depressed, withdrawn depressed, rule breaking, and aggressive behavior scales, and in the current sample, these T-scores ranged from 51 to 55 for males and females.
Child Substance Use at W1–W6
Items from the National Youth Survey (NYS) were used to assess lifetime AU at W1 and past-year quantity and frequency of AU (Elliott & Huizinga, Reference Elliott and Huizinga1983) from W3 to W6. Lifetime use was assessed with one dichotomous item (no/yes), while past-year frequency was assessed by using a fill-in-the-blank response. Quantity by frequency (Q × F) indices were created at each wave from W3 to W6. Self-reports of adolescent SU, such as the NYS, have been shown to be valid when the adolescent perceives them to be anonymous and confidential (Winters, Stinchfield, Henly, & Schwartz, Reference Winters, Stinchfield, Henly and Schwartz1991). Rates of AU initiation in our sample were comparable to national and state epidemiological studies (see Scalco et al., Reference Scalco, Meisel and Colder2016). From W1 to W6, 3, 11, 24, 29, 39, and 50% reported AU. Means of the Quantity × Frequency indices from W3 to W6 were 0.07 (SD = 0.23), 0.33 (SD = 0.86), 0.84 (SD = 2.25), and 1.77 (SD = 4.01), respectively. Skewness ranged from 4.3 at W1 to 3.01 at W6, while kurtosis ranged from 18.92 at W1 to 8.55 at W6. The distribution of these variables suggested some extreme observations at each wave. Accordingly, values beyond three standard deviations above the mean were recoded to three standard deviations above the mean to reduce the undue influence of a few cases (Tabachnick & Fidell, Reference Tabachnick and Fidell2001).
Peer Delinquency (W1–W3)
Peer delinquency was assessed by using both target adolescent report and peer report. For target report, adolescents reported whether any of their three closest friends have ever engaged in 14 delinquent and rule breaking behaviors (Fergusson, Woodward, & Howard, Reference Fergusson, Woodward and Horwood1999). Sample items are (a) “Sold marijuana or hashish,” (b) “Purposefully set fire to a building, a car, or other property, or tried to do so,” and (c) “Been in trouble with the police.” Items also included perception of peer AU and other substance use (“used alcohol,” “used marijuana,” and “used tobacco”). Items from the scale were randomly divided to form three bundles that would serve as indicators for the target-reported peer delinquency latent factor from W1 to W3. Cronbach α ranged from 0.80 to 0.87. Peer-reported peer delinquency was assessed by using three scales: the rule breaking scale of the YSR (Cronbach α: 0.67 to 0.75), the sum of self-reported alcohol, tobacco, and marijuana use, and the peer's report of delinquency for close friends (excluding the target adolescent), using the same measure that the targets completed (Fergusson et al., Reference Fergusson, Woodward and Horwood1999). Cronbach α ranged from 0.80 to 0.88.
Alcohol Use Disorder (W3, W7)
At W3 youth were 13.4 on average with a range of 12 to 15. As such, a developmentally appropriate set of items were taken from Windle and Windle (Reference Windle and Windle1996) to measure alcohol-related problems. The items assess a range of consequences and symptoms. Examples include “Drank before school,” “Got into trouble with the law,” “Missed school because of drinking,” “Drank alcohol to get rid of hangover,” “Thought about cutting down on your drinking,” “Got drunk or high from alcohol several days in a row,” and “Passed out from drinking.” The item pool did not contain items that assess craving and failed attempts to quit AU, but they otherwise reflect AUD criteria that are relevant to early adolescence. Cronbach α was large (0.93), and the items were randomly assigned to 3 bundles to serve as indicators of the W3 AUD factor.
Two measures were used to assess AUD symptoms at W7. First, the Mini-International Neuropsychiatric Interview for children and adolescents (MINI 6.0) was used (Sheehan, Shyte, Milo, & Lecrubier, Reference Sheehan, Shytle, Milo and Lecrubier2006); a question assessing craving (“Did you crave alcohol or have a strong desire or urge to drink?”) was added and the legal question was dropped, consistent with DSM-5. Second, the Young Adult Alcohol Consequences Questionnaire (YAACQ; 47 consequences) scale was also used (Read, Wood, & Capone, Reference Read, Wood and Capone2005). An exploratory factor analysis on the subscales of the YAACQ suggested two factors. The first factor represented social/interpersonal consequences, impaired control, risky behaviors, and experiences with blackouts, while the second factor represented self-perception, self-care, academic and occupational consequences, and psychological and physical dependence. The MINI for alcohol and the two consequences measures from the EFA of the YAACQ served as three indicators of AUD at W7.
For descriptive purposes, we used a two-symptom cutoff on the MINI and diagnostic proportions from our sample map on to large epidemiological studies (Colder et al., Reference Colder, Frndak, Lengua, Read, Hawk and Wieczorek2018; Wakefield & Schmitz, Reference Wakefield and Schmitz2015). For instance, using DSM-5 criteria, the National Comorbidity Study and the National Epidemiologic Study of Alcoholism and Related Conditions found that between 11.7% and 19.5% had AUD (Wakefield & Schmitz, Reference Wakefield and Schmitz2015), while the value for our sample was 17.1%. Using the harmful dysfunction model proposed by Wakefield and colleagues and a two-symptom cutoff also resulted in consistent diagnostic proportions across several samples (National Comorbidity Study: 6.8%; National Epidemiologic Study of Alcoholism and Related Conditions: 1.8–6.7%; current sample: 6.3%).
Data Analysis
Our hypotheses were tested by using (a) a bifactor confirmatory factor model (CFA) for internalizing and externalizing symptoms, (b) CFA for target and close friend reports of peer delinquency, (c) a latent growth curve model (LGCA) for changes in AU and CFA for W3 and W7 AUD, and (d) a final structural regression model in which nested tests were computed to evaluate whether adding lagged paths between constructs improved model fit. All of the models were tested in Mplus version 7.3 (Muthén & Muthén, Reference Muthén and Muthén1998–2007) and were estimated by using maximum likelihood robust, which has been shown to provide more accurate estimates when variables deviate from normality (Finch, West, & MacKinnon, Reference Finch, West and MacKinnon1997). Furthermore, skew and kurtosis among our indicators were within the range tested in Finch et al. (Reference Finch, West and MacKinnon1997), suggesting the appropriateness of maximum likelihood robust for handling the observed skew among our indicators. The root mean square error of approximation (RMSEA), comparative fit index (CFI), Tucker–Lewis index (TLI), and standardized root mean squared residual (SRMR) as well as model residuals were all used to test model fit for all of the models. As setting specific cutoffs for assessing “good” model fit cannot be generalized across all models (Hu & Bentler, Reference Hu and Bentler1999; Marsh, Hau, & Wen, Reference Marsh, Hau and Wen2004), ranges were used (for RMSEA, .08 is poor, .05–.07 is acceptable, and < .05 is excellent; for CFI and TLI, < .9 is poor, .9–.94 is acceptable, and > .95 is excellent; and for SRMR, .09 is poor, .06–.09 is acceptable, and < .06 is excellent).
Given the complexity of the final model, we were motivated to build our model in a sequence of steps and to reduce the number of parameters being estimated. First, we estimated three measurement models separately and tested autocovariances among the indicators and measurement invariance over time by using Satorra–Bentler nested chi-square tests.
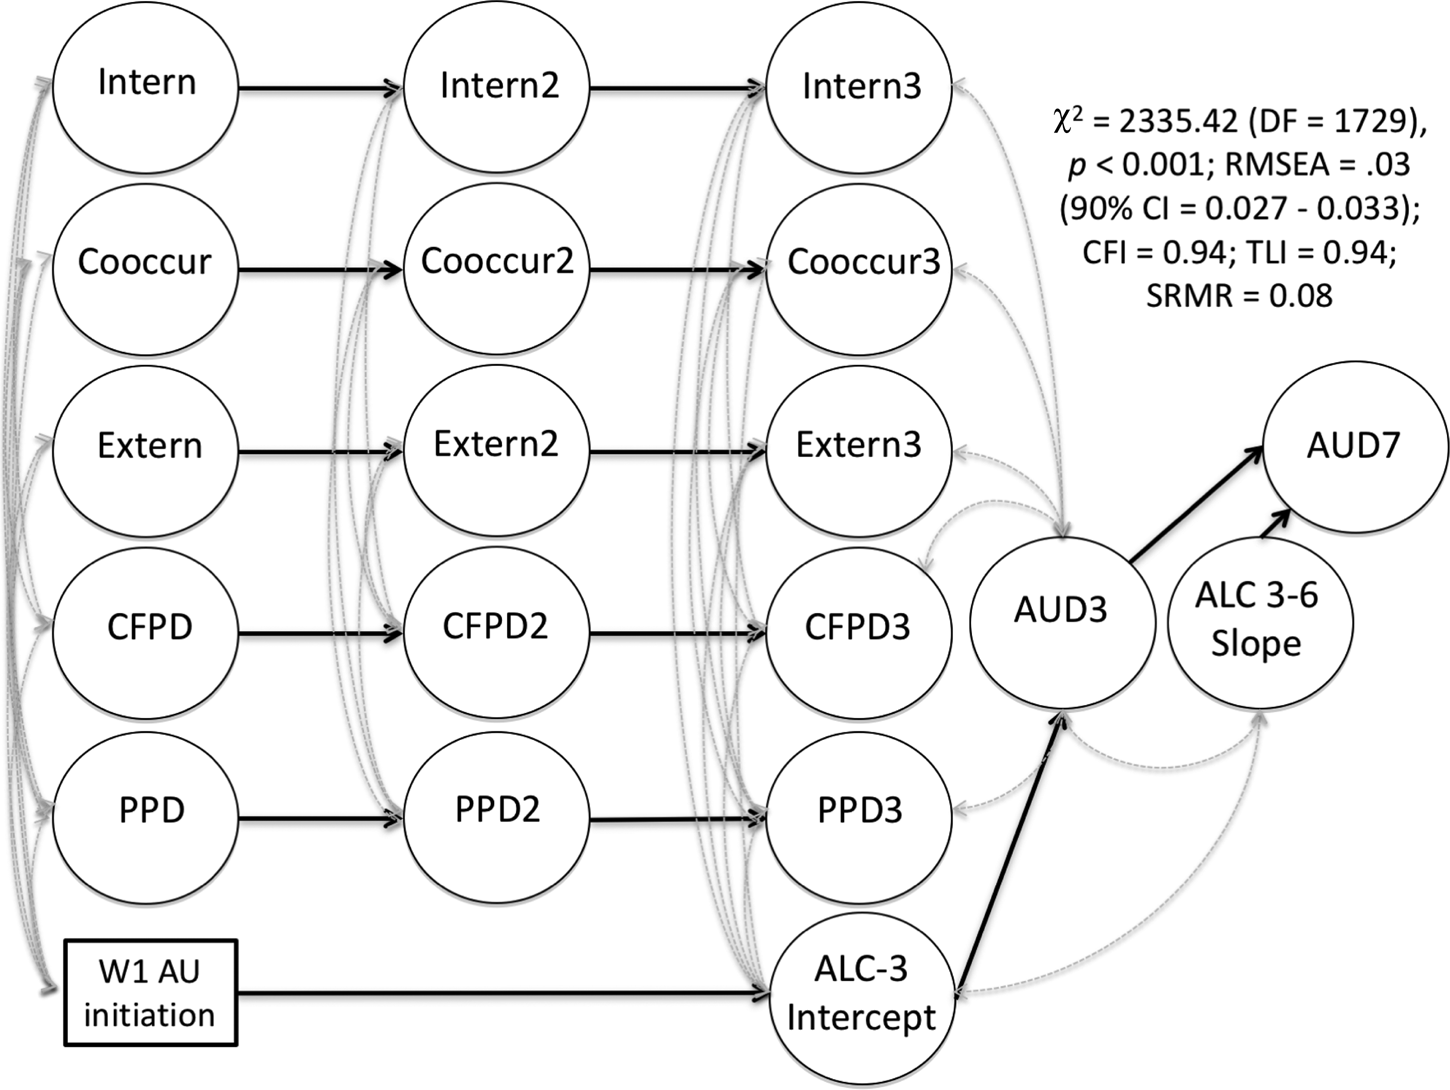
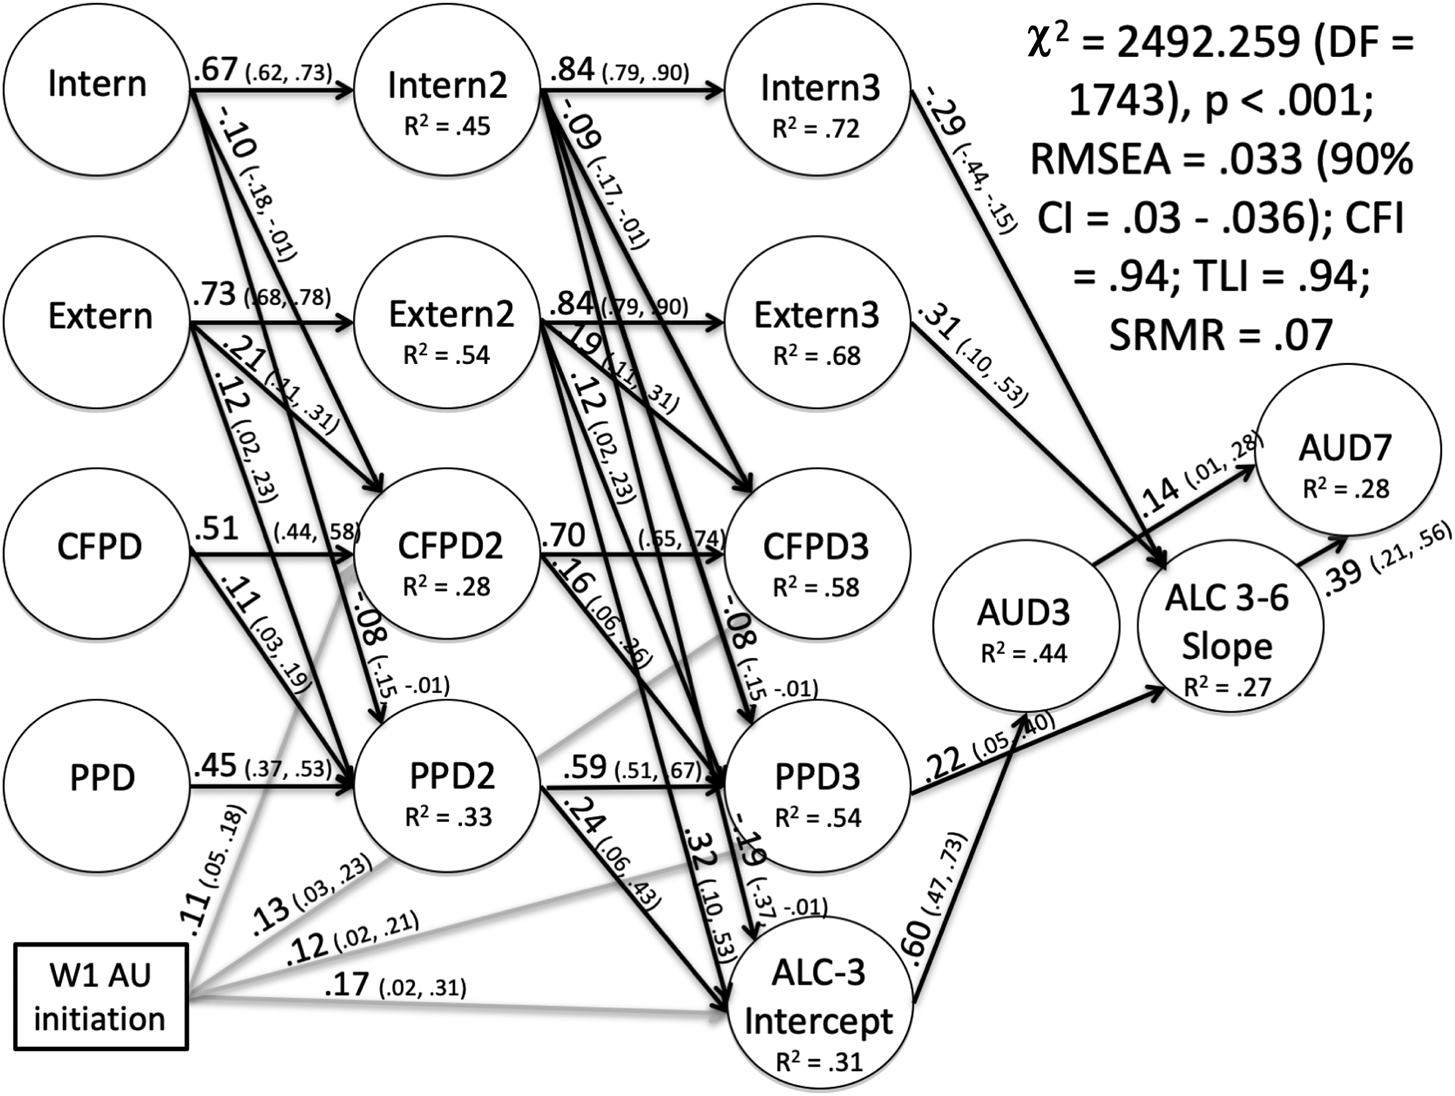
Second, final measurement models were combined into a baseline structural regression model, which is depicted in Figure 1. At this step, Satorra–Bentler nested chi-square tests were used to assess whether adding parameters improved fit. The baseline model included stability coefficients and within-wave covariance's and was compared with the subsequent models in which cross-lagged paths were added. Two final nested tests determined whether endogenous variances and within-wave covariances were time invariant. Third, 95% confidence intervals (CI) from the standardized final model were used to assess the effect size for each path. Inferences on competing theoretical paths were made based on the CI's. If a given CI did not contain 0, the path was deemed supportive of a given theory, and if the CI included 0, the path was deemed to be unsupportive of a given theory (Cummings, Reference Cumming2008, Reference Cumming2014). Effect size cutoffs for the standardized beta coefficients (small: Bs > .10 but < .30; medium: Bs > 0.30 but < 0.50; or large: Bs > 0.50) were used to describe point estimates for effect size (Cohen, Reference Cohen1988). Fourth, we estimated the final model again using 15,000 bootstraps and maximum likelihood with bias-corrected SEs to assess indirect effects, which spanned from W1 to W7.
Baseline structural model before adding lagged paths. Age and gender are included in the model as statistical control variables, but they are not presented in the figure. Age and gender covaried with all W1 constructs and were regressed on all outcomes after W1. The gray lines reflect covariances, and all variables within waves were allowed to covary with the exception of the problem behavior factors. Extern = pure externalizing, Intern = pure internalizing, Cooccur = co-occurring internalizing and externalizing symptoms, CFPD = close friend self-report of peer delinquency, PPD = Perceived Peer Delinquency or target report of peer delinquency, ALC Intercept = Alcohol Use at W3, ALC 3-6 Slope = growth curve for alcohol use, AUD = alcohol use disorder symptoms, and W = wave. The number behind each factor labels reflects wave of measurement.

Results
Measurement Models
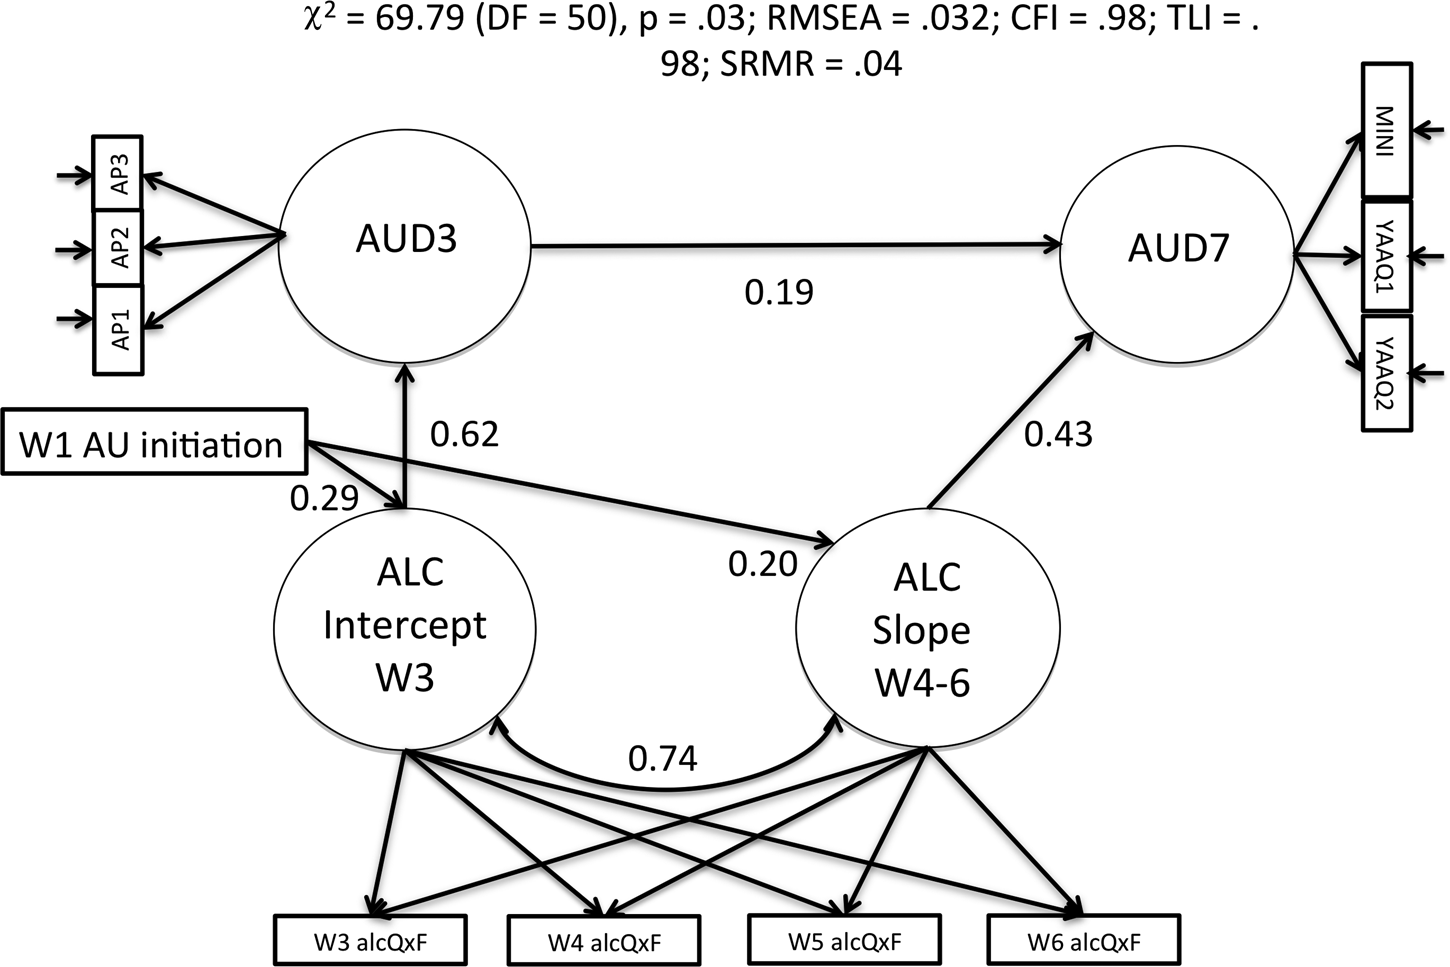
Tests of measurement invariance, fit, and figures for each of the three measurement models can be found in Appendix A (see Figures A1–A3). Briefly, fit was excellent for all three measurement models. The problem behavior measurement model was consistent with configural, metric, and scalar measurement invariance across waves, while perceived peer delinquency (PPD) was consistent with configural and metric measurement invariance but not scalar invariance. The close friend peer delinquency factors (CFPD) were consistent with configural but not metric and scalar invariance. The lack of measurement invariance for CFPD factors and lack of scalar invariance for PPD factors may be a function of normative age-related increases in peer delinquency. The AU LGCA suggested significant nonlinear increases in drinking that were steepest when youth entered high school. The intercept and slope had significant variability in levels of AU at W3 and growth in AU thereafter. The measures of AUD were different at W3 and W7, precluding tests of measurement invariance for the third measurement model. Next, these models were combined into a baseline structural regression model.
Full Structural Model
Baseline Model
The baseline model consisted of all measurement models with only paths from the covariates to all factors after W1, covariances between the covariates and the factors at W1, and the stability coefficients for all constructs. A nested test suggested that constraining stability paths for the bifactors did not result in a decrement in model fit, ∆χ2 (3) = 0.78, p = .85, and these constraints were retained. The covariances between the problem behavior factors were constrained to be 0 within waves and a nested test supported the constraint, ∆χ2 (3) = 2.71, p .44. However, adding the other within-wave covariances improved model fit, ∆χ2 (22) = 221.91, p < .001. This model served as the baseline model with which subsequent models with lagged paths were compared (see Figure 1).
Adding Lagged Paths and Path Invariance
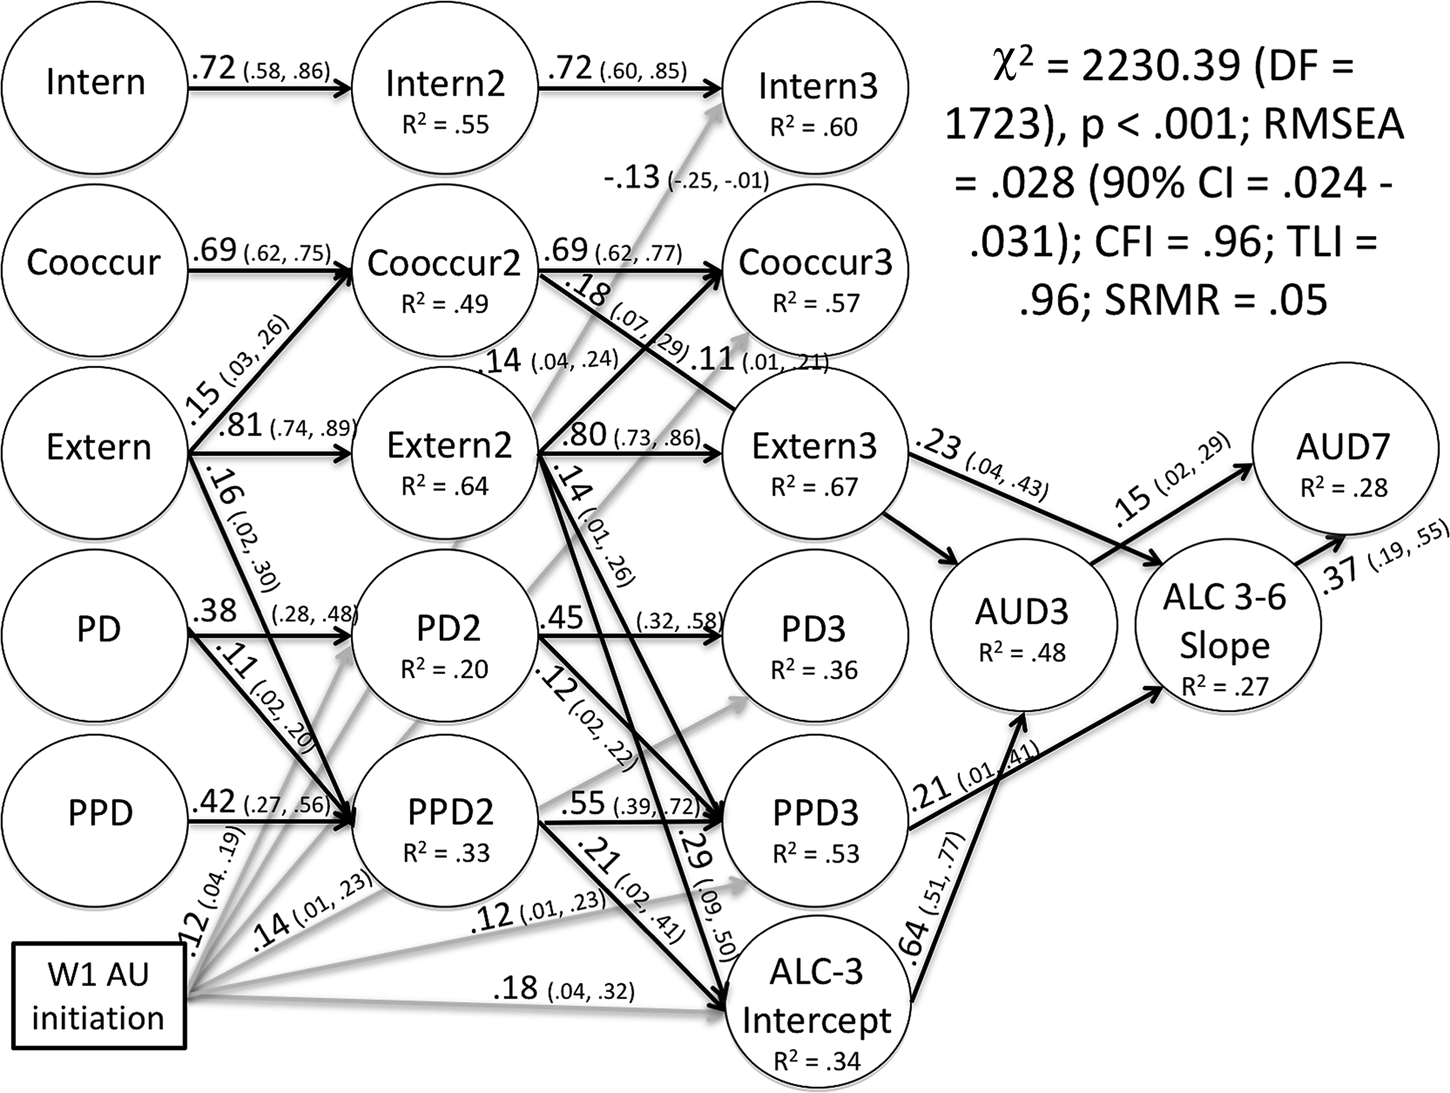
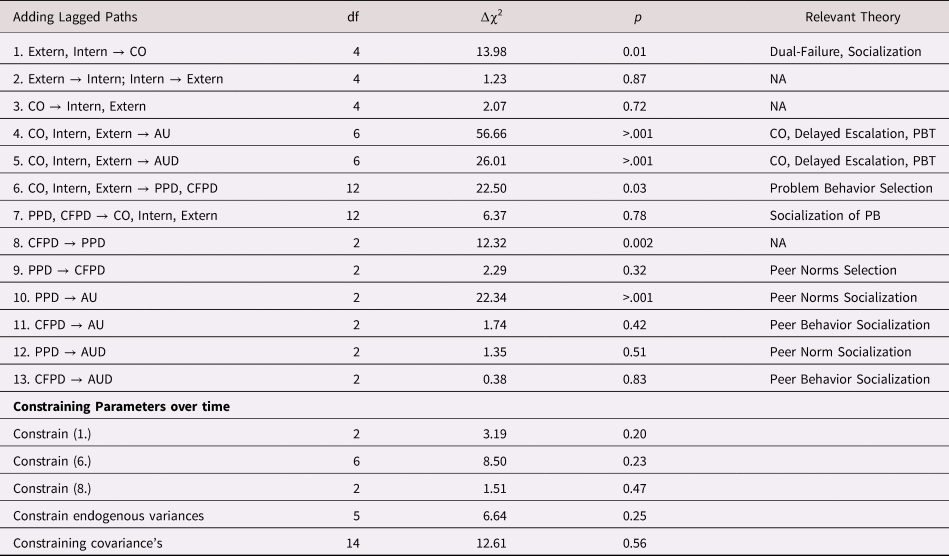
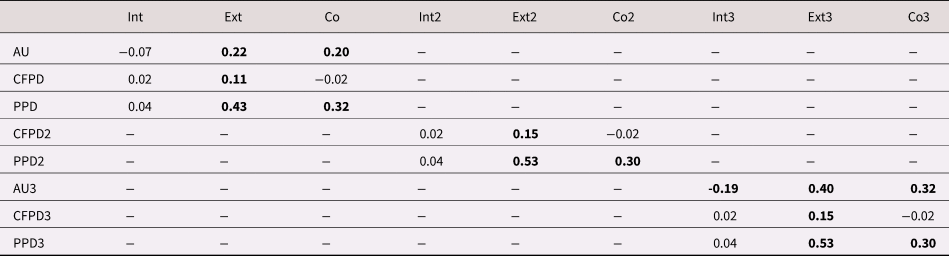
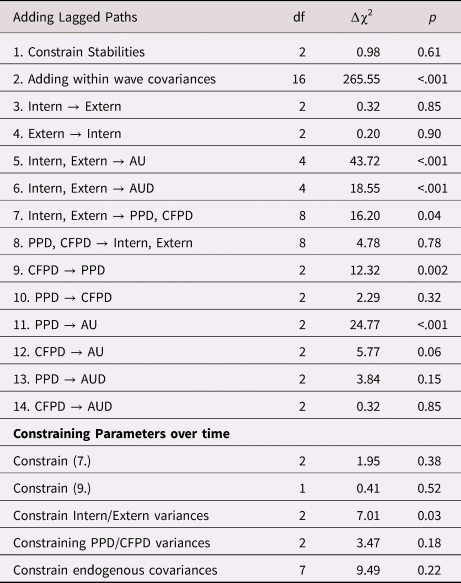
Next, lagged paths were added among the W1–W3 constructs to test specific theorized pathways. Added paths were tested for equality across waves. The nested tests are shown in Table 1, with labels for the theory that each set of paths tested. The final model is shown in Figure 2, with 95% confidence intervals for the standardized coefficients. The final model provided an excellent fit to the data, χ2 (1,723) = 2230.39, p < .001; RMSEA = .028, 90% CI = [0.024, 0.031]; CFI = .96; TLI = .96; SRMR = .05. Furthermore, measurement for problem behavior and PPD was equivalent across waves while all lagged paths and effects of covariates were time invariant, suggesting consistent measurement and structural paths across measurement periods. The within-wave correlations among the latent constructs can be found in Table 2. Interestingly, pure externalizing and co-occurring symptoms had similar-sized correlations with both AU and PPD (small to large), but not with CFPD, while the correlations between pure internalizing symptoms and all of the constructs with the exception of AU at W3 were so small that they were not detectable with our sample. Pure internalizing symptoms had a small negative correlation with AU at W3.
Estimated standardized path coefficients and 95% confidence intervals for the full model predicting alcohol use and alcohol use disorder. Age and gender were included in the model as statistical control variables, but they are not presented in the figure. With the exception of the problem behavior factors, all of the constructs were allowed to covary within waves. All coefficients are standardized and only those that were deemed significant (CI did not contain 0) are shown. The interval in parentheses after each standardized coefficient is the 95% confidence interval for the standardized coefficient. Extern = pure externalizing, Intern = pure internalizing, Cooccur = co-occurring internalizing and externalizing symptoms, CFPD = close friend self-report of peer delinquency, PPD = Perceived Peer Delinquency or target report of peer delinquency, ALC-3 Intercept = Alcohol Use at W3, ALC 3-6 Slope = growth curve for alcohol use, AUD = alcohol use disorder symptoms, and W = wave. The trailing number of each factor label reflects wave of measurement.

Nested Satorra–Bentler chi-square difference tests and associated df and p values for adding lagged paths between constructs across waves

Note: → = direction of effect, Extern = externalizing symptoms, Intern = internalizing symptoms, Co = Co-occurring internalizing and externalizing symptoms, AU = alcohol use, AUD = alcohol use disorder, PPD = perceived peer delinquency, CFPD = close friend peer delinquency, df = degrees of freedom, ∆χ2 = Santora–Bentler chi-square difference test, NA = not available, Delayed Escalation = Delayed onset and escalation theory, PB = Problem Behavior, PBT = Problem Behavior Theory, CO = co-occurring hypothesis. Total sample size = 387.
Within-wave correlations between problem behavior factors, peer delinquency, and alcohol use

Note: Bolded correlations are significant (p < 0.05). Int = internalizing symptoms, Ext = externalizing symptoms, Co = Co-occurring internalizing and externalizing symptoms, AU = alcohol use, PPD = perceived peer delinquency, CFPD = close friend peer delinquency, Total sample size = 387.
Final model
Figure 2 depicts the final model, with path coefficients and 95% confidence intervals (CI) for the paths in which the effect size estimates did not contain zero. Pure externalizing symptoms had the largest stability coefficients (large), followed by pure internalizing (large), co-occurring symptoms (large), PPD (moderate to large), and CFPD (moderate to large). Pure externalizing symptoms had a positive and consistent effect on co-occurring symptoms in the small-effect size range, while the association of pure internalizing symptoms with later co-occurring symptoms was too small to be detected with our sample, ß = 0.08, 95% CI [-0.02, 0.17]. These paths support the dual failure model, but they do not support the notion that pure internalizing symptoms can lead to co-occurring symptoms. Pure externalizing symptoms also had a small to moderate and consistent effect on PPD such that high levels of externalizing symptoms were prospectively associated with higher levels of peer delinquency. In contrast, the association between internalizing symptoms and PPD was too small to be detected by our sample, ß = -0.01, 95% CI [-0.09, 0.07]. The results support prior literature linking externalizing problems to the perception that peer delinquency is normative but did not support the notion that internalizing symptoms alone lead to perceived peer delinquency. Close friend peer delinquency had a small, consistent effect on PPD, suggesting that prior peer self-reported delinquency precedes perceptions of peer delinquency (socialization).
Pure externalizing symptoms at W2 predicted the AU intercept at W3, pure externalizing symptoms at W3 predicted the AU slope (W4–W6), and the same pattern was observed for PPD at W2 and W3. High levels of externalizing symptoms and PPD were associated with higher levels of AU at W3 and steeper growth in AU thereafter. The effect sizes ranged from small to moderate. In contrast, the associations of internalizing symptoms alone with the AU intercept at W3, ß = -0.01, 95% CI [-0.18, 0.16], and the AU slope (W4–W6), ß = -0.13, 95% CI [-0.29, 0.03], were too small to be detected with our sample. These paths support problem behavior and socialization theories by demonstrating consistent cross-lag paths between pure externalizing symptoms, peer delinquency, and AU, but they did not support the delayed onset and rapid escalation hypothesis.
Although co-occurring symptoms at W2 did predict the AU intercept at W3 before the paths from W2 PPD were added, the point estimate dropped and the 95% CI was wider in the final model when PPD was added, ß = 0.01, 95% CI [-0.14, 0.15]. This suggests that perceptions of peer delinquency outperformed and confounded co-occurring symptoms in the prediction of AU. However, co-occurring symptoms did have a direct effect on AUD at W3, and this was the only problem behavior factor to have had a direct effect on AUD. Higher levels of co-occurring symptoms were associated with higher levels of AUD symptoms with small effect size. Co-occurring symptoms at W3 did not predict growth in AU, ß = -0.03, 95% CI [-0.16, 0.11]. The pattern of results suggests that the association of co-occurring symptoms and not pure internalizing symptoms, ß = -0.08, 95% CI [-0.19, 0.04] with AUD was large enough to be detectable in our sample, providing more empirical support for the co-occurring hypothesis than for the delayed onset rapid escalation hypothesis.
The AU intercept at W3 had a strong effect on AUD at W3, the AU slope had a moderate effect on AUD at W7, and AUD at W3 had a small effect on AUD at W7. Perhaps not surprisingly, early AU was also related to later problem behavior, but the pattern was different than that shown in prior studies (e.g., Hicks et al., Reference Hicks, Durbin, Blonigen, Iacono and McGue2012). That is, early AU had a small negative effect on W3 pure internalizing symptoms and a small positive effect on W3 co-occurring symptoms.
Testing Mediation
Of interest were several paths that map on to hypothesized cascades from externalizing to AU and AUD through peer delinquency (a large literature), from pure internalizing/externalizing to AU and AUD through co-occurring symptoms (dual failure model, co-occurring hypothesis, as well as delayed onset and rapid escalation), and from early AU to AUD through problem behavior and the two measures of peer delinquency (selection and socialization). Stability paths were also of interest. For instance, paths from W1 pure internalizing to W2 pure internalizing to W3 pure internalizing to AU and AUD can provide a test of whether stability in pure internalizing symptoms leads to increases in AU and AUD later in adolescence and whether the effects are mediated by peer delinquency (delayed onset and escalation).
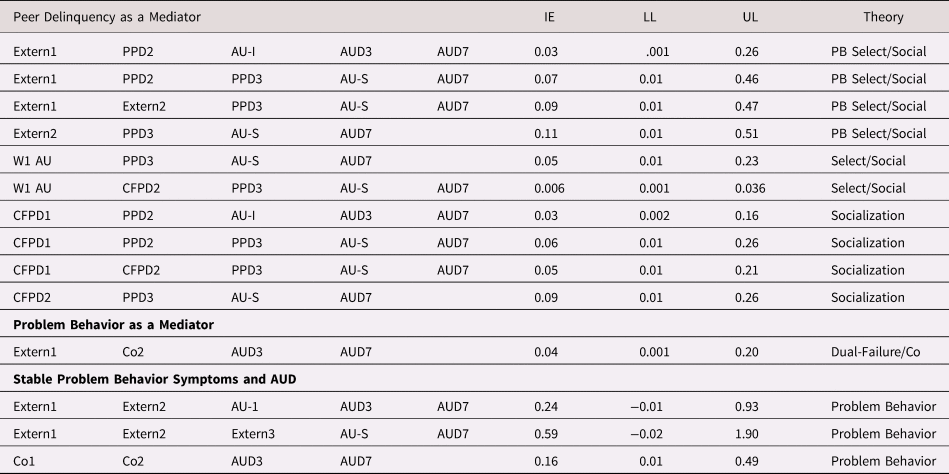
Table 3 contains estimates, 95% bias corrected confidence intervals for the indirect effects, and the specific theory or theories that each path tested. Consistent with prior literature, peer delinquency mediated the effect of pure externalizing symptoms on levels of AU at W3 as well as growth in AU from middle to late adolescence and AUD at W7. Furthermore, these effects were consistent across the repeated measures of both pure externalizing symptoms and peer delinquency. In contrast, pure internalizing symptoms did not consistently predict any peer delinquency or AU outcome, nor did pure internalizing symptoms consistently predict co-occurring symptoms. Results for internalizing were also consistent across the repeated measures, and the lack of associations suggested that the mediation paths involving pure internalizing symptoms were too small to be detected with our sample. These results support problem behavior theory and socialization theory, but they did not support the delayed and rapid escalation hypothesis. There were additional mediated effects from early AU (W1) to AUD (W7) through both PPD and CFPD, supporting selection/homophily models in which adolescents choose friends based on common engagement in AU or delinquent behavior. Furthermore, these effects were replicated across reporters. With respect to peer delinquency, CFPD also affected AUD at W3 and W7 through PPD and these results were consistent across repeated measures as well, suggesting that peer reports of their own behavior only had an effect on AU and AUD through perceptions of peer delinquency.
Indirect effects and associated 95% confidence intervals using 15,000 bootstraps and bias-corrected SEs.

Note: Extern = externalizing symptoms, Co = Co-occurring internalizing and externalizing symptoms, PPD = perceived peer delinquency, CFPD = close friend peer delinquency, AU-I = alcohol use intercept (W3), AU-S = alcohol use slope (W3–W6), AUD = alcohol use disorder, # reflects measurement wave, IE = indirect effect, LL = lower limit, UL = upper limit, PB = Problem Behavior, Select/Social = Selection then Socialization, Co = co-occurring hypothesis. Total sample size = 387.
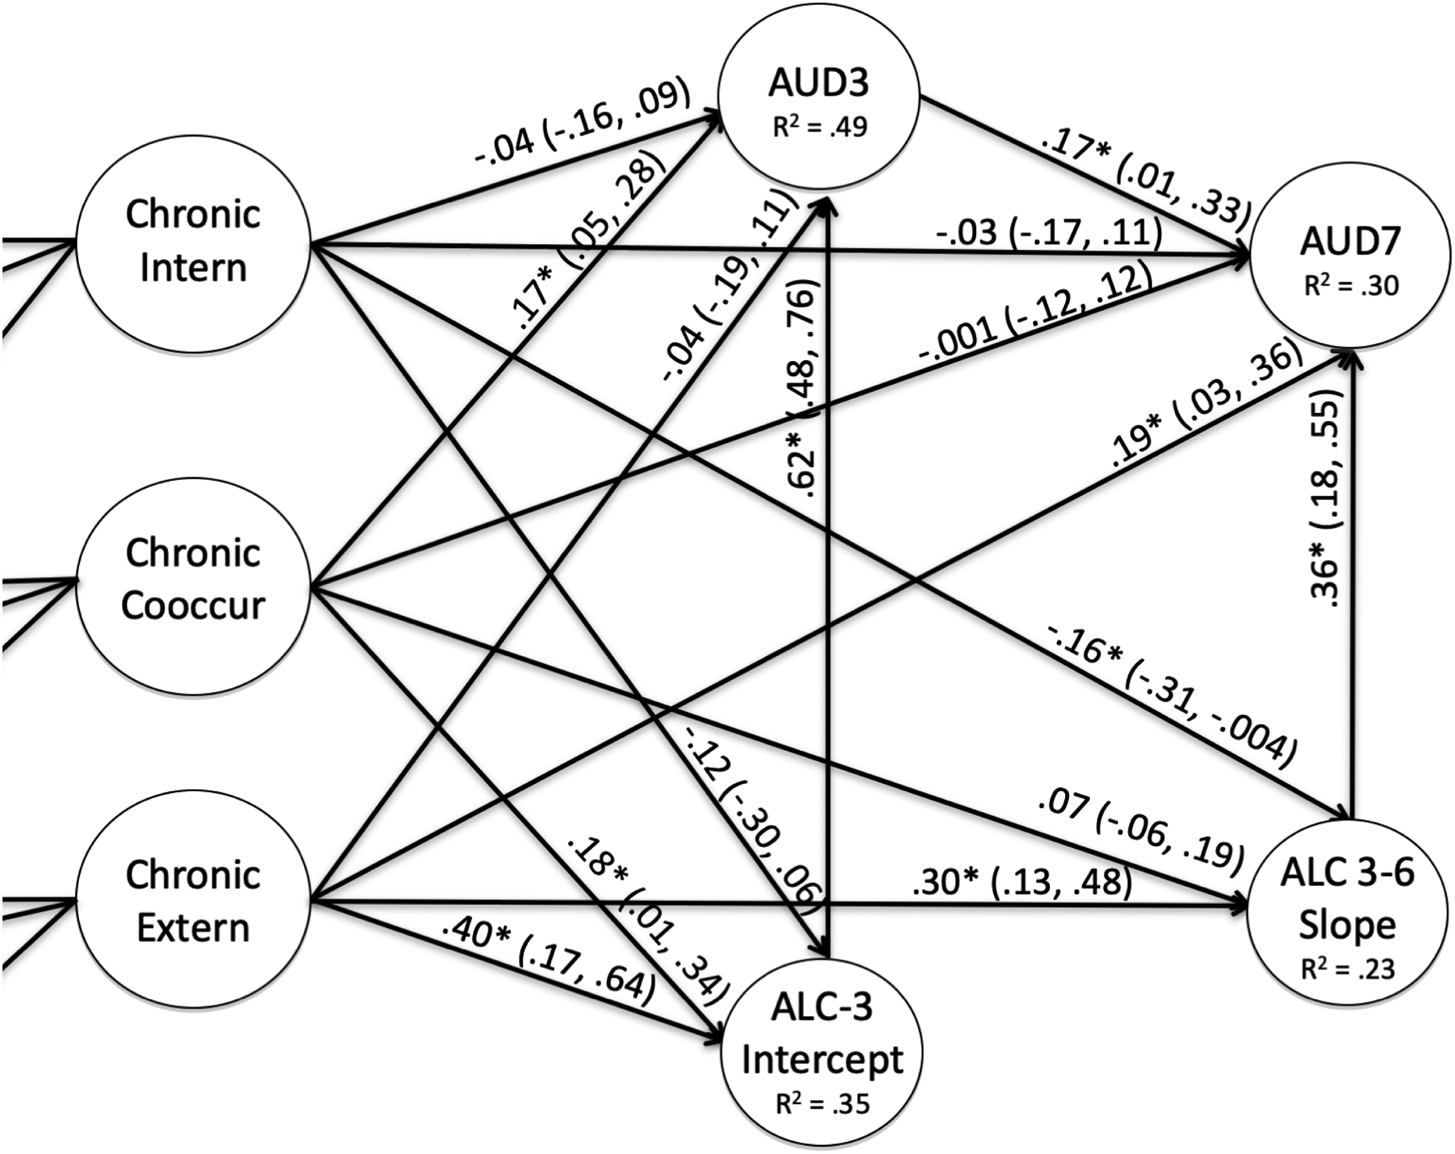
Given that levels of co-occurring symptoms were the only problem behavior factor that had a detectable direct effect on an AUD (W3) outcome, co-occurring symptoms was the only candidate for problem behavior mediation of AUD. Co-occurring symptoms mediated the effect of pure externalizing symptoms on later AUD suggesting that a dual-failure pattern is one mechanism of the relationship between pure externalizing symptoms and AUD. In fact, pure externalizing symptoms only had indirect effects on AUD through either peer delinquency (Mage = 12.6 and 13.6 at W2 and W3, respectively), the AU intercept (M age = 13.6), co-occurring symptoms (Mage = 12.6), or growth in AU (growth from 13.6 to 17.9 on average). Although chronic problem behavior symptoms have been argued to be particularly risky for youth (Hussong et al., Reference Hussong, Jones, Stein, Baucom and Boeding2011), the indirect effects assessing stability in problem behavior symptoms to AU and AUD were not tenable for pure internalizing symptoms given that associations involving internalizing symptoms and our outcomes were too small to be detected. Furthermore, the 95% CI for the mediated effect from stable pure externalizing symptoms to AU and AUD overlapped with zero. However, stable co-occurring symptoms did have a small direct effect on AUD at W3, which predicted AUD at W7. The results suggest that co-occurring symptoms explained variance in AU and AUD, whereas this was not the case for pure internalizing or externalizing symptoms. The pattern of results provided support for the co-occurring hypothesis, while providing limited support for the delayed onset and rapid escalation hypothesis.
Alternative Models
Two-Factor Model for Internalizing and Externalizing Symptoms
Similar to all modeling approaches, bifactor models have limitations. They are subject to overfitting and nuance covariance (Bonifay, Lane, & Reise, 2018). Therefore, we estimated an alternative model in which only two factors were modeled for internalizing and externalizing symptoms. Subsequently, we went through a similar series of nested tests to determine pathways between problem behavior, peer delinquency, AU and AUD (see Appendix B for details). Although some of the path coefficients in this model differed from those found in our main analysis, they all point to similar inferences regarding the theories tested. Externalizing symptoms initiates a cascade that affects peer delinquency and subsequent AU, both of which make AUD more likely. In contrast, associations between internalizing symptoms and peer delinquency, AU, and AUD were either undetectable or protective depending on whether a bifactor or a two-factor model was used to test hypotheses. Importantly, there is a limitation of the two-factor model: co-occurring variance is being partialled out of beta coefficients and indirect effects. When this is considered in the context of the bifactor model, it suggests that externalizing symptoms suppress the effect of internalizing symptoms when co-occurring symptoms aren't modeled explicitly (see Foster et al., Reference Foster, Hicks and Zucker2018 for a similar pattern). Furthermore, by not considering co-occurring symptoms, less overall variance was explained in problem behavior and AUD.
Hierarchical Model and Other Models
Mediation pathways and stability coefficients were used to test the effect of chronic problem behavior symptoms on AU and AUD. A better method would be to create higher-order factors for each longitudinal construct (pure internalizing symptoms, pure externalizing symptoms, co-occurring symptoms, and both peer delinquency constructs) and to test paths from the hierarchical factors to AU and AUD. We tested such a model, and the results can be found in Appendix B. Here again, the bifactor model fit better and the results lead to the same basic conclusions. Chronic co-occurring symptoms directly predicted AUD, while associations between chronic pure internalizing and externalizing symptoms and AUD were undetectable.
Discussion
In this study, we tested different theoretical conceptualizations of developmental pathways from problem behavior to AUD through theoretical mediators such as changes in problem behavior, changes in peer delinquency (perceived and actual peer behavior), and changes in AU. The results supported three pathways that were consistent with four theories: the problem behavior theory, the dual failure model, the co-occurring hypothesis, and selection and socialization theory. To simplify, the mediation pathways were labeled according to the theories they supported and will be discussed in separate sections below. First, the externalizing pathway, started with pure externalizing symptoms and ended with AUD, but it was mediated by the development of co-occurring symptoms and peer delinquency. The former finding is novel in that it links the development of internalizing symptoms secondary to externalizing symptoms to early AUD symptoms while simultaneously supporting prior research on the importance of peer delinquency as a mediator of externalizing symptoms and AU and AUD (Dishion, Reference Dishion2000; Dishion & Skaggs, Reference Dishion and Medici Skaggs2000; Scalco et al., Reference Scalco, Colder, Hawk, Read, Wieczorek and Lengua2014; Zucker, Reference Zucker and Sameroff2016). The second pathway was labeled the stable co-occurring pathway and involved stable co-occurring symptoms affecting AUD directly in early to middle adolescence. Taken together, these two pathways involving problem behavior suggest that internalizing and externalizing pathways are not distinct in adolescence, as is often discussed in the literature, and that externalizing symptoms in the presence of internalizing symptoms bifurcates in early adolescence. Third, there were pathways from early AU and peer delinquency through later peer delinquency (across reporters) and AU, respectively, consistent with both selection/homophily and socialization/influence theories. Each of these pathways were associated with a small to moderate effect size and produced confidence intervals that ranged from small to moderate.
In interpreting the results in reference to theory, it also important to consider the paths that did not account for variance in AU and AUD. For instance, in no case did internalizing symptoms alone have a consistent positive or negative effect on any outcome related to co-occurring symptoms (development of externalizing symptoms), peer delinquency, AU, or AUD. Furthermore, the confidence intervals suggest that the effect of internalizing symptoms on peer delinquency, AU, or AUD will most often be close to zero or negative and small. Peer delinquency also did not have a consistent positive or negative effect on later problem behavior, yet it consistently predicted AU and AUD with a small effect size. The results supported the integration of (a) the dual failure model (Capaldi, Reference Capaldi1991, Reference Capaldi1992); (b) theories that emphasize externalizing symptoms, peer problems, and the negative sequelae of both externalizing symptoms and early AU (Chassin et al., Reference Chassin, Colder, Hussong, Sher and Sameroff2016; Dodge et al., Reference Dodge, Malone, Lansford, Miller, Pettit and Bates2009; Lahey & Waldman, Reference Lahey, Waldman, Beauchaine and Hinshaw2017; Zucker, Reference Zucker and Sameroff2016); and (c) the chronic co-occurring hypothesis, which is based on prior empirical work demonstrating the importance of co-occurring symptoms and lack of an effect of internalizing symptoms alone (Colder et al., Reference Colder, Scalco, Trucco, Read, Lengua and Wieczorek2013, Reference Foster, Hicks and Zucker2018; Fosters et al., Reference Foster, Hicks and Zucker2018; Mason et al., Reference Mason, Hitchings and Spoth2008; Scalco et al., Reference Scalco, Colder, Hawk, Read, Wieczorek and Lengua2014). However, the results did not support the delayed onset and rapid escalation hypothesis (Hussong et al., Reference Hussong, Jones, Stein, Baucom and Boeding2011, Reference Hussong, Ennett, Cox and Haroon2017). Each of these pathways and their implications are discussed in turn.
Externalizing Symptoms Pathway
Pathways from externalizing symptoms alone to co-occurring symptoms and peer delinquency and then to AUD and AU, respectively, link different literatures on AU and AUD. The first is on the development of internalizing symptoms as a function of both pure externalizing symptoms (Capaldi, Reference Capaldi1991, Reference Capaldi1992; Chassin et al., Reference Chassin, Pitts, DeLucia and Todd1999; Lahey & Waldman, Reference Lahey, Waldman, Beauchaine and Hinshaw2017) and early AU (Hicks et al., Reference Hicks, Durbin, Blonigen, Iacono and McGue2012; Scalco, Reference Scalco2017). The second literature is the well-documented externalizing pathway in which peer factors (rejection and selection) mediate increases in AU (Dishion, Reference Dishion2000; Dishion & Skaggs, Reference Dishion and Medici Skaggs2000; Jessor & Jessor, Reference Jessor and Jessor1977; Scalco et al., Reference Scalco, Colder, Hawk, Read, Wieczorek and Lengua2014) as well as other substances (Chassin et al., Reference Chassin, Colder, Hussong, Sher and Sameroff2016; Dodge et al., Reference Dodge, Malone, Lansford, Miller, Pettit and Bates2009; Scalco et al., Reference Scalco, Colder, Hawk, Read, Wieczorek and Lengua2014). Perhaps internalizing symptoms that develop as a function of pure externalizing symptoms combined with AU and peer delinquency creates a context that supports negative reinforcement of AU (e.g., self-medication) and positive reinforcement of AU behaviors by peers, resulting in rapid escalation in AU and eventually AUD during adolescence.
Another interesting pattern may be related to this externalizing pathway. In our model, pure externalizing symptoms at W1 were moderately correlated with early AU, while early AU had a small effect on later co-occurring symptoms. Neurobiological theories emphasize that exposure to AU results in neurobiological changes that strengthen negative reinforcement pathways to AUD (Everitt & Robins, Reference Everitt and Robbins2005; Khantzian, Reference Khantzian1997; Koob & LeMoal, Reference Koob and Le Moal2008). The behavioral manifestations of these neurobiological changes overlap with both internalizing and externalizing symptoms (e.g., anhedonia, irritability, frustration, anxiety, rigidity) providing credence to the finding that early AU predicted co-occurring symptoms and not pure internalizing or externalizing symptoms. This line of reasoning would suggest that pure externalizing symptoms bifurcate into different developmental pathways in adolescence depending on AU and the development of co-occurring internalizing symptoms. One pathway involves pure externalizing behavior and peer problems while the other pathway involves the same starting point, but it results in the development of co-occurring symptoms and earlier AUD and does not involve close friend delinquency.
Stable Co-Occurring Symptoms Pathway
Stable co-occurring symptoms across late childhood and early adolescence, but not stable internalizing symptoms, predicted AUD directly, while neither set of chronic symptoms prospectively predicted AU. However, co-occurring symptoms at W1 had a moderate association with early AU, whereas pure internalizing symptoms did not. As such, some youth with co-occurring symptoms initiated drinking early (M age = 12) and had stable co-occurring symptoms, which had a direct effect on early AUD symptoms (M age = 14). Furthermore, early AU exacerbated later co-occurring symptoms, which suggests a transactional relationship between co-occurring symptoms and AU and AUD in early adolescence.
Given the complexity of interpreting the co-occurring factor (Snyder, Young, & Hankin, Reference Snyder, Young and Hankin2017) and bifactors in general (see Bonifay, Lane, & Reise, Reference Bonifay, Lane and Reise2017), there are several possible interpretations of this pathway. First, it is possible that this pattern of associations is best accounted for by self-medication. That is, negative affect has a stronger correlation with co-occurring symptoms than pure internalizing or externalizing symptoms alone (Tacket et al., Reference Tackett, Lahey, Van Hulle, Waldman, Krueger and Rathouz2013) and co-occurring symptoms are also associated with social stress including alienation from parents and rejection from peers (Keiley et al., Reference Keiley, Lofthouse, Bates, Dodge and Pettit2003; Ingoldsby et al., Reference Ingoldsby, Kohl, McMahon and Lengua2006; Scalco et al., Reference Scalco, Trucco, Colder, Lengua, Wiezcorek and Hawk2012). The combination of negative affect and social stress may lead to drinking alcohol to cope with emotional distress (Hussong et al., Reference Hussong, Jones, Stein, Baucom and Boeding2011), and coping-motivated drinking is more strongly associated with problems than levels of drinking (Kuntsche, Knibbe, Gmel, & Engels, Reference Kuntsche, Knibbe, Gmel and Engels2005). Second, there is empirical evidence and theory suggesting that the co-occurring factor reflects stable dysregulation in cognitive, behavioral, and emotional domains (Caspi et al., Reference Caspi, Houts, Belsky, Goldman-Mellor, Harrington, Israel and Moffitt2014; Haltigan et al., Reference Haltigan, Aitken, Skilling, Henderson, Hawke, Battaglia and Andrade2018; Laceulle, Vollebergh, & Ormel, Reference Laceulle, Vollebergh and Ormel2015; Snyder et al., Reference Snyder, Young and Hankin2017). Moreover, validity analyses in the current sample support this point (see Appendix A). For example, co-occurring symptoms were related to facets of effortful control and impulsivity similar to pure externalizing symptoms but were also related to social anxiety and fear similar to pure internalizing symptoms. Therefore, an alternative interpretation is that youth with co-occurring symptoms have higher levels of dysregulation across multiple domains that would increase risk for AUD even in the absence of peers that are engaging in AU or in the absence of higher levels of AU.
Selection and Socialization Pathways
Pathways from peer delinquency (perceived peer delinquency and peer-reported peer delinquency) and early AU to early AU and peer delinquency, respectively, add to the literature linking friend selection and socialization/influence to increases in both peer delinquency and AU (Dishion & Skaggs, Reference Dishion and Medici Skaggs2000; Haynie & Osgood, Reference Haynie and Osgood2005; Osgood et al., Reference Osgood, Ragan, Wallace, Gest, Fienberg and Moody2013; Scalco et al., Reference Scalco, Trucco, Coffman and Colder2015). In some pathways selection preceded socialization, while in others socialization preceded AU and the perception that peer delinquency was normative. First, pure externalizing symptoms and early alcohol use (age = 12) were associated with the perception that peer delinquency was normative and the tendency to affiliate with friends who engage in delinquency, respectively. Subsequently, perceived peer delinquency demonstrated a socialization/influence effect, which increased AU and AUD repeatedly from early to middle adolescence. Second, socialization effects were mediated by the perception that delinquency was normative. Social norms are likely an important driver of behavior in late childhood and early adolescence given the increased salience of peers that is associated with pubertal development (Spear, Reference Spear2011; Steinberg, Reference Steinberg2008).
Developmental Considerations and Future Directions
Interestingly, neither measure of peer delinquency was associated with later problem behavior and the overall pattern of findings suggests two important conclusions. First, peer delinquent behavior and perceptions of peer delinquency, including peer AU, mediates the heterotypic continuity of risky behavior from late childhood to middle adolescence. Second, the results supported multifinality and equifinality for AU and AUD. With respect to multifinality, externalizing symptoms alone led to a diversity of outcomes, including co-occurring symptoms, peer delinquency, AU, and AUD. The pathways that were related to equifinality were even more complex. Youth endorsing higher levels of pure externalizing, co-occurring symptoms, peer delinquency across reporters, and early AU were at higher risk for increases in AU and AUD in early and later adolescence. In fact, there were 12 pathways to AUD, four of which involved systematic mediation of problem behavior and AU and AUD by peer delinquency, seven of which did not involve problem behavior (selection and socialization pathways), and one in which problem behavior had a direct effect on AUD and therefore did not involve peer delinquency. In addition to supporting equifinality and multifinality, our results point to the importance of peer delinquency (perceived and peer behavior) as peer delinquency initiated or mediated every pathway but one (the chronic co-occurring pathway).
Mediation pathways in the current study assessed between-subject mediation from orthogonal dimensions of problem behavior (bifactor model) through peer delinquency from late childhood to middle adolescence. Furthermore, we assessed how the dynamics between these constructs in early adolescence affected later within person changes in AU and AUD in middle to late adolescence. Prior research indicates that problem behavior, peer delinquency, and AU transact into later adolescence and young adulthood (e.g., Reinke, Eddy, Dishion, & Reid, Reference Reinke, Eddy, Dishion and Reid2012). Furthermore, it is possible that a self-medication pathway to AU and AUD and support for the delayed onset hypothesis may emerge later in young adulthood once alcohol is legal to drink. Future work may benefit from considering sequential mediation with problem behavior and peer delinquency into late adolescence and through young adulthood.
Given our motivation to assess sequential mediation and delineate pure and continuous dimensions of problem behavior, we focused our data-analytic approach on between-person associations and did not address within-subject change in problem behavior or peer delinquency. Different methods (growth modeling, growth mixture modeling, latent state-trait models, and latent transition analysis) of modeling the heterogeneity of problem behavior, peer delinquency, and AU within and across time may yield a different pattern of results. Along these lines, future work may benefit from considering latent difference score or latent growth curve models with structured residuals to better model between- and within-subject change within the same model (Curran, Howard, Bainter, Lane, & McGinley, Reference Curran, Howard, Bainter, Lane and McGinley2014; McArdle, Reference McArdle2009).
Limitations
As with any empirical examination, the results should be understood within the context of certain limitations. First, our sample spanned late childhood to late adolescence and our results may not generalize to older samples. There is evidence that internalizing problems more consistently predict substance use in young adulthood (Hussong et al., Reference Hussong, Jones, Stein, Baucom and Boeding2011, Reference Hussong, Ennett, Cox and Haroon2017), although this has not been uniformly supported (Colder et al., Reference Colder, Frndak, Lengua, Read, Hawk and Wieczorek2018). It is possible that different age samples may yield different results. Perhaps when youth enter the legal drinking age, the theorized delayed onset with rapid escalation pathway would emerge.
Second, internalizing and externalizing problems are higher-order factors that are composed of multiple subdomains (e.g., anxiety, depression, rule breaking, aggression, etc.). Although there is little reason to suspect that the subdomains of externalizing problems in the present study would be differentially related to AU or AUD, subdomains of internalizing symptoms have been argued to be differentially related to AU and AUD across development (Hussong et al., Reference Hussong, Jones, Stein, Baucom and Boeding2011, Reference Hussong, Ennett, Cox and Haroon2017; Kaplow, Curran, Angold, & Costello, Reference Kaplow, Curran, Angold and Costello2001). If different patterns of co-occurrence across subdomains of internalizing problems and externalizing problems were uniquely related to AU, peer delinquency, or AUD, our results may mask those effects. Future research may benefit from considering more specific patterns of co-occurrence, AU, peer delinquency, and AUD.
Third, self-medication theories posit that alcohol use relieves a negative emotional state in the moment, so it is negatively reinforcing given the emotional context. Such reinforcement patterns occur on a time scale of days and not years, as we have modeled. Future work may consider measuring internalizing and externalizing symptoms by using ecological momentary assessment during critical periods of development for initiation and escalation of AU to continue to disentangle the relationship between problem behavior, AU, and AUD.
Finally, although we did adjust for gender as a covariate, we were unable to test for gender differences given the complexity of our structural model and the sample size. Some work suggests that males are at increased risk for the development of externalizing symptoms and AUD, while females are at increased risk for the development of internalizing symptoms. Future work may benefit from considering gender as a moderator of the pathways that we tested.
Conclusions
Notwithstanding the limitations, the results provide evidence that supports the integration of several theories and hypotheses in the literature on the development of AU and AUD during adolescence. These theories include problem behavior theory, the co-occurring hypothesis, the dual failure hypothesis, and socialization and selection theory. The results supported externalizing symptoms in the absence of internalizing symptoms as being the riskiest dimension of problem behavior symptoms, with moderate effects (problem behavior theory). While co-occurring internalizing and externalizing symptoms also conferred risk for AUD (co-occurring hypothesis), internalizing symptoms in the absence of externalizing symptoms did not provide risk, resulting in limited support for the delayed onset and rapid escalation hypothesis. In addition to supporting theories that emphasize externalizing symptoms, our results identified specific mediators: (a) increases in internalizing symptoms or the development of co-occurring symptoms (dual-failure hypothesis and consequences of aggressive and rule breaking behavior) and (b) peer delinquency (selection and socialization theory).
Early AU negatively predicted later internalizing symptoms alone, suggesting that early AU reduced risk for pure internalizing symptoms. In contrast, early AU increased risk for later co-occurring symptoms, suggesting a transactional relationship between AU, co-occurring symptoms, and AUD. Given that co-occurring symptoms may more consistently map on to the affective changes posited to result from heavy AU and AUD (e.g., Koob & Le Moal, Reference Koob and Le Moal2008), our results suggest that future work should carefully model the distinction between internalizing and externalizing problem behavior when assessing cross-sectional, longitudinal, and transactional effects between problem behavior, AU, AUD, and peer delinquency. We used a bifactor model to test our hypotheses, and this approach has the advantage of allowing researchers to consider co-occurring symptoms and lagged associations from pure forms of problem behavior to co-occurring symptoms while maintaining continuous dimensions and latent constructs.
Our results also have implications for prevention and treatment. It may be best for substance use prevention programs to focus on youth with pure externalizing symptoms and youth with co-occurring internalizing and externalizing symptoms. Youth with these symptom presentations may benefit from specific treatments given the identified pathways. First, youth with externalizing symptoms alone and youth with co-occurring symptoms may benefit from normative feedback interventions, which seek to correct adolescent misperceptions of peer substance use and other peer behaviors (Lewis & Neighbors, Reference Lewis and Neighbors2006). It is important to note that normative feedback interventions have demonstrated iatrogenic effects in some instances (Miller, Meier, Lombardi, & Leffingwell, Reference Miller, Meier, Lombardi and Leffingwell2015; Schultz, Nolan, Cialdini, Goldstein, & Griskevicius, Reference Schultz, Nolan, Cialdini, Goldstein and Griskevicius2007), so they should only focus on youth with specific symptom constellations. Treatments for adolescence substance use disorder may also benefit from adding interventions that target friend selection in late childhood as well as ameliorating co-occurring symptoms (anhedonia, irritability, and rigidity). Given the pathways that were identified in the present analysis, integrating cognitive-behavioral therapies for internalizing symptoms, family therapies (multidimensional family therapy) and behavioral therapies (dialectic behavioral therapy) for externalizing symptoms, and normative feedback interventions for perceptions of peer delinquency may be relevant to both prevention and treatment efforts (Hawkins, Reference Hawkins2009; Hulvershorn, Quinn, & Scott, Reference Hulvershorn, Quinn and Scott2015; Liddle, Reference Liddle2010; Waldron & Turner, Reference Waldron and Turner2008).
Acknowledgments
We thank Samuel Meisel who provided comments and Miranda Evans who helped with preparation of the manuscript. We are grateful to the parents and children who participated in this study.
Financial Support
This research was funded by a grant from the National Institute on Drug Abuse (R01 DA020171), awarded to Dr. Craig R. Colder.
Appendix A
Measurement Models for Problem Behavior, Peer Delinquency, AU, and AUD
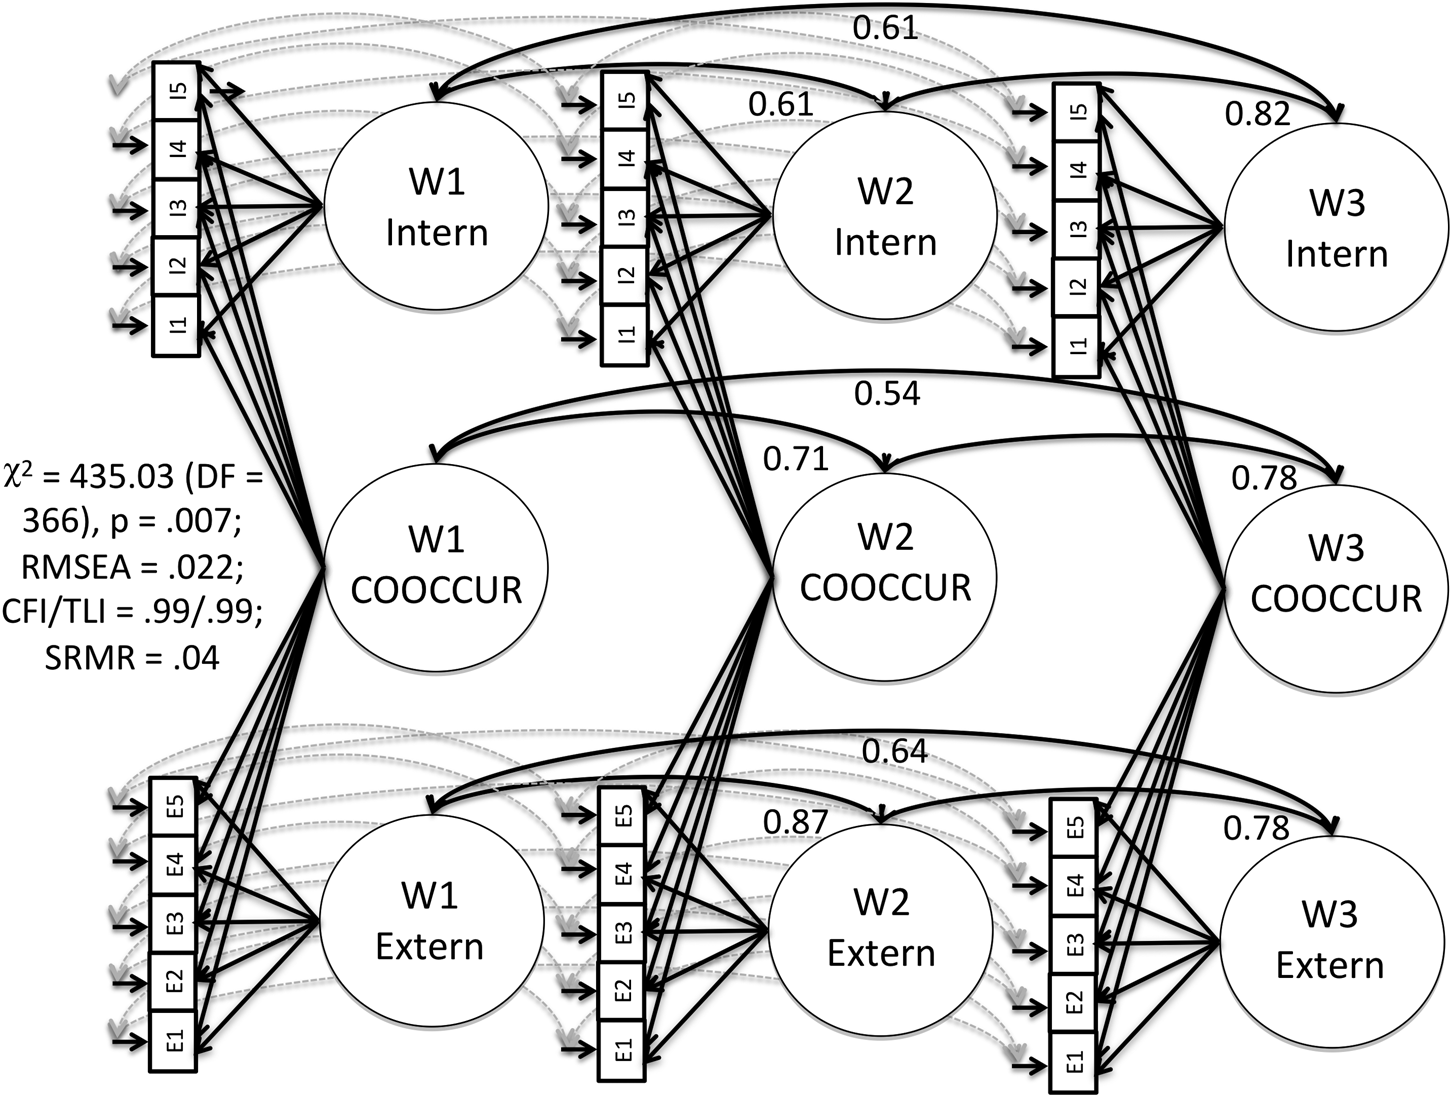
Figure A.1 shows the basic measurement model for the problem behavior factors. Satorra–Bentler nested chi-square tests suggested that adding auto-covariances among the same indicators across waves improved model fit, ∆χ2 (30) = 265.29, p < .01, while constraining factor loadings, error variances, intercepts and autocovariances to be equal across time did not result in a decrement in model fit, ∆χ2 range (df range = 16–34) = 0.59–33.50, all ps > .17. The final model with factor loading, error variance, intercepts, and autocovariance equality constraints fit the data well: χ2 (366) = 435.03, p = .007; RMSEA = .022, 90% CI = [.013, .029]; CFI = .99; TLI = .99; and SRMR = .04. The standardized factor loadings ranged from 0.05 to 0.62Footnote 1 for the pure internalizing and externalizing factors, respectively, while loadings ranged from 0.44–0.81 for the co-occurring factors.
Bi-factor confirmatory factor analysis for problem behavior across three waves of longitudinal data and spanning ages 10–15. Statistically significant (p < .05) standardized coefficients are presented. Extern = pure externalizing, Intern = pure internalizing, Cooccur = co-occurring internalizing and externalizing symptoms, W = wave, I = internalizing bundle, and E = externalizing bundle.

Prior analysis of this sample assessed the validity of the problem behavior factor model (Evans, Scalco, Lengua, & Colder, Reference Evans, Scalco, Lengua and Colder2019). Repeated measures of parent-reported problem behavior and temperament and psychosocial risk reported by the adolescent from W1–W3 were used to assess the convergent and divergent validity of the bifactor model relative to a two-factor model in which internalizing and externalizing symptoms were modeled separately with no bifactor. Interestingly, when comparing the bifactor models with the two-factor models many of the correlations changed (78%), and in most cases the correlation flipped signs. As an example, the facets of effortful control were negatively related to internalizing symptoms in the two-factor model, but they were positively related to pure internalizing symptoms in the bifactor model, while other measures of internalizing symptoms had positive relationships with externalizing symptoms in the two-factor model but negative or nonsignificant relationships with pure externalizing symptoms in the bifactor model. Co-occurring symptoms were related to more overall psychosocial impairment than were the pure factors, but each pure factor was also related to impairment. For instance, co-occurring symptoms and pure externalizing symptoms similarly correlated with peer delinquency (across multiple reporters), alcohol, and tobacco use (small effects), while pure internalizing symptoms did not. In contrast, co-occurring symptoms and pure internalizing similarly correlated with social anxiety and social exclusion, while pure externalizing symptoms did not. Finally, co-occurring symptoms had a large correlation with peer victimization while both pure factors had small correlations. Overall, the results suggest that the bifactor model of problem behavior demonstrated much stronger divergent validity than the two-factor model yet both had consistent relationships with validators over time (convergent validity). Although each of the factors in the bifactor model were related to impairment, co-occurring symptoms had more and stronger relationships.
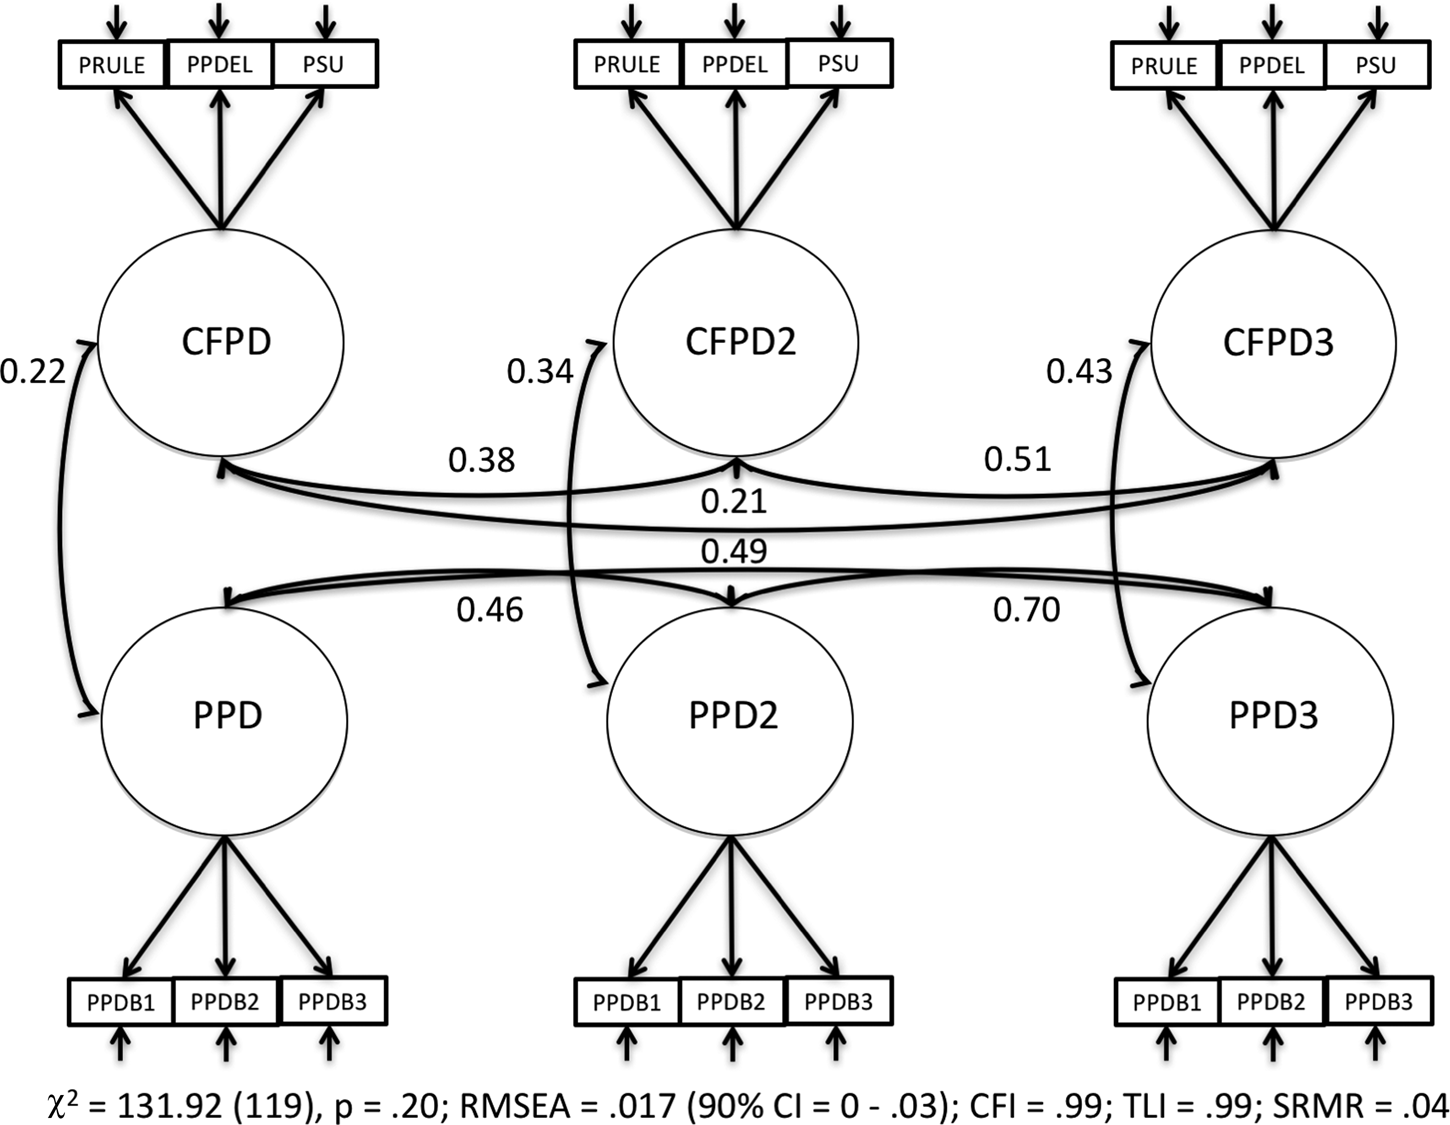
Next, we estimated the measurement model for perceived peer delinquency (PPD) and close friend peer delinquency (CFPD). Satorra–Bentler nested chi-square tests suggested that adding auto-covariances among the same indicators across waves improved model fit for PPD and CFPD, ∆χ2 (11) = 56.90, p < .01. Constraining factor loadings for the PPD factors to be equal across time did not change model fit, ∆χ2 (4) = 1.42, p = .84, while the same constraints for CFPD resulted in a decrement to model fit, ∆χ2 (4) = 57.14, p < .01. Constraining residual variances and intercepts to be equal across time also resulted in a decrement to model fit for both PPD and CFPD, ∆χ2 (6) range = 53.53–289.40, ps < .01 and ∆χ2 (6) range = 19.29–128.41, ps < .01, respectively. Constraining autocovariances to be equal for PPD did not change model fit, ∆χ2 (3) = 5.12, p > .05, while the same constraint for CFPD did result in a decrement in model fit, ∆χ2 (3) = 49.22, p < .01. Fit for the final model with supported constraints was excellent, χ2 (119) = 131.92, p = .20; RMSEA = .017, 90% CI = [0, .03]; CFI = .99; TLI = .99; SRMR = .04. The standardized factor loadings ranged from 0.78–0.81 for PPD and from 0.58–0.82 for CFPD. The covariances among the latent factors can be found in Figure A.2. Interestingly, the variance in both sets of constructs increased across the waves (PPD W1–W3 variance: 0.1–0.4; CFPD W1–W3 variance: 0.01–0.02) as did the cross-reporter correlation, W1 r = 0.21; W2 r = 0.34; W3 r = 0.43.
Confirmatory factor model for close friend report of peer delinquency and perceived peer delinquency across three waves. Age and gender were included as statistical control variables, but they are not presented in the figure. Standardized statistically significant (p < .05) coefficients are presented. CFPD = close friend self-report of peer delinquency and PPD = Perceived Peer Delinquency or target report of peer delinquency, AU = Alcohol Use, PRULE = YSR Rule Breaking scale, PPDEL = peer report of their close friends delinquency excluding the target, PSU = peer self-report of alcohol, tobacco, and marijuana use, and PPDB = perceived peer delinquency or target report of peer delinquency bundles. The trailing number for each factor label reflects wave of measurement.

A latent growth curve analysis (LGCA) was estimated for alcohol use (AU) and a CFA was estimated for alcohol use disorder (AUD). For the LGCA, the first and last indicator was coded 0 and 3 for W3 and W6 AU, respectively, while the middle two indicators were freely estimated to account for the nonlinear patterns of change in our data (see Colder et al., Reference Colder, Frndak, Lengua, Read, Hawk and Wieczorek2018). Age, gender, and W1 alcohol initiation were mean centered and regressed on all outcomes. The coefficients for the final model can be found in Figure A.3, and fit for the model was excellent, χ2 (50) = 69.79, p = .03; RMSEA = .03, 90% CI = [0, .05]; CFI = .98; TLI = .98; SRMR = .03. Averaging across gender and age at baseline, youth who did not use alcohol at W1 (96% of the sample; M age = 11.6) had on average 0.03 drinks (p < .001) at W3 with significant residual variance (v = 0.03, p < .001) as well as growth in drinking of 1.59 drinks per year (p < .001) also with significant residual variance (v = 10.22, p < .001). Age (B = 0.22, p = 0.02) was associated with higher levels of W3 AU. Alcohol use at W1 was associated with higher levels of AU at W3 (B = 0.28, p = 0.03) and with a steeper increase in AU over time (B = 0.27, p = 0.03). Gender did not predict W3 AU or change in AU.
Factor model for alcohol use and alcohol use disorder across seven waves of longitudinal data. Age and gender were included as statistical control variables, but they are not presented in the figure. Standardized statistically significant (p < .05) coefficients are presented. AU = Alcohol Use, ALC = growth curve for alcohol use, AUD = alcohol use disorder symptoms, alcQxF = alcohol quantity and frequency index, W = wave, AP = alcohol problems bundle, MINI = MINI diagnostic Interview, and YAAQ = Young Adult Alcohol Consequences Questionnaire. The trailing number for each factor label reflects wave of measurement.

The factor loadings ranged from 0.77–0.98 for AUD symptoms at W3 and W7. When AUD symptoms at W7 was regressed on prior AUD (W3) and the AU growth factors, the slope for AU (moderate effect size) and AUD at W3 (small effect size) significantly predicted AUD at W7. The intercept of AU at W3 had a strong effect on AUD at W3. Age, gender, and W1 AU did not predict AUD at W3 or AUD at W7 beyond the AU growth factors.
Appendix B
Alternative models
Two-Factor Model
A simple two-factor model for internalizing and externalizing symptoms was estimated across the first three waves. Similar to the model reported in the manuscript, the two-factor model was measurement invariant. Subsequently, we went through a similar series of nested tests to determine pathways between problem behavior, peer delinquency, AU, and AUD. The nested tests can be found in Table B1, while the path coefficients in which the standardized 95% CI did not contain 0 can be found in Figure B1. The final two-factor model had poorer fit, χ2 (1743) = 2492.26, p < .001; RMSEA = .033, 90% CI = [0.030, 0.036]; CFI = .94; TLI = .94; SRMR = .07, than the bifactor model in our main analysis did, χ2(1723) = 2230.39, p < .001; RMSEA = .028, 90% CI = [0.024, 0.031]; CFI = .96; TLI = .96; SRMR = .05. Interestingly, the 90% CI for RMSEA barely overlaps between the two models, suggesting lower error for the bifactor model. In terms of pathways that had detectable effect sizes, perceived peer delinquency again serially mediated the effect of externalizing symptoms on AU and AUD and externalizing symptoms were again not associated directly with AUD. In contrast, internalizing symptoms were consistently protective against perceived peer delinquency, which reduced risk for AU and AUD. Internalizing symptoms were also not directly related to AUD but did have small to moderate negative effects on AU growth factors.
Estimated standardized path coefficients and 95% confidence intervals for the two-factor model predicting alcohol use and alcohol use. Age and gender were included in model as statistical control variables, but they are not presented in the figure. With the exception of the problem behavior factors, all of the constructs were allowed to covary within waves. All of the coefficients are standardized, and only those that were deemed significant (CI did not contain 0) are shown. The interval in parentheses after each standardized coefficient is the 95% confidence interval for the standardized coefficient. Extern = pure externalizing, Intern = pure internalizing, CFPD = close friend self-report of peer delinquency, PPD = Perceived Peer Delinquency or target report of peer delinquency, ALC-3 Intercept = Alcohol Use at W3, ALC 3-6 Slope = growth curve for alcohol use, AUD = alcohol use disorder symptoms, and W = wave. The trailing number of each factor label reflects wave of measurement.

Nested Satorra–Bentler chi-square difference tests and associated df and p-values for adding lagged paths between constructs across waves

Hierarchical Factor model
To better capture stable problem behavior variance, we estimated a hierarchical model in which each problem behavior factor at each wave was allowed to load on a hierarchical factor. In the first series of models, we excluded peer delinquency and estimated paths between stable problem behavior factors and AU and AUD. Fit for this model was excellent: χ2 (988) = 1693.73, p < .001; RMSEA = .043, 90% CI = [0.040, 0.050]; CFI = .95; TLI = .95; SRMR = .05. The path coefficients for this model suggested that stable pure externalizing symptoms affected AU but not AUD, while stable pure internalizing symptoms had an undetectable effect on AUD and a small negative effect on AU at W3. Two differences between this model and the bifactor model presented in the manuscript are that in addition to stable co-occurring symptoms’ having an effect on AUD (small), stable co-occurring symptoms had an effect on AU at W3. Furthermore, stable pure externalizing symptoms had an effect on AUD at W7. Next, stable peer delinquency factors were added to the model and all hierarchical factors were used to predict AU and AUD. Here again, fit for the final model was excellent but not as strong as the bifactor model presented in the manuscript: χ2 (1739) = 2451.42, p < .001; RMSEA = .033, 90% CI = [0.029, 0.035]; CFI = .94; TLI = .94; SRMR = .06. After adding stable peer delinquency factors, co-occurring symptoms no longer had a detectable effect on AU at W3, ß = 0.02, 95% CI [-0.16, 0.19], while co-occurring symptoms still had an effect on AUD at W3, ß = 0.14, 95% CI [0.02, 0.26], each of which replicated the main analysis. Similar to the analysis in the manuscript, stable perceived peer delinquency had a large effect on AU at W3, ß = 0.50, 95% CI [0.02, 0.98], and stable pure externalizing symptoms no longer had a detectable effect on AUD at W7, ß = 0.20, 95% CI [-0.05, 0.45]. Similar to the primary analysis, this suggests that stable externalizing symptom variance has large overlap with stable peer delinquency and peer delinquency confounds the relationship between co-occurring symptoms and AU.
Estimated standardized path coefficients and 95% confidence intervals for the hierarchical bi-factor model predicting alcohol use and alcohol use. Age and gender were included in model as statistical control variables, but they are not presented in the figure. All of the coefficients are standardized, and only those that were statistically significant (p < .05) are shown. The interval in parentheses after each standardized coefficient is the 95% confidence interval for the standardized coefficient. Extern = pure externalizing, Intern = pure internalizing, ALC-3 Intercept = Alcohol Use at W3, ALC 3-6 Slope = growth curve for alcohol use, and AUD = alcohol use disorder symptoms. The trailing number of each factor label reflects wave of measurement.