Introduction
Mild cognitive impairment (MCI) is a syndrome marked by a decline in episodic memory and other cognitive abilities and may be an intermediate state between normal cognitive aging and dementia such as Alzheimer's disease (AD) (Winblad et al., Reference Winblad2004; Albert and Blacker, Reference Albert and Blacker2006). Clarification of the roles of neurological markers that predict further cognitive impairment among MCI patients is important because it may assist in early identification of subsequent cases and can provide a better understanding of the neurobiological processes involved in cognitive decline and associated with dementia. In this study we address two such markers and their interacting effects on recall memory.
The APOE gene codes for the apolipoprotein E, which is known to be involved in several operations in the central nervous system (e.g. lipid transport and neuronal repair; Mahley et al., Reference Mahley, Weisgraber and Huang2006). The gene is located on chromosome 19 and has three common alleles (ε2, ε3, ε4). In particular, it is the presence of the ε4 allele that in previous studies has been associated with cognitive impairment among healthy older adults (Deary et al., Reference Deary2002; Rosen et al., Reference Rosen, Bergeson, Putnam, Harwell and Sunderland2002; Hofer et al., 2003; Nilsson et al., Reference Nilsson2006), MCI (Farlow et al., Reference Farlow, He, Tekin, Xu, Lane and Charles2004; Wehling et al., Reference Wehling, Lundervold, Standnes, Gjerstad and Reinvang2007) and dementia (Farrer et al., Reference Farrer1997). Other studies report non-significant associations in population-based samples (Jorm et al., Reference Jorm, Mather, Butterworth, Anstey, Christensen and Easteal2007; Luciano et al., Reference Luciano2009), and still others indicate associations only among those who will later develop dementia (Ramakers et al., Reference Ramakers2008; Bondi et al., Reference Bondi, Salmon, Galasko, Thomas and Thal1999). One of our aims in this study is to clarify discrepancies in previous studies by examining the effects of the ε4 allele on memory impairment in the context of an amyloid marker of neuropathology.
The level of amyloid β-proteins 42 (Aβ42) in the cerebrospinal fluid (CSF) is thought to reflect pathology in the aging brain (Blennow et al., Reference Blennow, de Leon and Zetterberg2006). According to the amyloid cascade hypothesis (Hardy and Selkoe, Reference Hardy and Selkoe2002), it is the presence of extracellular deposits of Aβ42 and the subsequent accumulation of senile plaques that represent an early stage of the pathogenesis of AD. This accumulation is thought to be indexed through analyses of the cerebrospinal fluid in which low levels of Aβ42 indicate neuropathology and increased risk of AD (Hansson et al., Reference Hansson, Zetterberg, Buchhave, Londos, Blennow and Minthon2006). Bennett et al. (Reference Bennett, Schneider, Wilson, Bienias, Karvis and Arnold2005) report a significant association between amyloid load and measure of general cognitive function and that these associations mediate (confound) the associations between the ε4 allele and cognitive function. Alternative hypotheses concerning the interrelation among CSF Aβ42, the ε4 allele, and their associations with memory function remain, however, to be evaluated.
In this study we fit statistical models known as Latent Curve Models (LCM) to three sequential longitudinal data sets drawn from the Gothenburg MCI study. In this study we use three memory tests intended to measure free recall at each measurement occasion. We use a structural equation modeling (SEM) approach to model individual differences in the rate of change in a latent memory factor underlying the covariance structure of the three memory tests. (i.e. second-order LGM; Ferrer et al., Reference Ferrer, Balluerka and Widaman2008). The benefit of this model of change in a latent factor is that it reduces the confounding effects of both specific and random measurement errors on the model of intra-individual change. In the analyses, we first examine if the ε4 allele and Aβ42 are independently associated with individual differences in level of performance and change on the memory factor, and then we test the interaction between these markers.
Methods
Participants and diagnoses
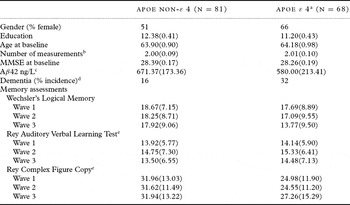
The sample was drawn from the Gothenburg MCI study and consisted of individuals diagnosed with MCI (amnestic and multiple domains). About 75% of the participants were referred to the hospital clinic by a general practitioner or a specialist, and about 25% were self-referrals. A description of the sample used in this study, stratified according to the presence of at least one ε4 allele, is shown in Table 1. The first measurement was initiated in 2000 (n = 149), the second in 2002 (n = 100), and the third in 2004 (n = 50); ages ranged from 47 to 80 years at baseline.
Descriptive from the Gothenburg MCI Study sample (N = 149)

a The APOE groups are stratified on the presence of at least one ε4 allele.
b The measurements were conducted in 2000, 2002, and 2004.
c Levels of Aβ42 values were obtained from a cerebrospinal fluid.
d Diagnoses within 4 years.
e Summary score of short- and long-term recall trials.
MMSE = Mini-mental State Examination
Diagnoses of MCI were based on self and informant reports of progressive cognitive impairment over more than 6 months, and objective cognitive symptoms were diagnosed according to the Stepwise Comparative Status Analysis (STEP; Wallin et al., Reference Wallin1996), I-Flex, which is a short form of the executive interview (EXIT; Royall et al., Reference Royall, Mahurin and Gray1992), Mini-mental State Examination (MMSE; Folstein et al., Reference Folstein, Folstein and McHugh1975) and Clinical Dementia Rating (CDR; Morris, Reference Morris1997). Subjects without symptoms according to the checklists were not included and nor were subjects with more than two symptoms on STEP or a score below 25 on MMSE. More information about the Gothenburg MCI study sampling and diagnostic procedures can be found in Nordlund et al. (Reference Nordlund, Rolstad, Hellström, Sjögren, Hansen and Wallin2005).
Participants who received a diagnosis of AD during follow-up met the DSM-IIIR criteria of dementia and probable AD as defined by NINCDS-ADRDA (McKhann et al., Reference McKhann, Drachman, Folstein, Katzman, Price and Stadlan1984). Patients who received a diagnosis of vascular dementia (VaD) fulfilled the DSM-IIIR criteria and the criteria for subcortical VaD according to Erkinjuntti et al. (Reference Erkinjuntti2000), with predominant executive-, speed- and gait-related performance difficulties and magnetic resonance imaging (MRI) signs of vascular disease judged to be a significant burden on the brain. Those who received a diagnosis of mixed dementia (AD/VaD) fulfilled the NINCDS-ADRDA criteria for AD and had MRI signs of cerebral vascular disease, but not so severe that they were judged to be a major burden on the brain.
Genetic and biochemical analyses
The APOE genotyping was performed by mini-sequencing as described previously (Blennow et al., Reference Blennow2000). Genotypes were obtained for two single nucleotide polymorphisms (SNPs), which were used to define alleles. At baseline, CSF samples were collected by lumbar puncture (LP) through the L3/L4 or L4/L5 interspace. The samples were drawn in the morning to exclude influences by possible 24-hour fluctuations in biomarker levels. The first 10 mL was collected in a polypropylene tube, immediately transported to the local laboratory for centrifugation at 2000 x g at +4 °C for 10 min. The supernatant was pipetted off, gently mixed to avoid possible gradient effects, and aliquoted in 2 mL portions in screw-cap polypropylene tubes that were stored at −80 °C pending biochemical analyses, without being thawed and refrozen. CSF Aβ42 was determined using a sandwich ELISA (Innotest Aβ(1–42), Innogenetics, Ghent, Belgium; Andreasen et al., Reference Andreasen1999).
Memory assessments
Episodic memory was measured by the same three free recall tests administered at each measurement occasion. The Wechsler's Logical Memory (WLM; Wechsler, Reference Wechsler1987) is a 30-minute delayed story recall test with a maximum score of 50. The Rey Auditory Verbal Learning Test (RAVLT; Geffen et al., Reference Geffen, Butterworth and Geffen1994) is a 15-item recall word-list test. In order to increase the precision on this test for the present analyses, we computed a summary score of the short- (5-minute) and long-term (30-minute) recall trials. The maximum score was 30. The Rey Complex Figure (RCF; Meyers and Meyers, Reference Meyers and Meyers1995) is a free recall visual copy memory test. As in the RAVLT test, we computed a summary score based on the short- (5-minute) and long-term (25-minute) recall trials. The maximum score on this test was 62. To facilitate interpretation of a latent memory factor we standardized the scores to a mean of 50 and SD of 10 based on the first measurement occasion for each of the tests. This will also standardize the scores on the latent factor.
Statistical analyses
Latent curve models (LCM) permit the simultaneous analyses of between-person differences in level of the outcome variable (i.e. variability across individuals in the estimated intercepts) and rate of within-person change (i.e. variability across individuals in the estimated slopes across time) (see, for example, McArdle and Nesselroade, Reference McArdle, Nesselroade, Schinka and Velicer2003). LCMs are similar and, under certain constraints, identical to a multilevel modeling approach for the analysis of longitudinal data (for more details, see Willett and Bub, Reference Willett, Bub and Rindskopf2005, who provide an insightful and accessible demonstration of the similarities and differences across these two analytical approaches).
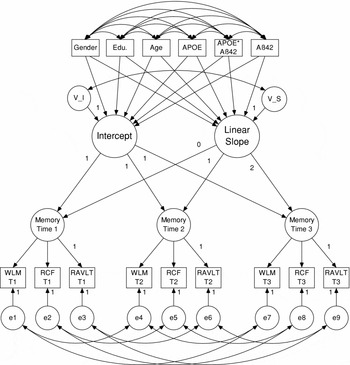
In the present analyses, we have three indicators of the same construct of free recall memory at each of the three measurement occasions. We use a multivariate approach known as second-order LCMs (Ferrer et al., Reference Ferrer, Balluerka and Widaman2008; McArdle, Reference McArdle, Nesselroade and Cattell1988). In this analytical approach we fitted a growth curve model to the covariance structure (i.e. factors) of the three indicators (i.e. memory tests) at each measurement occasion instead of the observed variables as is done in a univariate approach. To demonstrate how these models are specified in the presented analyses, we have included a path diagram (Figure 1). By convention, circles refer to latent variables, squares to manifest variables, two-headed arrows to covariances, and one-headed arrows to linear regressions. The three circles labeled “memory” represent a latent factor that is estimated from the common covariance of the three memory tests at each measurement occasion. Each manifest variable has an additional variability that is not associated with the other tests and includes both specific and random sources of individual differences. The random error variability is represented in the figure by circles with the letter “e” written within them and they are allowed to covary only with corresponding test variance across time. The specific residuals (not depicted on the figure) are not allowed to covary across time.
Path diagram of a conditional second-order LCM with three indicators at each time of measurement. Circles refer to latent variables, squares to manifested variables, two-headed arrows to covariances, and one-headed arrows to a linear regressions.
WLM = Wechsler's Logical Memory; RCF = Rey Complex Figure; RAVLT = Rey Auditory Verbal Learning Test.

The latent curve model is fitted simultaneously to these factor-level constructs. The growth model in Figure 1 is represented by the two factors with “intercept” and “linear slope” respectively written within them. The factor loadings of the “intercept” factor are constrained to 1 and the loadings of the “slope” factors are constrained to 0, 1, and 2, respectively. There are two years between each measurement occasion in the Gothenburg MCI study so the estimated liner slope parameter will refer to a two-year change in the standardized memory factors and the intercept will refer to level of performance at baseline. The variability components in the “intercept” and the “slope” factors are represented in Figure 1 by the circles with “V_I” and “V_S” written within them (also known as random effects) and are assumed to take a mean value of zero, to have an approximately normal distribution, and to correlate. As there are covariates included into the model, these variability components represent conditional variability not explained by the covariates.
In all presented models we simultaneously adjusted for gender, education, and age on both level of performance (i.e. intercept) and rate of change (i.e. slope). This is represented in Figure 1 with regression arrows from these variables to the growth factors. Categorical variables were dummy coded and continuous variables centered at their mean values. We used a full maximum likelihood to estimate the parameters and evaluated model fit by using the likelihood ratio chi-square test, Bentler's comparative fit index (CFI; Bentler, Reference Bentler1990), and the Root Mean Square Error of Approximation (RMSEA; Steiger, Reference Steiger1990). More detailed descriptions of the second-order LCM procedures and SEM can be found elsewhere (McArdle, Reference McArdle, Nesselroade and Cattell1988; Ferrer et al., Reference Ferrer, Balluerka and Widaman2008).
Results
There were no significant (p < 0.05) differences between the ε4 carriers and non-carriers in age, education, and MMSE (see Table 1). Although non-significant, there was a trend toward a larger proportion of females among the ε4 carriers, χ2(1, N = 149) = 3.67, p = 0.06. The ε4 carriers also showed significantly, F(1,147) = 8.32, p = 0.005, lower Aβ42 values compared to non-carriers. Average CSF Aβ42 in the total sample was 629.67 ng/L (SD = 197.38) and ranged from 210 to 1160 ng/L. The ε4 allele was associated with an overall higher risk of conversion to dementia over the four-year study period (OR = 2.50, 95% CI: 1.15–5.46, p = 0.002). This association was even significant when we controlled for gender, education and age (OR = 2.33, 95% CI: 1.02–5.30, p = 0.04), but not when we controlled additionally for Aβ42 (OR = 1.15, 95% CI: 0.43–3.06, p = 0.79). Aβ42 was, however, negatively associated with risk of dementia when controlling for gender, education, age and APOE status (OR = 0.992, 95% CI: 0.988–0.995, p < 0.001).
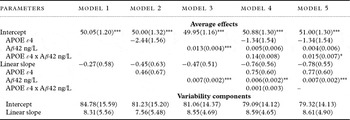
The estimated average effects and variability components from the fitted LCM models are shown in Table 2. Model 1 is a linear growth model (χ2(37) = 88.59, p = 0.001, CFI = 0.92, RMSEA = 0.10 (90% CI = 0.07–0.12)) including gender, education and age as covariates on the intercept and slope. The estimated parameters in this model imply an average value of approximately 50 (as indicated by the fixed intercept) on the latent episodic memory factor for the MCI patients at their initial visit to the clinic. Then a subsequent average non-significant two-year linear decline by 0.27 (p = 0.65) standard scores on the latent memory factor over the four years. The larger part of the between-person variability estimated in this model was at the initial level of performance (i.e. intercept) and a smaller part at the level of rate of change (i.e. slope). There was a significant (χ2(2) = 114.6, p < 0.001) loss in the model fit when we constrained the variability component of the intercept to zero (as well as covariance between intercept and slope) but not when we constrained the variability component of the slope (χ2(2) = 1.48, p = 0.48). This small variability component in the slope is most likely due to few repeated measurements (only 3) in the study design, and substantial attrition over the study time period, and may limit inferences concerning explanatory factors of change.
Estimates from second-order LCMs examining the associations of the APOE ε4 allele and CSF Aβ42 with level of performance and rate of change on a standardized latent factor of free recall memory

All models adjust for age, gender, and education on both level of performance and rate of change. The latent factor has three indicators at each of the three measurement occasion: Wechsler's Logical Memory, Rey Auditory Verbal Learning Test, and Rey Complex Figure Copy. The linear change component is structured as two years change on the latent factor over four years.
– = constrained to zero.
*** p < 0.001; ** p < 0.01; * p < 0.05
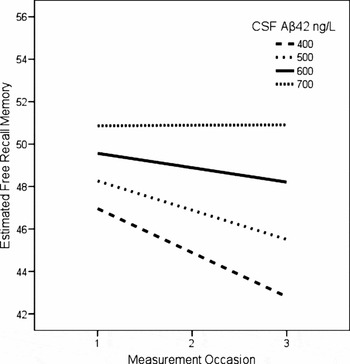
In Model 2 we additionally introduced the APOE genotype as a covariate on the level and rate of change (χ2(44) = 98.60, p = 0.001, CFI = 0.91, RMSEA = 0.09 (90% CI = 0.07–0.12)). In this model the ε4 allele was not significantly associated with level of performance (p = 0.12) or change (p = 0.49). However, although non-significant, the ε4 carriers were estimated to perform on average 2.44 standardized scores poorer compared to the non-carriers. In Model 3, we removed the APOE and included Aβ42 ng/L as a covariate on both level and change (χ2(44) = 100.06, p = 0.001, CFI = 0.92, RMSEA = 0.09 (90% CI = 0.07–0.12)). The estimated parameters indicated that for each additional CSF Aβ42 ng/L value there was an increase in the standardized baseline latent factor score by 0.013 (p < 0.01). Individuals with average Aβ42 value (629.67 ng/L) were estimated to decline by a non-significant value of 0.47 (p = 0.36) standardized scores over a two-year period, and for each additional Aβ42 value there was a 0.007 (p < 0.01) less decline. These effects are plotted in Figure 2 for four prototypical individuals that vary in level of CSF Aβ42 from 400–700 ng/L. As is evident from the figure, those with lower Aβ42 values were estimated to have lower memory performance at baseline and declined steeper across time.
Estimated average change trajectories on a standardized free recall memory factor for prototypical individuals that vary in the level of CSF Aβ42 ng/L.

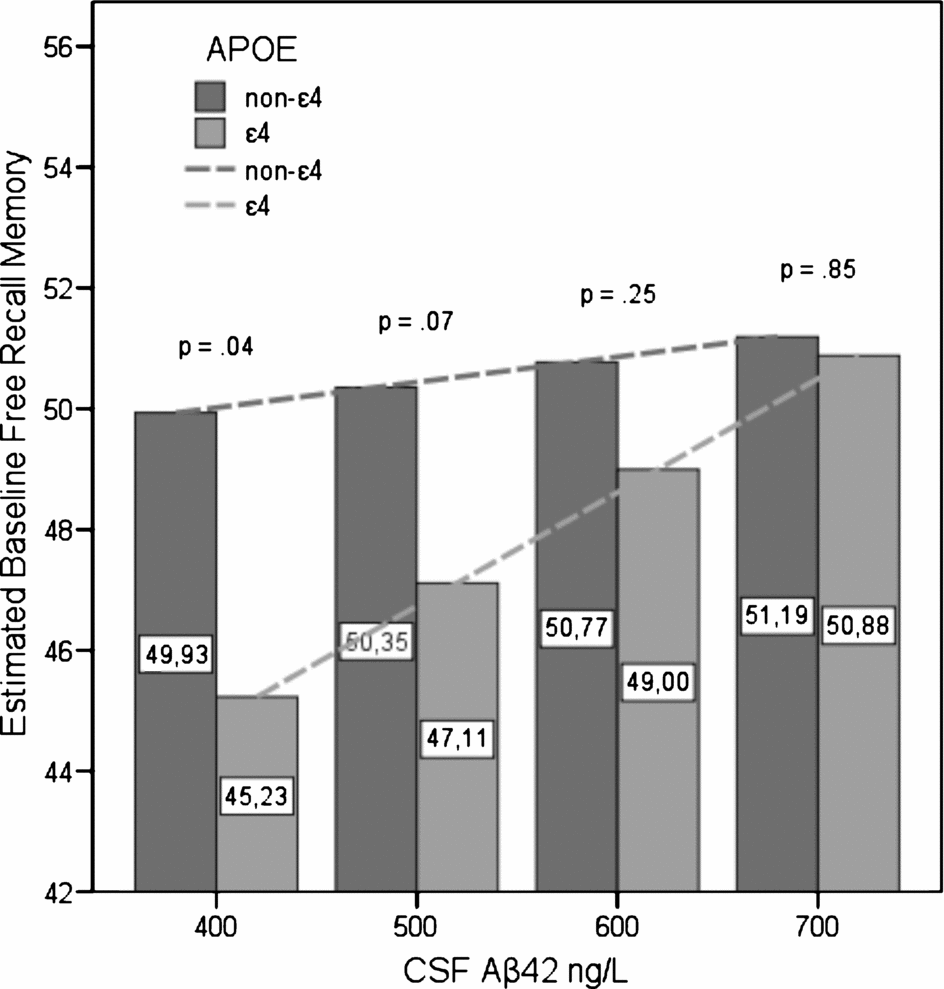
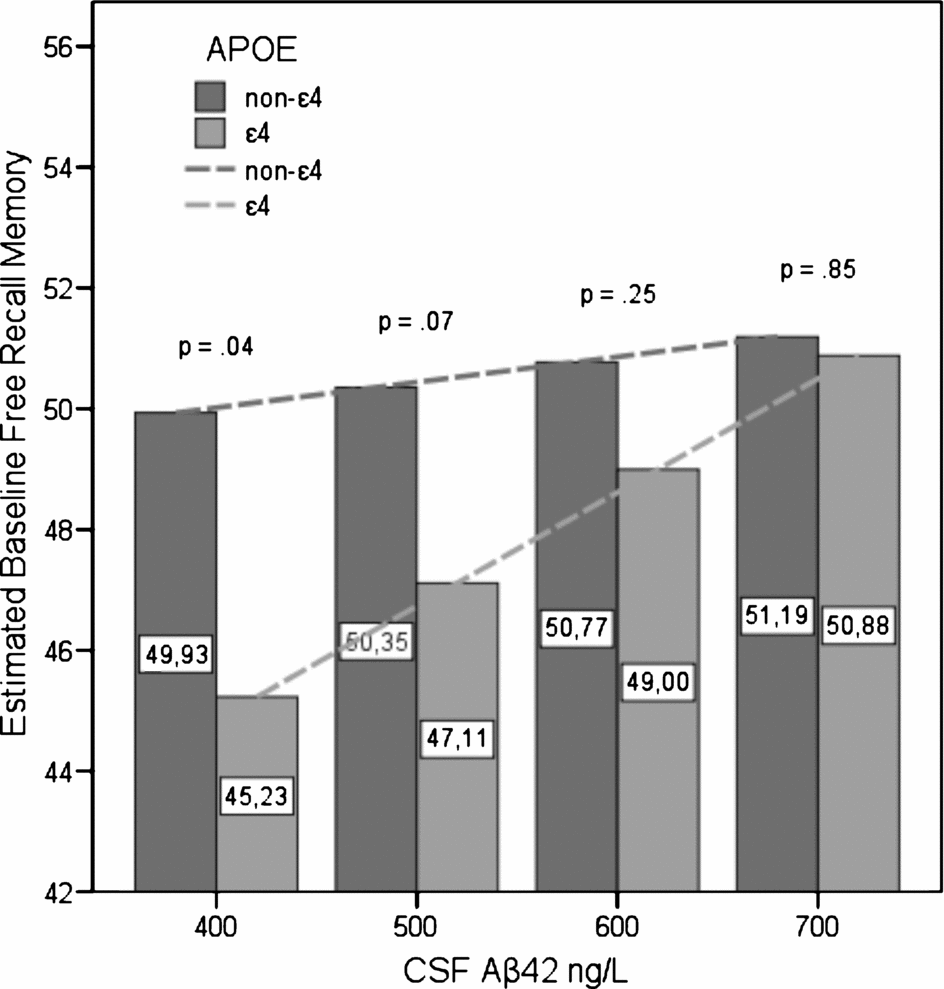
Next, we simultaneously included APOE and Aβ42, as well as their interactions, as covariates of level and rate of change (χ2(58) = 116.00, p = 0.001, CFI = 0.93, and RMSEA = 0.08 (90% CI = 0.06–0.10))(see Model 4). In this model, the APOE and Aβ42 interaction effect on the rate of change was not significant. In Model 5, we therefore constrained this coefficient to zero which resulted in a minimum loss in fit (χ2(59) = 116.04, p = 0.001, CFI = 0.93, RMSEA = 0.08 (90% CI = 0.06–0.10)). The significant APOE and Aβ42 interaction on the intercept indicates that the effect of Aβ42 on memory performance is moderated by APOE. More specifically, the association between Aβ42 and baseline memory was estimated to be stronger among the ε4 carriers (0.019; p < 0.01) as compared to non-carriers (0.004; p = 0.46).
The observed interaction indicates that the effect of APOE on memory performance is moderated by different levels of Aβ42. The association of APOE and memory is estimated to be stronger among individuals with low as compared to high Aβ42 values. For individuals with an average Aβ42 value of 629.67 ng/L, the ε4 carriers perform, on average, 1.34 (p = 0.38) standard scores lower than non-carriers. For each additional Aβ42 value there is a 0.015 (p = 0.04) score decrease in the difference. Lower Aβ42 values will then increase the differences. In fact, the APOE covariate is significantly (p < 0.05) associated with level of performance at an Aβ42 value of 452 ng/L and lower. This is further illustrated in Figure 3 in which estimated standardized baseline memory scores are plotted as a function of the APOE ε4 allele and four (i.e. 400, 500, 600, and 700) values of CSF Aβ42 ng/L. As shown in the figure, the differences between the average memory values of the APOE groups increase as a function of decrease in Aβ42 levels. The aforementioned difference in the associations between Aβ42 and memory performance across the APOE groups is also shown in Figure 3. The dashed lines refer to the estimated linear association within each group and demonstrate significant associations within the ε4 group but not within the non-ε4 group.
Estimated average standardized baseline free recall memory scores stratified according to the presence of the APOE ε4 allele and four CSF Aβ42 ng/L values. Dashed lines refer to the estimated linear associations between Aβ42 ng/L and baseline memory within each of the APOE groups (estimate in the non-ε4 group = 0.004, p = 0.46; ε4 group = 0.019, p <0.001).
We then evaluated selective attrition over the study period by comparing participants and non-participants at the last measurement occasion. These comparisons revealed no significant differences in gender,χ 2(1, N = 149) = 0.21, p = 0.65, education, F(1, 146) = 0.05, p = 0.82, age, F(1, 147) = 0.01, p = 0.91, APOE status, χ 2(1, N = 149) = 0.05, p = 0.82, Aβ42 ng/L, F(1, 147) = 2.02, p = 0.16, MMSE, F(1, 143) = 0.36, p = 0.55, and baseline values on WLM, F(1, 97) = 0.03, p = 0.85, RAVLT, F(1, 147) = 0.01, p = 0.92, and RCF, F(1, 147) = 1.30, p = 0.26. Similar attrition comparisons at the second measurement occasion revealed no significant group difference on these variables.
Discussion
The aim of the presented analyses was to illuminate the associations between episodic (free recall) memory among MCI patients in relation to the ε4 allele of the APOE genotype and levels of CSF Aβ42. Our main findings suggest a significant interaction among the two markers, such that the ε4 allele is associated with memory performance in the presence of low Aβ42 (≤452 ng/L) and Aβ42 is more strongly associated with memory in the presence of the ε4 allele. Given the assumption that levels of CSF Aβ42 reliably reflect amyloid-related neuropathology in the aging brain (Strozyk et al., Reference Strozyk, Blennow, White and Launer2003), these findings support previous studies (Bondi et al., Reference Bondi, Salmon, Galasko, Thomas and Thal1999; Ramakers et al., Reference Ramakers2008) that indicate that the APOE genotype is a stronger predictor of individual differences in cognitive performance in the presence of a verified marker of brain pathology.
Low Aβ42 was associated with steeper decline in memory in the total sample. These findings support the amyloid cascade hypothesis and encourage the usage of Aβ42 as a biomarker that can provide significant diagnostic information about memory impairment and early detection of AD cases. However, as our test of the interaction between APOE and Aβ42 indicates, the association between Aβ42 and memory impairment may be determined by the APOE genotype. Further evidence from other studies that specifically test this interaction is needed.
Other studies are additionally needed to clarify the neurological underpinning of this interaction. Bennett et al., (Reference Bennett, Schneider, Wilson, Bienias, Karvis and Arnold2005) argue that the amyloid load mediates the association between APOE and cognition. However, there was no significant association between APOE and memory in a model that did not account for Aβ42. Therefore, no association between APOE and memory was present that could be evaluated for mediation. The discrepancy of the findings in these two studies may relate to sample differences (e.g., the Gothenburg MCI study consist of a more homogenous sample of individuals) and different cognitive indicators. The Gothenburg MCI study thus does not necessarily provide evidence that contradicts the findings reported by Bennett et al (Reference Bennett, Schneider, Wilson, Bienias, Karvis and Arnold2005). In fact, the APOE ε4 allele was significantly associated with an elevated risk of dementia over the study period and this association was mediated by Aβ42. Another potential explanation for the observed interaction between APOE and Aβ42 on memory performance may relate to a third variable, such as a vascular factor and white matter lesions (Stenset et al., Reference Stenset2006), that may be associated both with APOE and Aβ42.
One of the strengths of our study is that we have a direct index of neuropathology for each participant through the CSF Aβ42 values, which allows for a more specific test of the hypotheses. A further strength is that we used multiple (i.e. three) indicators of free recall memory on each of the three measurement occasions spanning over four years. We therefore claim to have a more robust measure that substantially reduces biasing effects due to measurement errors in the outcome variable. Our modeling approach also allows for testing the assumption of stability of the memory factor over time, known as factorial invariance (Meredith and Horn, Reference Meredith, Horn, Collins and Sayer2001). Further analyses of our data indicate that these models meet the assumption of weak factorial invariance (i.e. there was not a significant loss in model fit when the factor loadings were set equal across the waves of measurements), but not of strong factorial invariance (i.e. there was a significant loss in fit when intercepts were additionally set equal across waves). However, these are strict tests of the covariance structure of longitudinal data and are seldom met in practice but nevertheless do encourage a somewhat careful interpretation of the change component in the presented analyses.
Another related issue that needs to be addressed is the relatively large sample attrition over the time course of the study which is likely to affect the estimated variability in change on the latent memory factor. This could potentially explain why a significant interaction effect of APOE and Aβ42 on the rate of change was not found but should have a minor effect on the baseline comparisons. However, we evaluated potential biasing effects due to selective attrition by comparing participants with drop-outs at each measurement occasion across demographic variables, MMSE, APOE, Aβ42 and baseline raw scores and found no significant differences. The outcomes indicate minor potential biasing effects due to selective attrition.
In conclusion, these analyses indicate that the APOE genotype is associated with episodic memory performance in MCI patients when used in combination with CSF Aβ42 as an index of neuropathology. The CSF Aβ42 marker is associated with level of memory performance as well as with memory decline, but these associations may be moderated by expressions of the APOE genotype. Future studies need to illuminate the neurological basis of these interactions as well as test the interaction effects of APOE and Aβ42 in other cognitive domains within the general population.
Conflict of interest
None.
Description of authors’ roles
V. Thorvaldsson analyzed the data and wrote the original manuscript. A. Nordlund, K. Blennow, H. Zetterberg and A. Wallin collected the data and revised the paper. I. Reinvang and B. Johansson revised the paper. All authors contributed to the design of the study.
Acknowledgments
The assistance of staff at the Memory Clinic and the Neurochemical Department at Sahlgrenska University Hospital, Mölndal, is warmly acknowledged. This work was supported by grants from the Swedish Research Council, Sahlgrenska University Hospital, Gothenburg Medical Society, Swedish Brain Power, Hjalmar Svensson forskningsfond, Stiftelsen för Gamla Tänarinnor, Alzheimerfonden, Swedish Council for Working Live and Social Research, MedCoast, and the Alzheimer's Association.