1. INTRODUCTION
The maritime areas under national jurisdiction off the continental coast of Portugal are crossed by busy commercial routes connecting northern Europe and the Mediterranean Sea. A significant part of the maritime traffic coming from the Far East, particularly China, passes through the Suez Canal, crosses the Mediterranean Sea to the strait of Gibraltar and heads towards northern Europe through Portuguese waters. Here ships meet vessels bound to and leaving from national ports, fishing vessels, pleasure craft, traffic from the Mediterranean to North America, from Africa to northern Europe, and from northern Europe to South America, creating a complex network of routes.
Maritime transportation involves risks such as fire, grounding, collision, loss of property and spillage of dangerous or pollutant substances. Aside from the risk to life, there are also potentially disastrous consequences for the environment and for economic activities dependent on the sea, such as fisheries and tourism. These risks have been the object of various studies, including by Guedes Soares and Teixeira (Reference Guedes Soares and Teixeira2001). The growth of the world fleet, both in number of ships and in tonnage, tends to increase the number of ship accidents, and ship collisions are no exception.
The need to ensure the safety of navigation has led to the implementation of a coastal Vessel Traffic Service (VTS) in Portugal. This is equipped with several Automatic Identification System (AIS) base stations that receive and maintain records of messages transmitted by the ships' AIS transceivers. Although limitations have been identified with the use of AIS as an aid to collision avoidance (e.g. Graveson, Reference Graveson2004; Norris, Reference Norris2007), it is clear that AIS data has become an important source of information for studying maritime traffic and associated risks, in particular ship-to-ship collision risk. Most studies are based on the assessment of collision candidates that provide a useful method of evaluating the collision risks in complex transportation systems and the effect of safety measures in the context of Formal Safety Assessment studies, as defined by IMO (2007) (Martins et al., Reference Martins and Maturana2010). Collision candidates are ships in a near collision situation, which has been defined using the ship domain concept introduced by Fujii & Tanaka (Reference Fujii and Tanaka1971) and Goodwin (Reference Goodwin1975) and later improved by several authors (e.g. Coldwell, Reference Coldwell1983; Zhao et al., Reference Zhao, Wu and Wang1993; Pedersen, Reference Pedersen1995; Pietrzykowski, Reference Pietrzykowski2008; Pietrzykowski and Uriasz, Reference Pietrzykowski and Uriasz2009; Wang et al., Reference Wang, Meng, Xu and Wang2009).
Using these concepts and AIS data, several collision risk studies have been recently completed. Mou et al. (Reference Mou, Tak and Ligteringen2010) performed a statistical analysis of ship collisions using AIS data, and assessed the collision risk using a dynamic method based on the Safety Assessment Models for Shipping and Offshore in the North Sea (SAMSON) model, which was developed by the Maritime Research Institute Netherlands (MARIN/MSCN) based on long-term historical data of collisions in the North Sea (Degré et al., Reference Degré, Glansdorp and van der Tak2003). Goerlandt and Kujala (Reference Goerlandt and Kujala2010) proposed a method to assess the probability of vessels colliding with each other, determining the expected number of accidents, locations and time where and when they are most likely to occur, providing input for models concerned with the consequences of ship collisions. The method relies on the analysis of AIS data to obtain input data for a traffic simulation model. The inputs to this model include routes, number of vessels on each route, departure times, ship dimensions and speed. Kujala et al. (Reference Kujala, Hanninen, Arola and Ylitalo2009) analysed accident data in the Gulf of Finland and used a theoretical collision model and AIS data to estimate the number of ship collisions in the crossing area between Helsinki and Tallinn. Montewka et al. (Reference Montewka, Hinz, Kujala and Matusiak2010) used advanced statistical and optimization methods (Monte Carlo and genetic algorithms) to present a new approach for the geometrical probability of collision estimation.
Willems et al. (Reference Willems, Wetering and Wijke2009) proposed a geographical visualization of AIS data to support decision-making, traffic control and coastal surveillance. This visualization is based on density fields shown as illuminated height maps. Using this approach it is possible to identify traffic lanes and anchoring areas and observe details of speed variation of individual vessels. Aarsaether and Moan (Reference Aarsaether and Moan2009) used AIS data to obtain traffic statistics and to estimate navigation patterns in constrained waters. More recently, Weng et al. (Reference Weng, Meng and Qu2012) used AIS data to estimate vessel collision frequency in the Singapore Strait on the basis of the assessment of the number of “vessel conflicts”. In this case a “vessel conflict” is defined as a critical situation where a vessel is expected to enter another vessel's domain, defined by a radius of three times its length.
This study was also based on AIS data, collected by the Portuguese coastal VTS base stations between 9 July and 9 August 2008. Maritime traffic off the coast of Portugal was characterised and a statistical analysis of the traffic in the Traffic Separation Schemes was conducted. Algorithms were developed to assess the risk profile and the relative importance of routes associated with particular ports and also to calculate the risk of collision from the assessment of the number of collision candidates using AIS data directly with the concept of collision diameter defined by Pedersen (Reference Pedersen1995). This approach calculates the number of collision candidates by estimating the future positions of ships and the distance between them based on the positions, courses and speeds given by AIS messages. If the estimated distance between any two ships is less than the collision diameter for those two ships, which depends on the length, breadth, crossing angle and relative velocity of the ships, the pair is considered a collision candidate.
Finally, the expected number of collisions in the period under investigation is predicted and compared with the actual number of collisions that have occurred, which is derived from historical data.
2. DECODING AND VISUALISATION OF AIS INFORMATION
From 31 December 2004 all vessels over 300 GT engaged in international voyages, all cargo vessels over 500 GT and all passenger vessels are required to be equipped with AIS. This system allows automatic exchange of information between stations (ships and coastal), using VHF radio waves. There are 27 message types defined in ITU (International Telecommunication Union) recommendation M.1371-4, and two classes of shipboard equipment: class A (used mainly by commercial vessels) and class B (used mainly by fishing vessels and pleasure craft).
The AIS base stations used by the Portuguese coastal VTS are located in sites that ensure coverage of the VTS monitoring area. Having this in mind, the area studied is bounded by parallels 36·08° N and 41·86° N, and by meridians 007·4° W and 010·24° W. AIS messages sent from positions outside this area were discarded. The messages sent from the main ports were also discarded because studying the risk of ship collisions inside the ports is out of the scope of this work, and would require a different methodology.
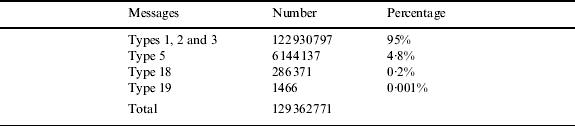
Information contained in AIS messages is encoded for transmission using appropriate protocols (NMEA AIVDM/AIVDO). To interpret these messages, a program was developed that decodes AIS messages of type 1, 2, 3, 5, 18, 19 and 24. Messages of type 1, 2 and 3 are class A position reports, type 5 messages are ship static and voyage related data from class A equipment, type 18 messages are standard class B position reports, type 19 messages are extended class B position reports and type 24 messages (that were not found in the sample provided) are class B static data reports. The information decoded from the various message types was:
• Message type 1, 2 and 3: date/time; Maritime Mobile Service Identity (MMSI); navigation state; rate of turn; speed over ground; position accuracy; latitude, longitude; course over ground; heading.
• Message type 5: date/time; MMSI, IMO number; ship type; length; breadth; position fix type; draught.
• Message type 18: date/time; MMSI; speed over ground; position accuracy; latitude; longitude; course over ground; heading.
• Message type 19: date/time; MMSI; speed over ground; position accuracy; latitude; longitude; course over ground; heading; ship type; length; breadth; position fix type.
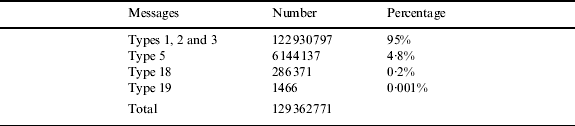
The distribution of decoded messages by message type is shown in Table 1.
Decoded AIS messages by type (from 9 July to 9 August 2008).
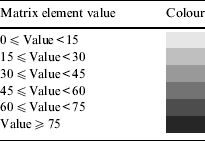
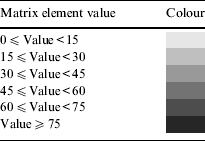
To be able to visualize traffic patterns using the decoded AIS messages, a set of programs was developed. These programs create a matrix of which each element, initially given the value zero, is matched by a pixel of a bitmap image. The side of each pixel is equivalent to 0·001° of latitude or 0·06 nautical miles (111·12 meters). The matrix has 6001 lines and 2527 columns. Line 0 matches latitude 36° N, line 6000 matches latitude 42°, column 0 matches longitude 007° 15’ W and column 2526 matches longitude 010° 30’ W. Each element of the matrix is incremented when the program reads a decoded AIS message sent from a position corresponding to that element. Once the program finishes reading all the decoded messages, the colours of the pixels of the bitmap image are changed according to the value of the corresponding elements of the matrix. Table 2 shows the correspondence between values of the elements of the matrix and colours of the pixels. The resulting image is shown in Figure 1, which was obtained using message types 1, 2 and 3 which account for around 95% of all decoded messages.
Class A AIS traffic (from 9 July to 9 August 2008).

Colours of matrix values.
3. Characterization of maritime traffic off the Portuguese coast
The decoded AIS messages are suitable to be used for traffic statistics and characterization of maritime traffic off the Portuguese coast, particularly on the traffic lanes of TSSs (Traffic Separation Schemes).
3.1. Traffic Separation Schemes (TSSs) and areas to be avoided off the Portuguese coast
Traffic Separation Schemes (TSSs) and areas to be avoided both contribute to routeing ships. The main objective of marine routeing systems is to contribute to safety of life at sea, protection of the marine environment and safety of navigation in convergence areas, areas with high traffic density, restricted waters or areas affected by unfavourable weather conditions. Routeing systems aim to achieve some or several of the following outcomes:
• Separate opposing traffic flows, to reduce the risk of head on collisions.
• Reduce the risk of collision between traffic proceeding along predetermined routes and traffic crossing those routes.
• Simplify traffic flow in areas of convergence.
• Organise traffic flow in areas, or around areas, where the passage of all ships or some specific types of ships is dangerous or not desirable.
• Organise traffic flow in, around or at a safe distance from environmentally sensitive areas.
• Reduce the risk of grounding, providing special guidance in areas where depth information is not reliable or where depth is critical.
• Guide traffic away from fishing areas or organizing traffic flowing through fishing areas.
There are two TSSs off the Portuguese coast, off Cape Roca and off Cape San Vicente. There is also one area to be avoided, protecting the environmentally sensitive Berlengas archipelago. TSSs are governed by Rule 10 of the International Regulations for Preventing Collisions at Sea (COLREGs). The Berlengas area to be avoided is not to be crossed by vessels over 300 GT or vessels carrying dangerous cargo, unless duly authorized by competent authorities. Both TSSs had, at the time when the data was collected, four separated traffic lanes, four separation zones and one Inshore Traffic Zone (ITZ). The four lanes in each TSS were:
• Northbound non-dangerous cargo traffic lane.
• Northbound dangerous cargo traffic lane.
• Southbound non-dangerous cargo traffic lane.
• Southbound dangerous cargo traffic lane.
New TSSs were implemented on 1 December 2010, with an additional traffic lane crossing the ITZ of each TSS.
3.2. Traffic lane traffic statistics
Figure 1 shows a high traffic density in the TSSs traffic lanes and on the main routes connecting those traffic lanes. It also shows some concentration on the approaches to the main ports and on some clearly visible routes, namely: between the ports of Vigo, Leixões, Aveiro and Figueira da Foz, and the TSS off Cape Roca; between the ports of Lisboa, Setúbal and Sines, and the TSSs off Cape Roca and off Cape S. Vicente; between the port of Lisboa and the archipelagos of Madeira and Canarias; between the ports of Lisboa and Leixões, and the Açores islands; between ports on the South coast of Spain (like Cadiz and Huelva) and the TSS off Cape S. Vicente; between some ports of Morocco and the TSS off Cape S. Vicente, among others.
To analyse traffic in the area covered by this study and specifically in the TSSs, a set of programs was developed. Table 3 shows the number of ships and average speeds on the traffic lanes of the TSS off Cape Roca.
Number of ships and average speeds, off Cape Roca TSS traffic lanes, 32 days time period.

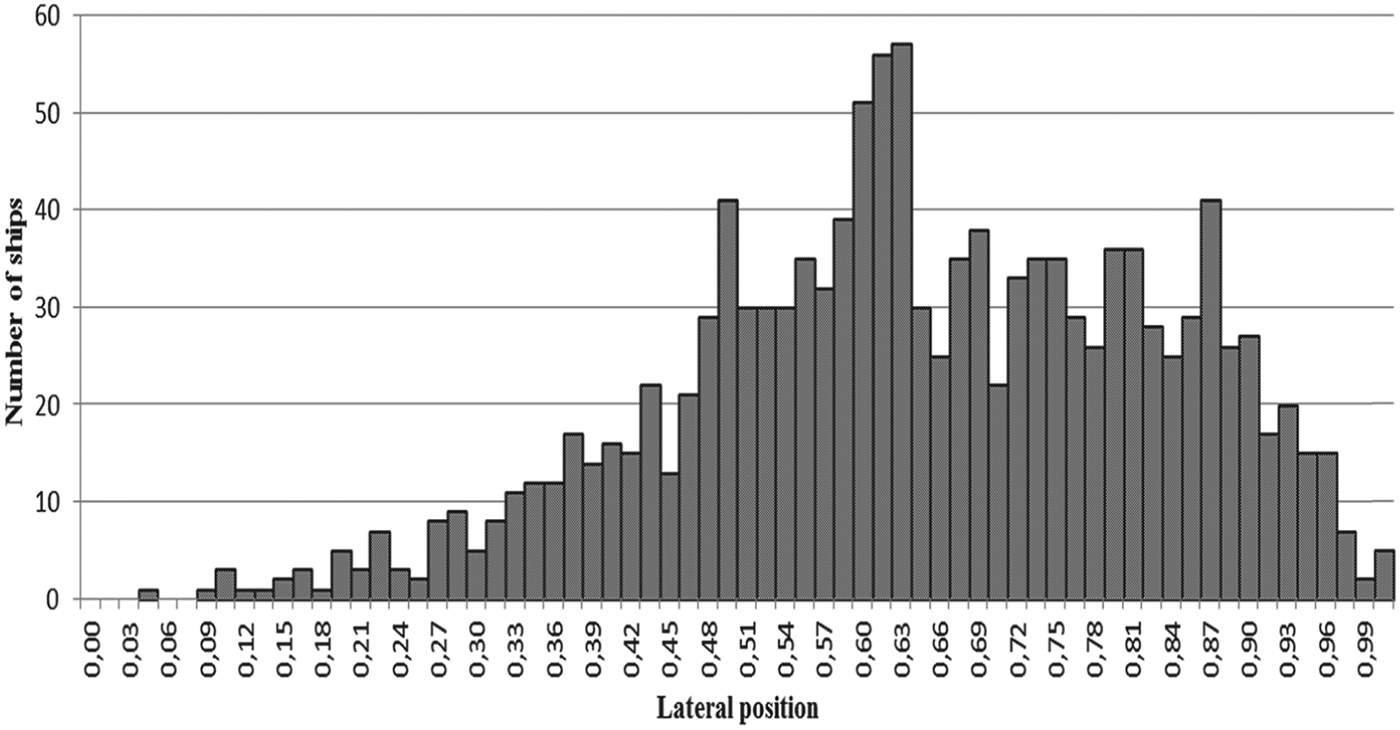
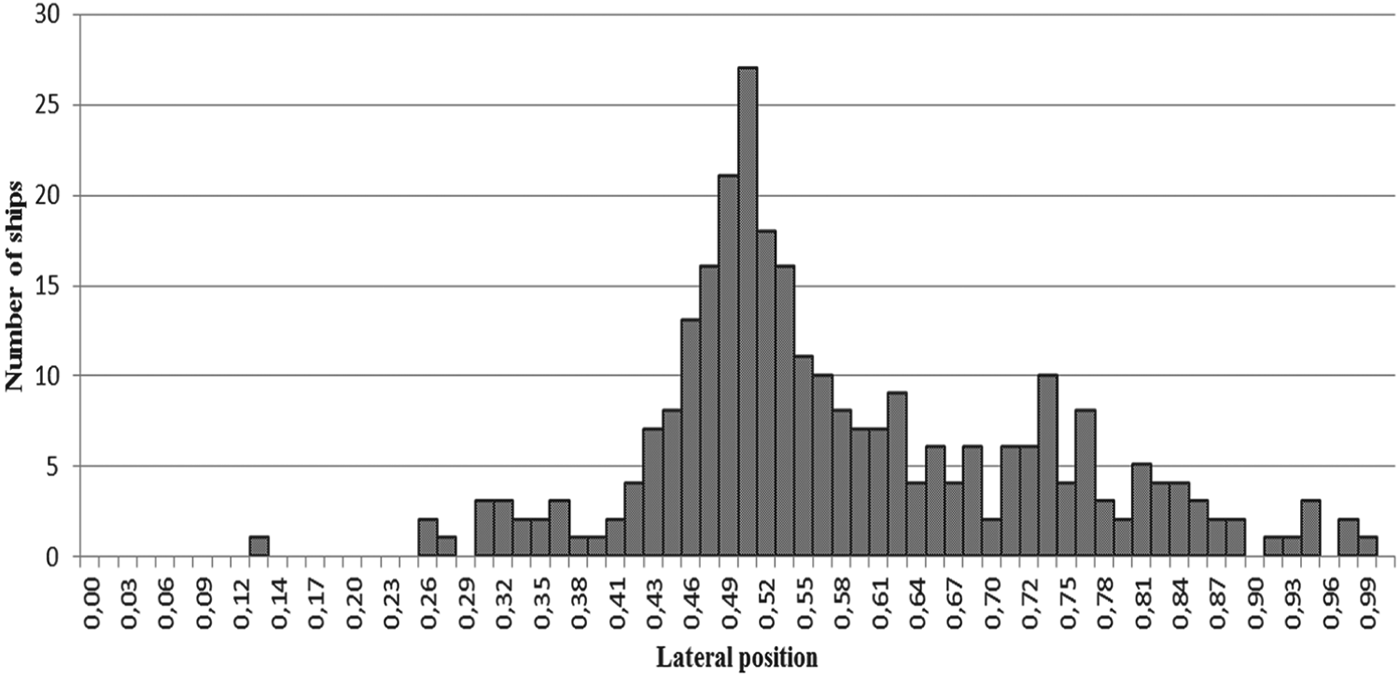
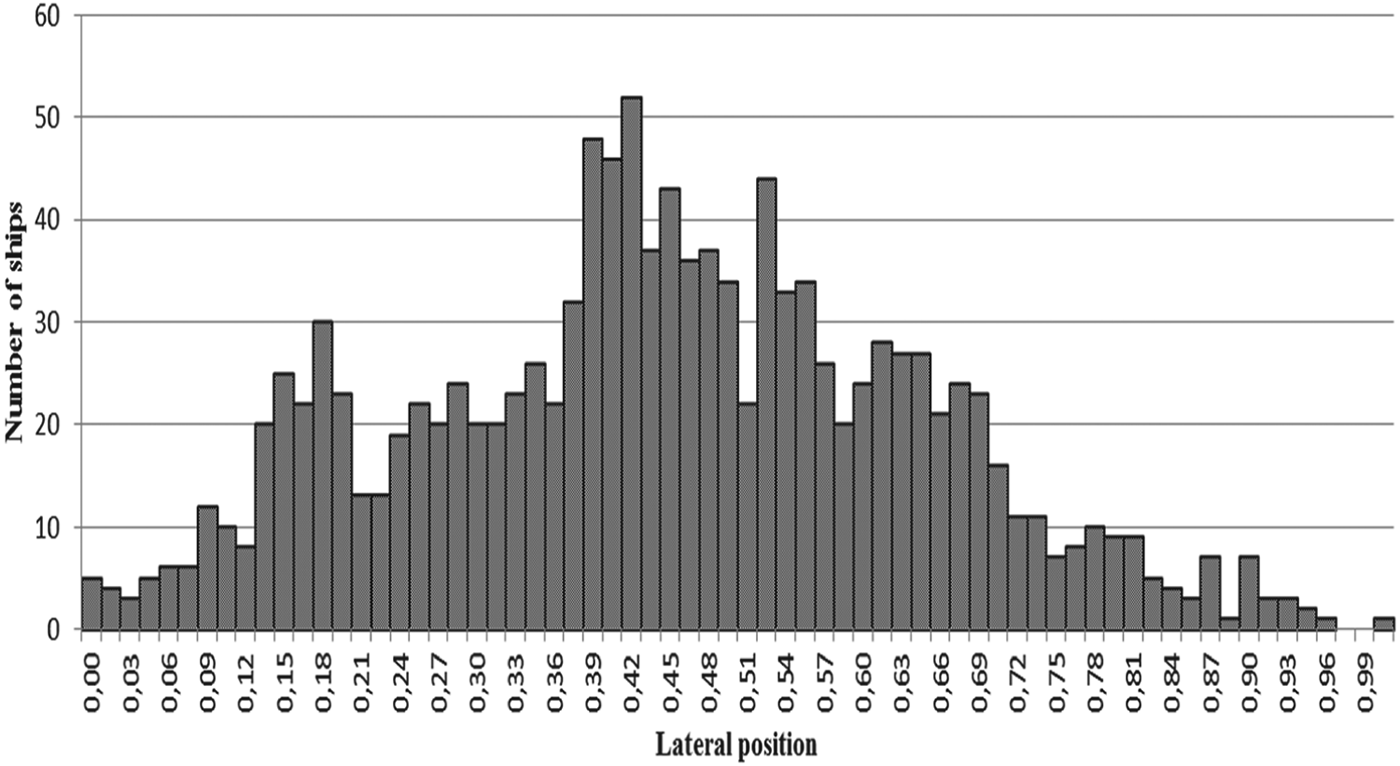
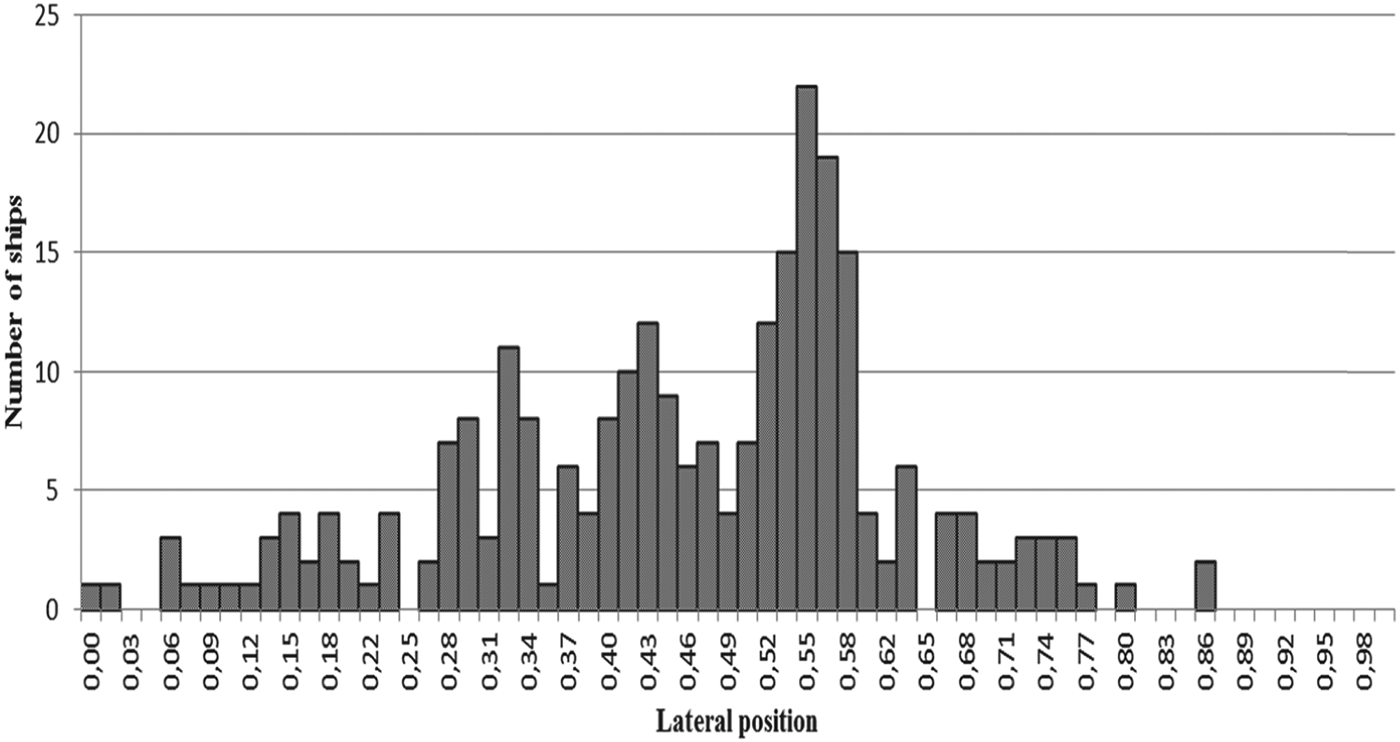
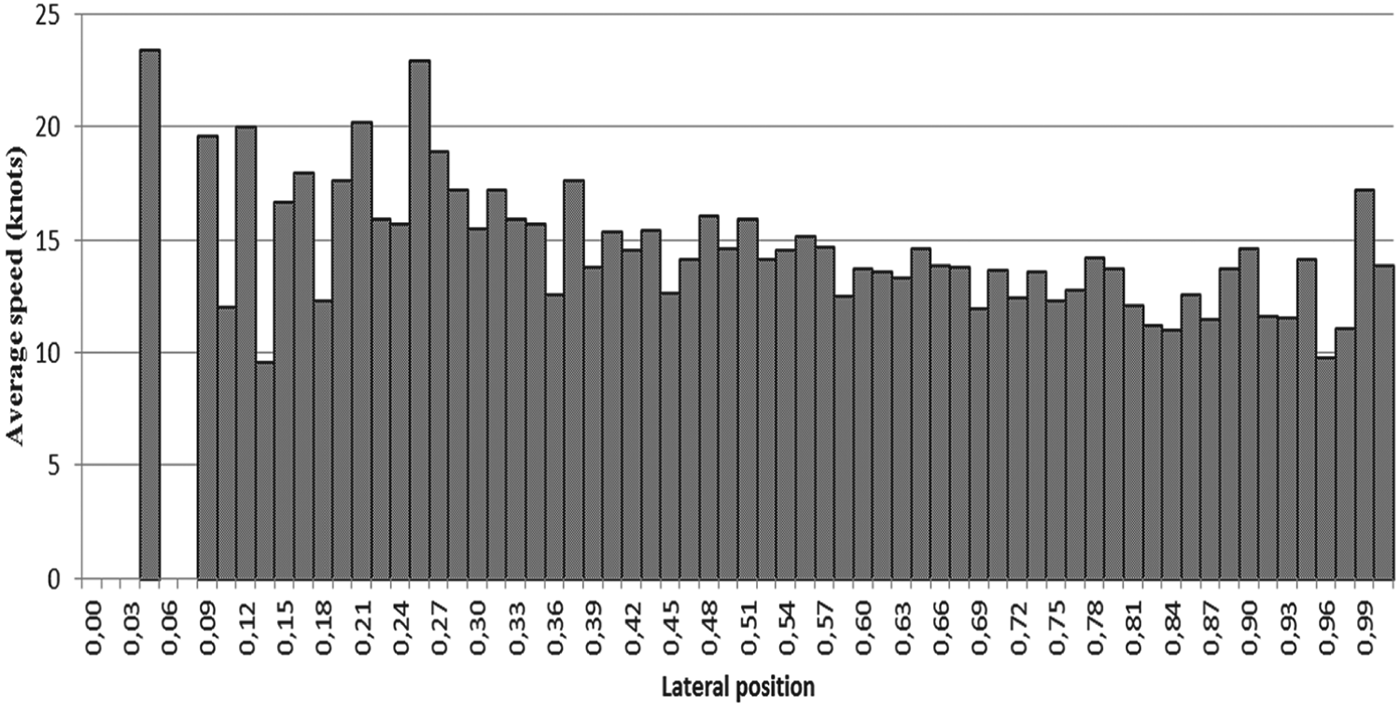
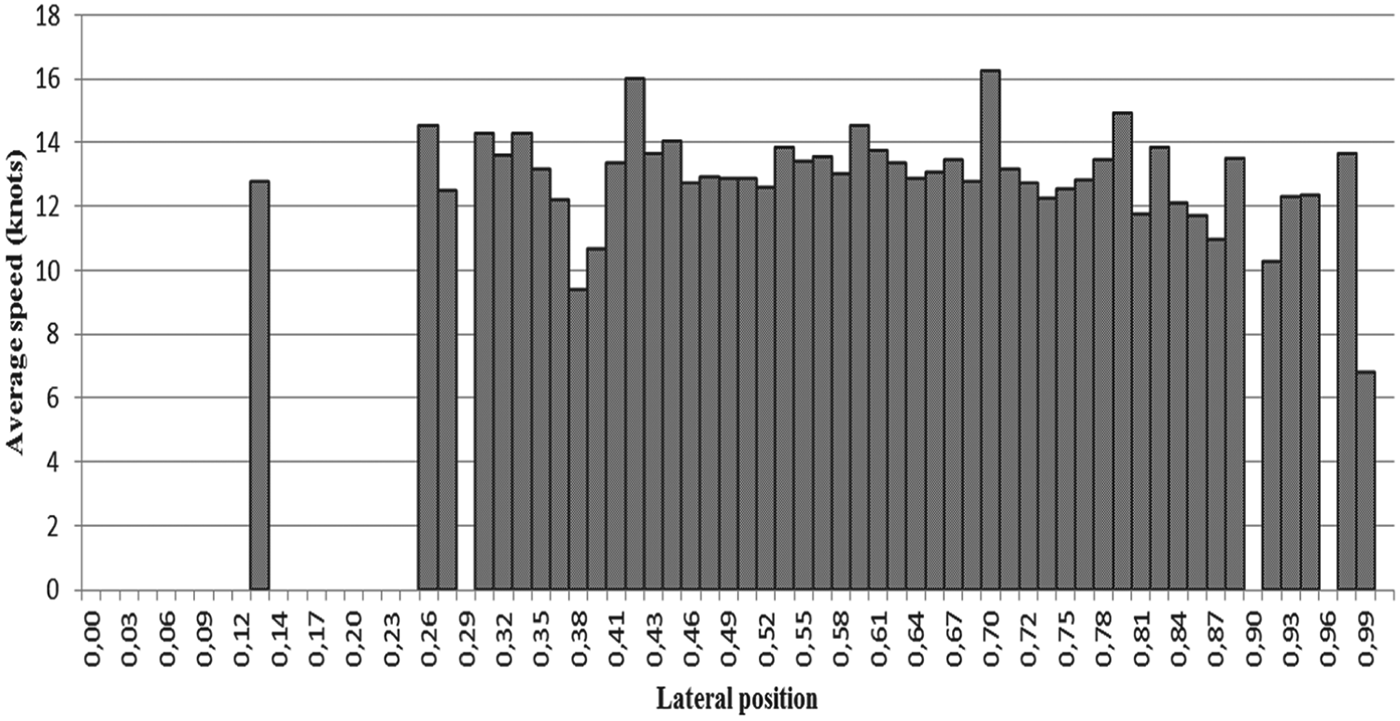
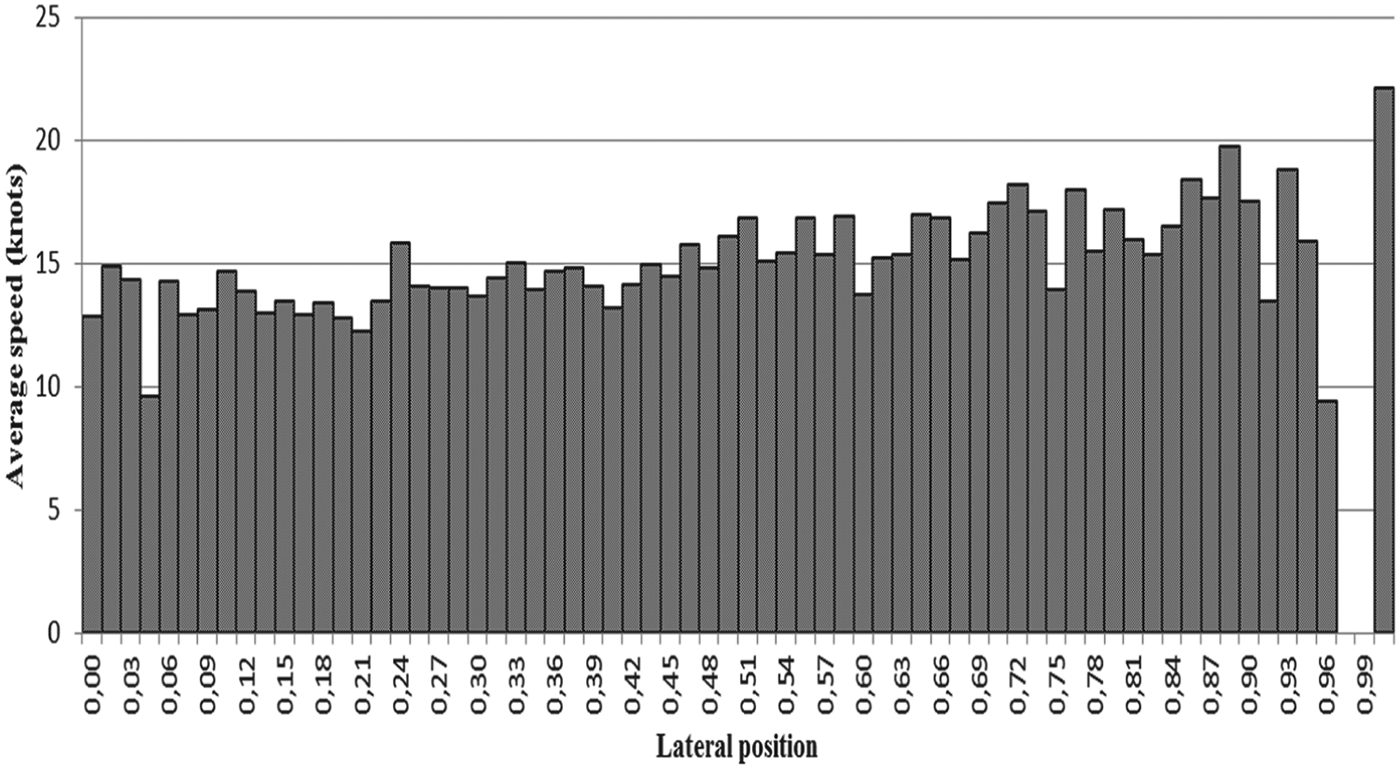
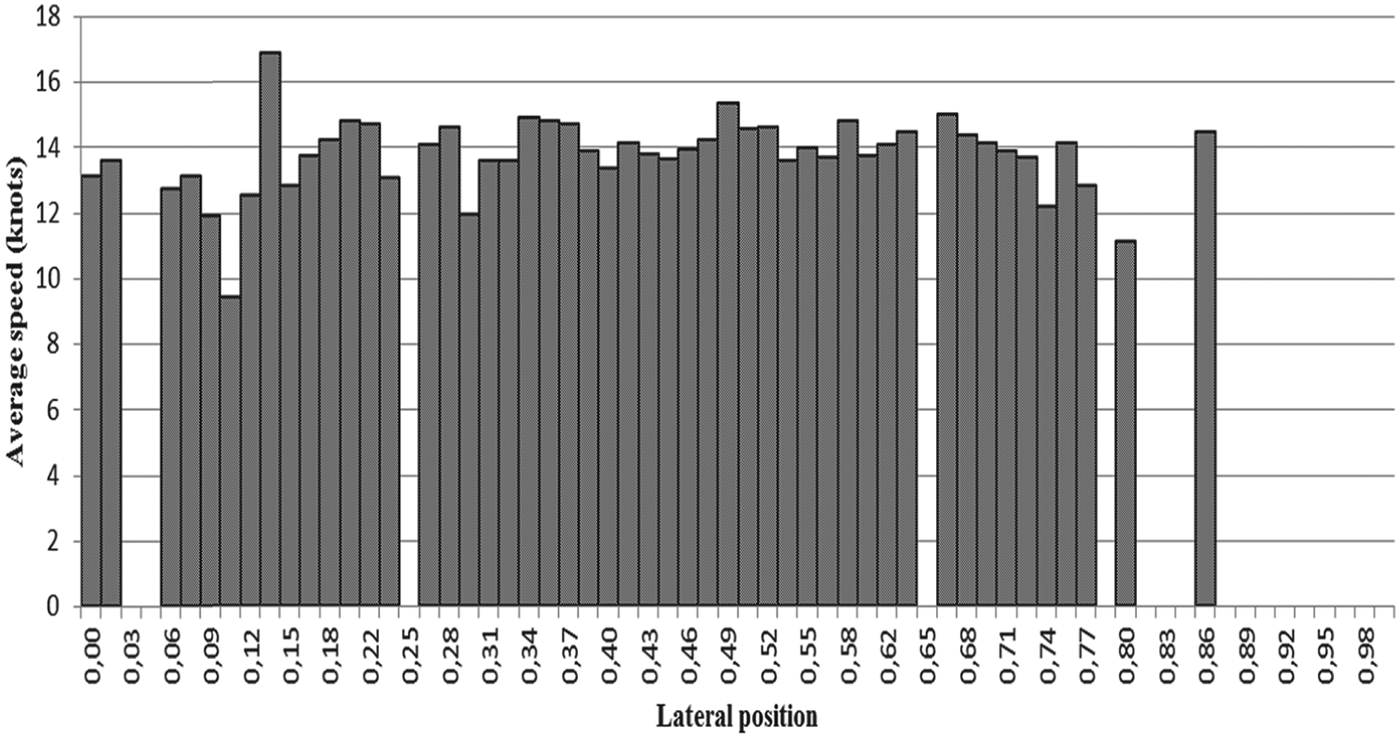
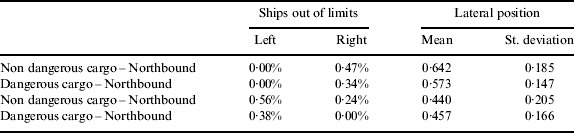
The lateral distribution of traffic for each traffic lane is shown in Figures 2–5, and the average speeds of vessels using the traffic lanes is shown in Figures 6–9. The lateral positions shown in the pictures are non-dimensionalised to each traffic lane's width. Table 4 shows the mean value and standard deviation of the lateral position, and the percentage of vessels passing out of the traffic lane's limits. Lateral position and speed were measured when crossing the parallel 38° 45′N.
Traffic distribution – non-dangerous cargo traffic lane, northbound.
Traffic distribution – dangerous cargo traffic lane, northbound.
Traffic distribution – non-dangerous cargo traffic lane, southbound.
Traffic distribution – dangerous cargo traffic lane, southbound.
Distribution of average speeds – non cargo traffic lane northbound.
Distribution of average speeds – dangerous cargo traffic lane, northbound.
Distribution of average speeds – non dangerous cargo traffic lane, southbound.
Distribution of average speeds – dangerous cargo traffic lane, southbound.
Ships out of traffic lanes' limits, mean values and standard deviation of lateral position relative to traffic flow, off Cape Roca TSS.
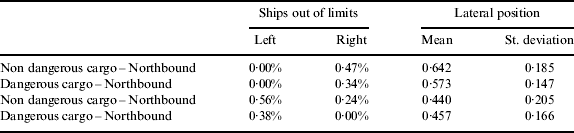
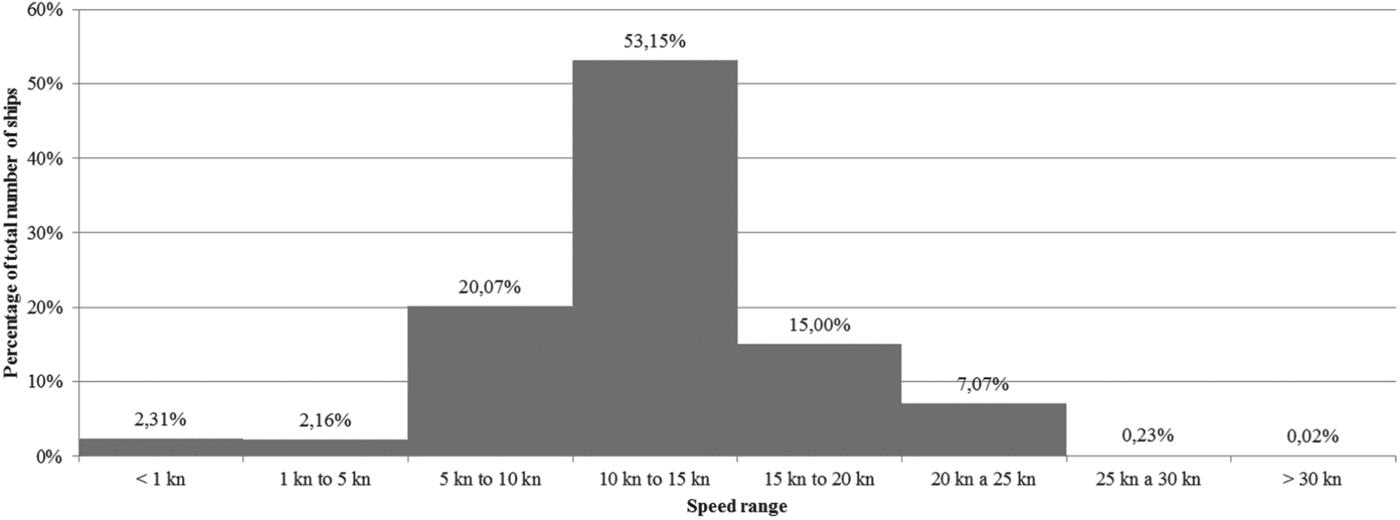
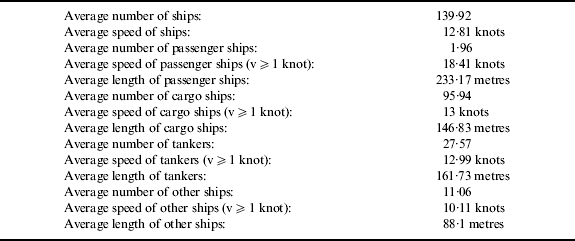
Table 5 shows some information about traffic in the area covered by this study, collected from AIS data using the same set of programs. Average speeds were calculated for ships with speed over 1 knot to discard vessels at anchor or drifting. The distribution of ships' speeds in the total area covered by this study is shown in Figure 10.
Distribution of ships' speeds, total area studied.
General traffic information for the studied area.
4. TRAFFIC CHARACTERISATION ON SELECTED ROUTES
AIS data can be an important source of information to determine the relative importance of routes leading in and out of ports, or to characterize risks associated with crossing routes or waterways. This information can then be used as an input for risk assessment models, which in turn can be used to provide real time warnings to crews about higher risk areas on the approaches to port or during the sea passage.
4.1. Characterisation of a route
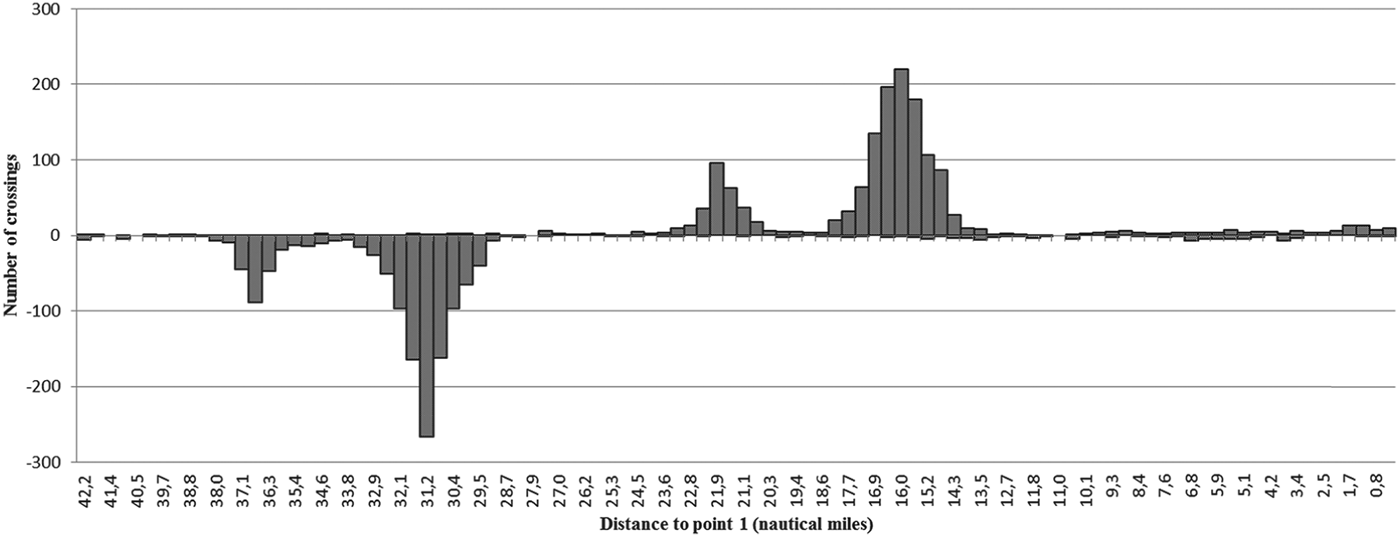
A program was developed to determine the number of ships using a route and to characterise traffic crossing a route, and it was applied to a part of the route between the port of Lisboa and the archipelago of Madeira. The route was studied between the points P1 (38° 30·86′N/009°30·96′W) and P2 (38° 01·02′N/010° 09·05’ W) (see Figure 11).
Traffic density and route between Point 1 and Point 2.
The results showed that the route Lisboa to Madeira was used 26 times and that the route Madeira to Lisboa was used 12 times. It was also registered that this part of the route was crossed 1414 times from the NW to the SE, and 1521 times from the SE to the NW. Figure 12 shows the number of crossings and their position on the studied part of the route.
Route crossings between point 1 and point 2.
4.2. Characterisation of routes associated with ports
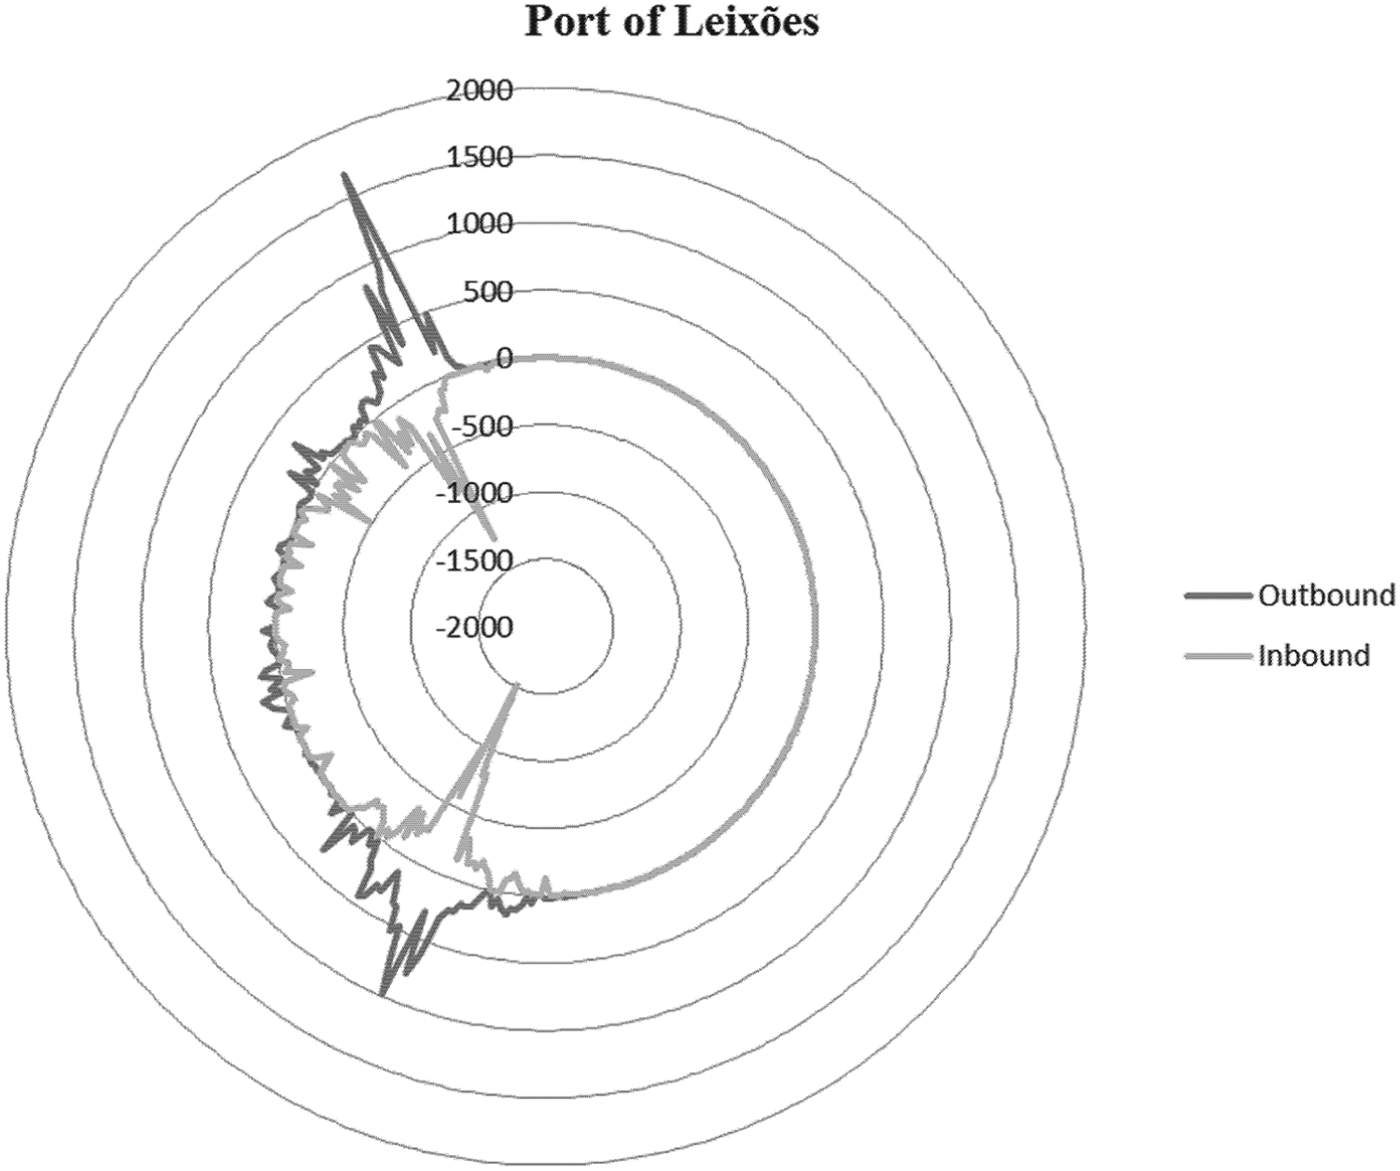
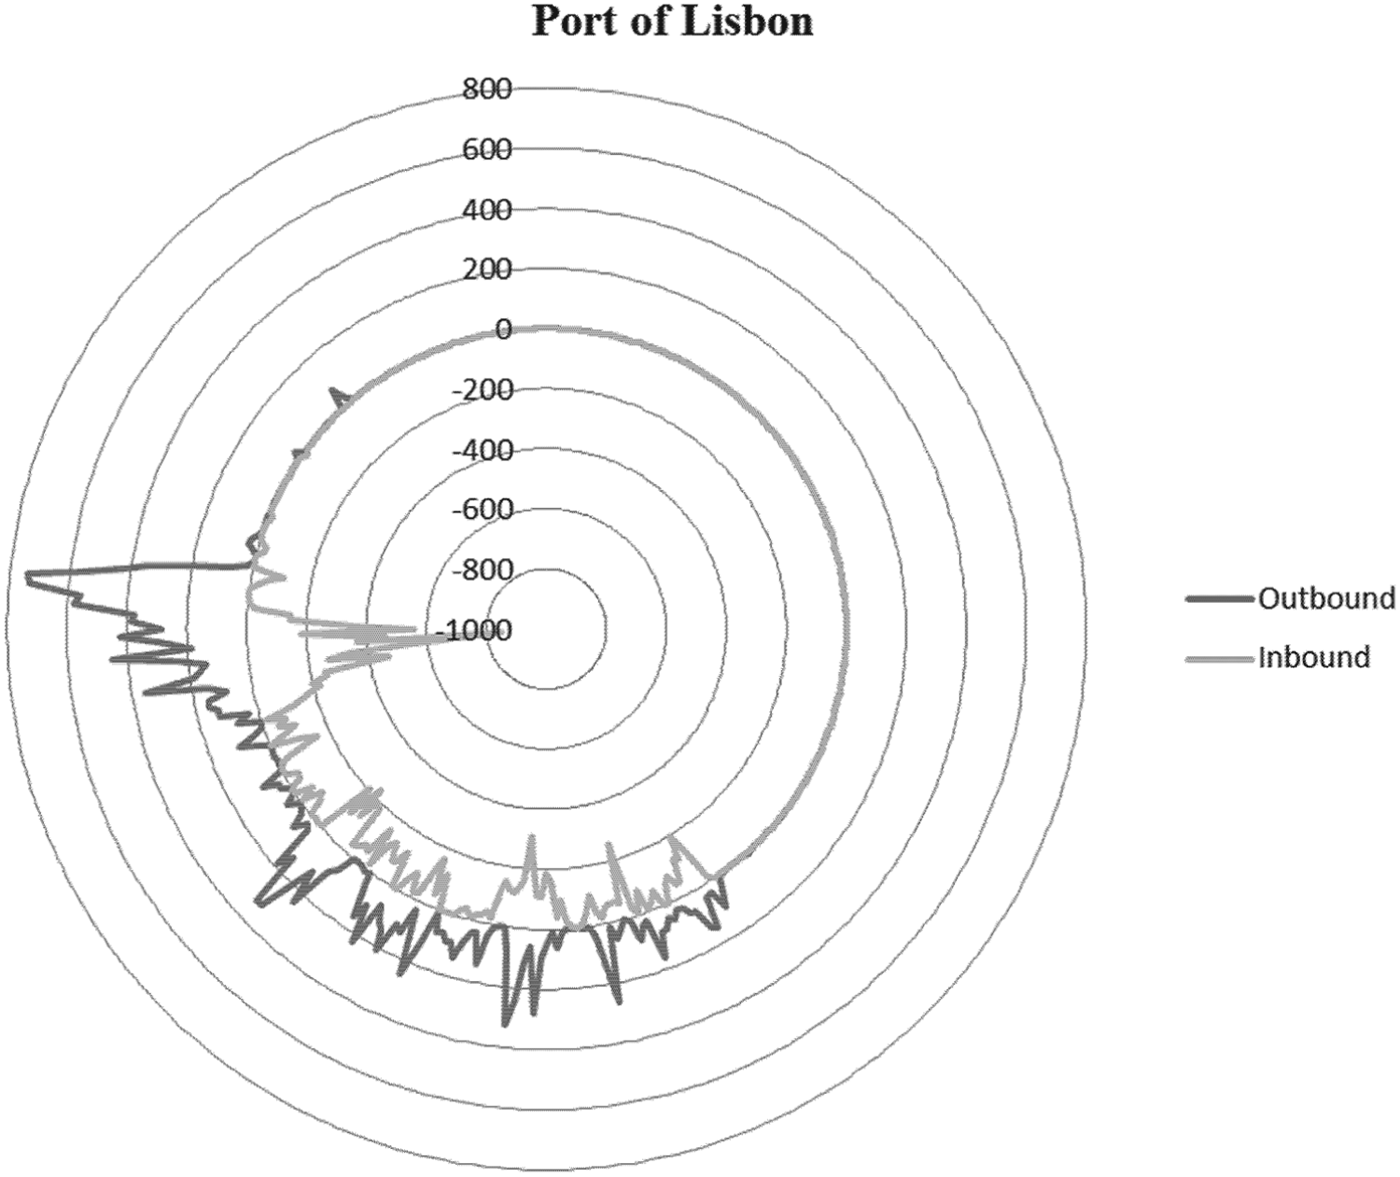
The routes used by ships approaching or leaving ports can also be characterized using AIS information. A program was developed to assess the relative importance of routes associated with ports. A reference point is chosen for each port, and the bearing to that point of AIS messages transmitted by ships entering or leaving the port is recorded. The results for the ports of Leixões and Lisboa are shown in Figure 13 and Figure 14, respectively.
Number of AIS messages received according to bearing, Port of Leixões.
Number of AIS messages received according to bearing, Port of Lisbon.
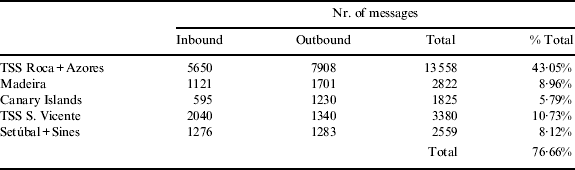
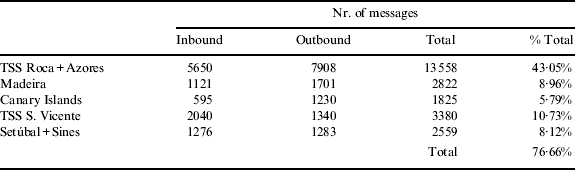
From Figure 14, it is possible to identify bearings with a greater number of messages, which should correspond to the routes associated with the port of Lisbon that are used more often. These major routes associated with a port can also be identified using Figure 1. Table 6 represents the number of messages received by ships using the major routes associated with the port of Lisboa.
AIS messages corresponding to the major routes associated with the port of Lisbon.
5. RISK OF SHIP-SHIP COLLISION OFF THE PORTUGESE COAST
5.1. Ship collision models
Risk can be defined as the probability of occurrence of an unwanted event multiplied by the consequences of that same event. While the consequences of a ship collision are an important part of risk assessment, this paper focuses on the probability of occurrence of a ship collision. This probability can be estimated based on statistical information of previous occurrences, but this information is not always available, and changes in traffic volume, regulations or other factors can render it useless. Thus, other methods have been developed to overcome this.
The most common approaches used to assess the probability of ship collisions are based on the work of Fujii and Tanaka (Reference Fujii and Tanaka1971). This model was modified by Pedersen (Reference Pedersen1995) and used extensively in studies assessing the safety of navigation in European waters.
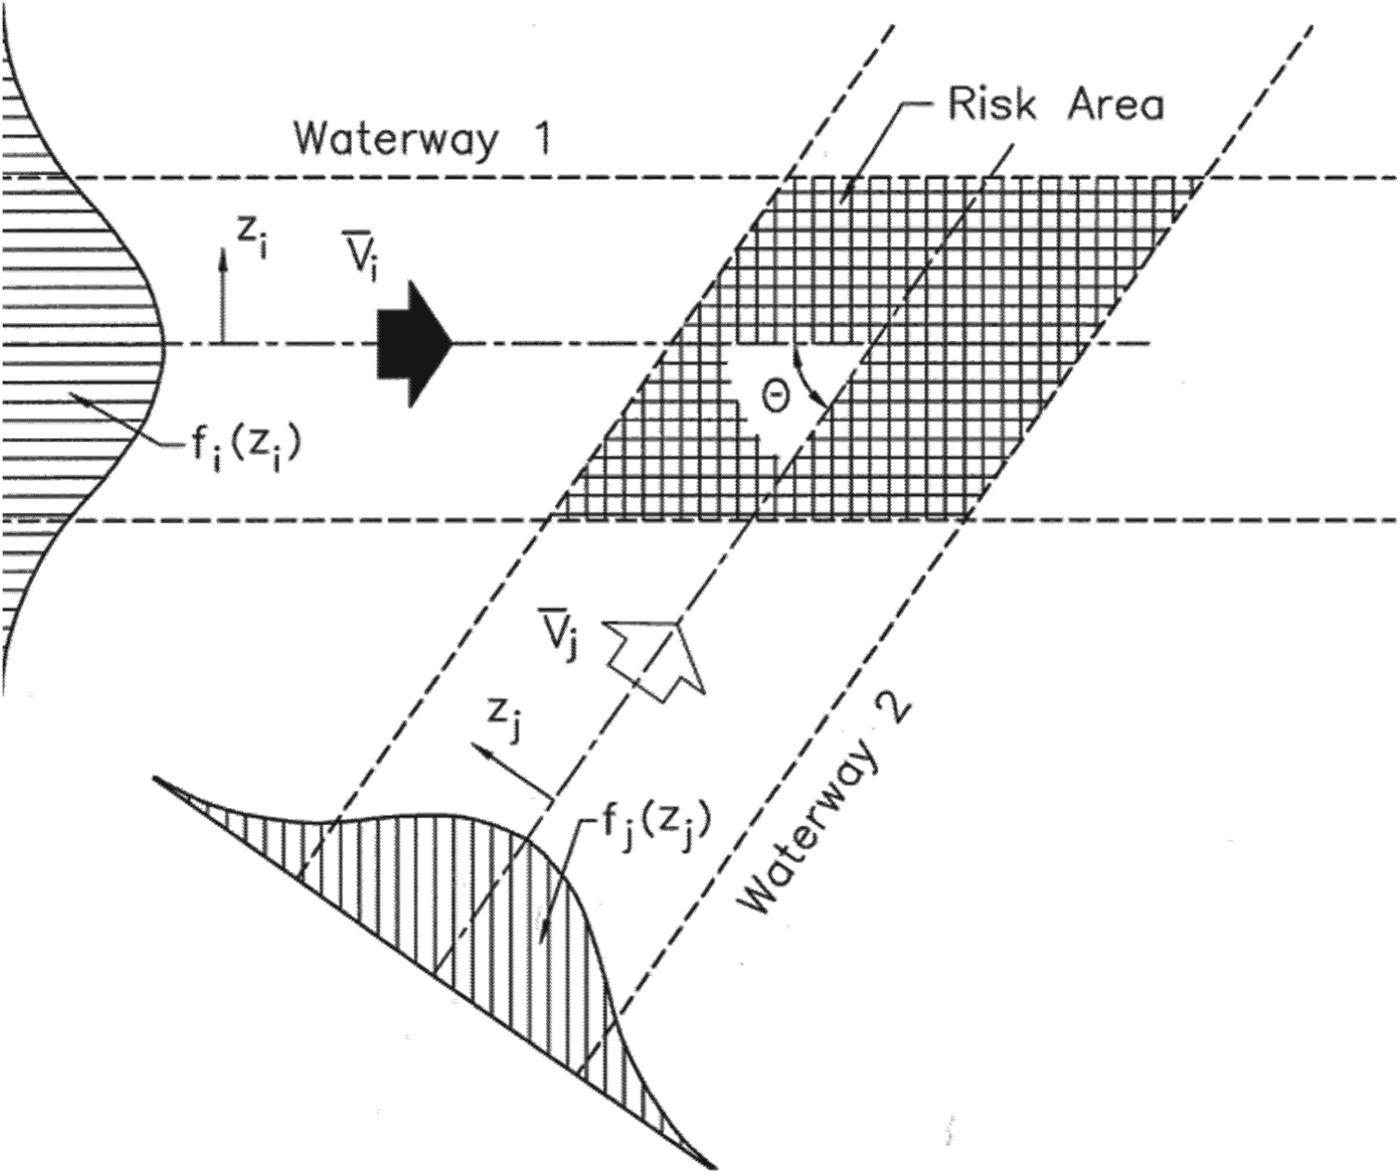
Pedersen's model is applied to the crossing of two waterways (Figure 15), and the number of potential, or expected, collisions is defined as
 $$P = N_A P_C $$
where N A is the number of collision candidates and P C is the causation probability, or the probability of a collision candidate becoming a collision (Macduff, Reference MacDuff1974; Fujii et al., Reference Fujii, Yamanouchi and Mizuki1974; Fowler and Sørgård, Reference Fowler and Sørgård2000; Otto et al., Reference Otto, Pedersen, Samuelides and Sames2002; Rosqvist et al., Reference Rosqvist, Nyman, Sonninen and Tuominen2002; Kujala et al., Reference Kujala, Hanninen, Arola and Ylitalo2009; Hänninen and Kujala, Reference Hänninen and Kujala2010; Montewka et al., Reference Montewka, Hinz, Kujala and Matusiak2010).
Crossing waterways (Pedersen, Reference Pedersen1995).
The number of collision candidates is taken as
 $$N_a = \mathop \sum \limits_i \mathop \sum \limits_j \int\limits_{\rm \Omega} {\int\limits_{(z_i, {\rm \;} z_j )} {\displaystyle{{Q_{1i}. Q_{2j}} \over {V_i^{(1)}. V_j^{(2)}}}}}\ f_i^{\,(1)} (z_i )\,.\,f_j^{\,(2)} (z_j )V_{ij} D_{ij} dA\Delta t $$
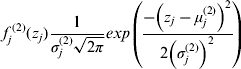
where i and j are the ship classes, Q 1i is the number of class i ships using waterway 1 during time period Δt, Q 2j is the number of class j ships using waterway 2 during time period Δt, V i(1) is the average velocity of class i ships on waterway 1, V j(2) is the average velocity of class j ships on waterway 2, z i is the distance of class i ships to the centre of waterway 1, z j is the distance of class j ships to the centre of waterway 2 and f is the lateral distribution of traffic using a waterway. A Gaussian distribution is often used when lacking better information:
 $$f_j^{\,(2)} (z_j )\displaystyle{1 \over {\sigma _j^{(2)} \sqrt {2\pi}}} exp\left( {\displaystyle{{ - \left( {z_j - \mu _j^{(2)}} \right)^2} \over {2\left( {\sigma _j^{(2)}} \right)^2}}} \right)$$
where μ j(2) is the mean value of z j and σ j(2) is the standard deviation.
V ij is the relative velocity between class i and class j vessels, and is defined as
 $$V_{ij} = \sqrt {\left( {V_i^{(1)}} \right)^2 + \left( {V_j^{(2)}} \right)^2 - 2V_i^{(1)} V_j^{(2)} cos\theta} {\rm \;} $$
where θ is the crossing angle of the two waterways.
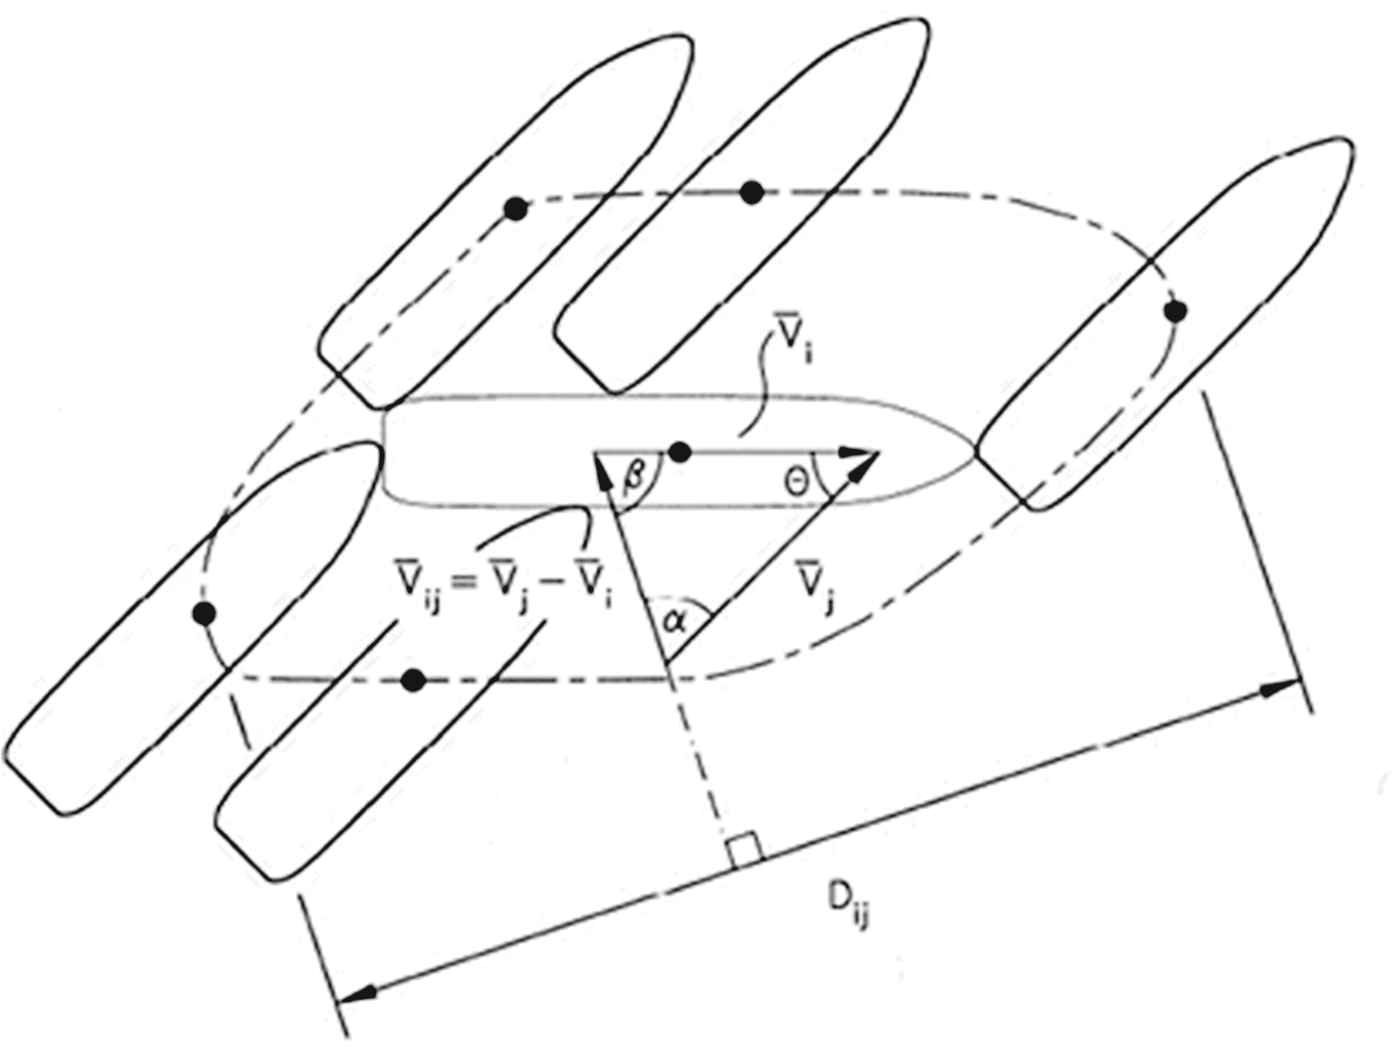
The geometrical collision diameter (D ij) is defined by Pedersen (Reference Pedersen1995) as (Figure 16):
 $$\eqalign{D_{ij} = \displaystyle{{L_i^{(1)} V_j^{(2)} + L_j^{(2)} V_i^{(1)}} \over {V_{ij}}} sin\theta + B_j^{(2)} \left\{\! {1 - \left( {sin\theta \cdot \displaystyle{{V_i^{(1)}} \over {V_{ij}}}} \right)^2} \right\}^{1/2}\!\!\!+ B_i^{(1)} \left\{\! {1 - \left( {sin\theta \cdot \displaystyle{{V_j^{(2)}} \over {V_{ij}}}} \right)^2} \right\}^{1/2}} $$
where L i(1) is the length of class i ships on waterway 1, L j(2) is the length of class j ships on waterway 2, B i(1) is the breadth of class i ships on waterway 1 and B j(2) is the breadth of class j ships on waterway 2.
Geometrical collision diameter.
The causation probability (P C) can be estimated using two approaches: the scenario approach or the synthesis approach. The scenario approach is used if the causation probability is calculated based on available accident data. The synthesis approach relies on the application of a fault tree or a Bayesian Belief Network (BBN) to estimate the causation probability such as in the maritime traffic risk assessment software GRACAT (Friis-Hansen and Simonsen, Reference Friis-Hansen and Simonsen2001).
A BBN is an acyclic graph consisting of nodes and relationships of a probabilistic nature that show their reciprocal influences (Jansen, Reference Jansen2001). The nodes represent variables with a finite number of states, and directional arcs connecting the nodes represent the probabilistic causal dependence between the variables. BBN have also been used extensively in the analysis of maritime transportation risks and maritime accidents (e.g. Trucco et al., Reference Trucco, Cagno, Ruggeri and Grande2007; Antão et al., Reference Antão, Grande, Trucco, Guedes Soares, Martorell, Guedes Soares and Barnett2008).
These studies are based on the assumption that the ships will continue their course and speed until collision. However it will certainly happen in some cases that last minute collision avoidance manoeuvres will be made, reducing the number of collisions that really occur. Furthermore, the use of intelligent collision avoidance systems (Perera et al., Reference Perera, Carvalho and Guedes Soares2011, Reference Perera, Carvalho and Guedes Soares2012a,Reference Perera, Oliveira and Guedes Soaresb) will increase the percentage of cases in which avoidance is achieved. However, this will reduce the absolute number of collisions, while the previous formulation is still valid and probably would need to be affected by a correction factor.
5.2. Estimation of collision candidates based on AIS data
To calculate the number of potential ship-ship collisions according to the Pedersen's model (Reference Pedersen1995), one needs to calculate the number of collision candidates (N A) (Equation 2) in a specific crossing of two waterways characterized in probabilistic terms. However, it can be seen from observation of Figure 1 that the number of crossings is high, and that in some areas the traffic patterns are too dispersed to identify a specific crossing for application of Pedersen's model.
An approach is therefore suggested in which the number of collision candidates (N A) is calculated directly from decoded AIS data and the concept of collision diameter defined by Pedersen (Reference Pedersen1995) as opposed to the use of Equation 2. This approach calculates the number of collision candidates by estimating the future positions of ships and the distance between them, based on the positions, courses and speeds given by the AIS messages, and compares that estimation with the collision diameter defined by Pedersen (Reference Pedersen1995). This calculation was performed at time intervals of 30 seconds, and the distances were estimated for the next 20 minutes. If the estimated distance between any two ships is less than the collision diameter for those two ships, the pair is considered a collision candidate.
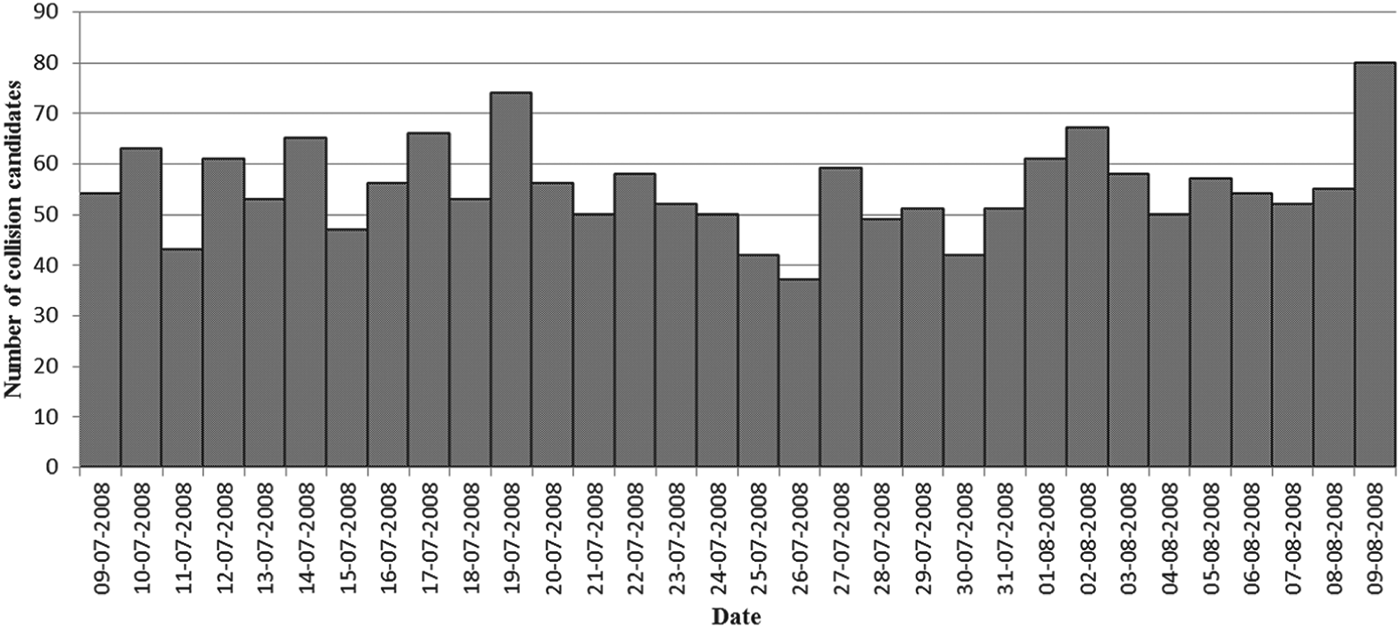
Figure 17 shows the number of collision candidates per day, between 9 July 2008 and 9 August 2008, calculated using the suggested approach. Figure 18 shows the geographic distribution of the identified collision candidates.
Collision Candidates per day (N A).
Geographic distribution of collision candidates (N A).
A total of 1766 collision candidates were identified in the period under analysis. This corresponds to an average number of 55 collision candidates per day off the coast of Portugal. These values correspond to the number of vessels sailing at a distance from each other smaller than the collision diameter defined for a particular pair of ships, which depends on their speeds, lengths and relative bearing. The definition of collision diameter can be further improved by considering other characteristics of the ships that influence, for example, their manoeuvrability, and therefore the capability to avoid a collision.
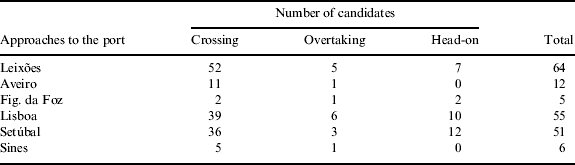
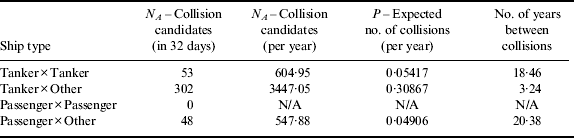
Since the assessment of the collision candidates is performed on the basis of AIS data, which contains relevant information on the ships, the approach suggested provides important information for risk analyses. For example, the collision candidates can be divided according to the type of ship involved (Table 8) or by the type of collision, as shown in Table 7. The type of collision depends on the relative course of the collision candidates, i.e., ships with a course difference less or equal to 10° are considered candidates for overtaking collision, the ones with a course difference greater or equal to 170° are considered candidates for head-on collision, and all the others are considered candidates for crossing collision.
Collision candidates by type of collision (N A).

Collision candidates by ship type (N A).

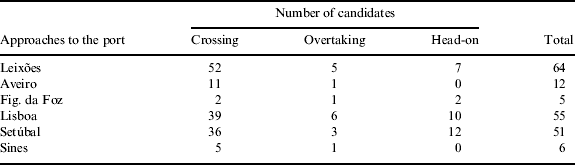
The procedure can also be applied to specific areas, such as on the approaches to the ports, where the number of collision candidates is typically large, as shown in Table 9.
Collision candidates on the approaches to the ports (N A).
5.3. Expected number of ship collisions
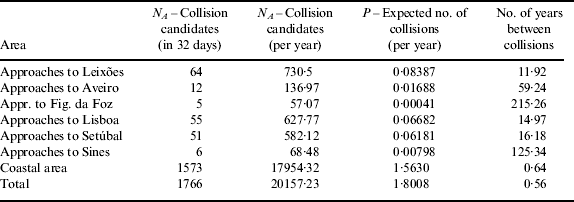
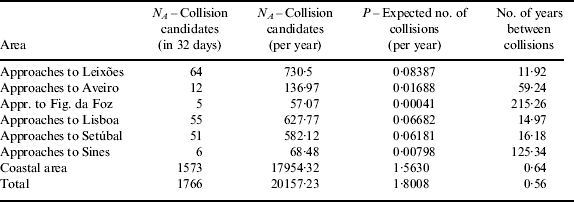
The expected number of ship collisions (P) can be now estimated by multiplying the number of collision candidates (N A) by a causation probability (P C) that is the probability of a collision candidate becoming a collision. For this purpose, generic causation probability values of 1·3×10−4 for crossing ships and 4·9×10−5 for ships on parallel courses (overtaking and head-on) proposed by Kujala et al. (Reference Kujala, Hanninen, Arola and Ylitalo2009) and Montewka et al. (Reference Montewka, Hinz, Kujala and Matusiak2010) were adopted. It should be noted that although these values of causation probability are commonly used in several studies, they do not take into account the specific characteristics of the covered area.
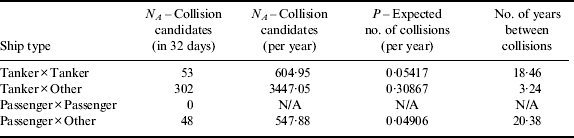
The results obtained from the calculation of the expected number of collisions are shown in Table 10. The table presents the number of collision candidates (N A) calculated using 32 days of AIS data, which are then extrapolated to a time period of one year and then used to predict the expected number of collisions per year (P) using the causation probabilities adopted. It can be seen that the total number of expected collisions per year is 1·8. Table 10 also shows the results obtained for costal and different port areas. Table 11 shows the expected number of ship collisions by ship type.
Expected number of collisions (P).
Expected number of collisions (P) by ship type.
The expected number of ship collisions per year estimated from 32 days of AIS data can be compared with historical ship collision data collected by the Portuguese Maritime Authority. According to Gouveia et al. (Reference Gouveia, Antão, Guedes Soares, Guedes Soares, Teixeira and Antão2007), six collisions involving merchant vessels occurred between 1997 and 2006 (excluding 2002 and 2003 due to unavailable data), which averages 0·75 collisions per year. This value is relatively smaller than the 1·8 expected ship collisions per year estimated from the AIS data. This difference can be attributed to factors such as the small size of the available AIS data set, covering only one month, requiring extrapolation and not considering possible seasonal influences. Moreover, the world fleet has increased from the period 1997–2006 to 2008 (84264 ships in 1996 and 99741 ships in 2008), which also contributes to the higher number of collisions predicted from 2008 AIS data when compared with the number of actual collisions that occurred in the period 1997–2006. Finally, the value of causation probability used does not reflect the specific characteristics of the covered area. In light of these considerations the value obtained for the expected number of collisions (approximately 1·8) can be deemed acceptable.
6. CONCLUSIONS
This paper has demonstrated that Automatic Identification System (AIS) data provide a very useful source of information for maritime traffic studies. In addition to simple decoding for visualization purposes, AIS records have been used to perform statistical analyses of the maritime traffic and to calculate the expected number of collisions off the coast of Portugal. The suggested approach for estimating the expected number of collisions was derived from the number of collision candidates calculated directly from decoded AIS data and using the concept of collision diameter defined by Pedersen (Reference Pedersen1995). This approach can be used to identify collision candidates in complex traffic patterns and therefore is not limited to the analysis of specific crossings of two waterways characterized in probabilistic terms, as considered in Pedersen's model.
A total of 1766 collision candidates were identified in the period under analysis (32 days). This value corresponds to the number of vessels sailing at a distance from each other smaller than the collision diameter defined for a particular pair of ships, which depends on their speeds, lengths and relative bearing. After extrapolation for the one-year period and using generic values of causation probability, 1·8 collisions per year off the coast of Portugal were estimated.
The expected number of collisions estimated using the suggested approach was then compared with the average number of collisions per year derived from historical data on ship collisions collected by the Portuguese Maritime Authority. It was shown that the estimated number of 1·8 collisions per year is larger than the 0·75 collisions per year that have occurred in the period 1997–2006. The increase of the world fleet in the last decades, the limited size of the AIS data set available for the study and the values of causation probability adopted that do not take into account the specific characteristics of the covered area, can explain this difference.
Finally, the importance of the identification of the collision candidates using AIS data should be emphasized. This provides an instant measure of the collision risk and anticipates problems so that preventive actions can be taken before a collision occurs and mitigation plans can be developed using a risk-based approach. Therefore, the identification of the collision candidates is comparable in terms of benefits with the investigation and analysis of incidents that also provide important insights into the level of risk and effective means of improving the safety and reliability of facilities and processes.
ACKNOWLEDGEMENT
The authors would like to thank the Portuguese coastal Vessel Traffic Service (VTS) control centre (CCTMC) for providing the AIS data used in this study.