Studies on healthcare providers' behaviour occupy centre stage in health policy and economics research. The patterns of providers' behavioural changes in response to different insurance systems and payment arrangements have been richly documented in the literature. To understand these changes, it is necessary to look at the shifts in fundamental economic incentives.Footnote 1 However, provider behaviour is not solely driven by economic incentives; it is also subject to adjustment when administrative constraints are realigned.
This article examines how public hospitals, in the Chinese context, react to an administrative mandate of cost containment while the economic incentive scheme remains unchanged and government subsidies continue at a low level. It looks at the reasons and consequences of these changes, and considers how Chinese public hospitals engage in various opportunistic practices even when constrained by strengthened administrative measures. By analysing the dynamics of a cost-containment policy intervention led by a Chinese provincial health administration, it provides valuable reference to the nationwide cost containment campaign started in 2011.
China's healthcare has undergone a dramatic transformation in the past three decades. The massive autonomization of hospital management, coupled with perverse incentives, has significantly motivated provider behaviour towards profit-maximization.Footnote 2 Past studies have examined how the problematic pricing policy and bonus system provided rich incentives for physicians to generate excessive revenues.Footnote 3 Recent years have seen more investigations into the impacts of insurance systems and alternative payment arrangements on the behavioural changes of Chinese healthcare providers.Footnote 4 Two main conclusions have emerged: a more scientific method than the fee-for-service system is needed for paying healthcare providers, and increased insurance coverage must be accompanied by appropriate cost containment mechanisms.Footnote 5
The existing literature tends to presume that the Chinese health bureaucracy is weak and incompetent and that the old administrative control mechanisms under the planned economy have largely collapsed during the market transition.Footnote 6 It follows that, when conflicted with powerful economic incentives, administrative measures are unable to penetrate the hospital system, especially in difficult policy areas such as cost containment where a plethora of hard interests intertwines and is hard to unravel.
In a companion paper, it is revealed that by revising the administrative incentive structure on the supply side, the Chinese local health bureaucracy is able to contain rapid cost inflation in the short term with concerted and targeted administrative action, and that this rests on the reassertion of the health bureaucracy's statutory authority in regulating the medical system.Footnote 7 This article shows the flip side. It shows that while they have to abide by administrative directives to control costs, Chinese public hospitals still manage to defend their economic interests by engaging in various opportunistic practices. It analyses a panel database from Fujian province and reveals the strategies adopted by public hospitals and their implications. This article argues that while the potential of administrative action in cost containment has been largely downplayed, it still suffers from several inherent limitations which further induce various undesirable consequences under the existing complex incentive scheme. Hence, this article informs China's ongoing national healthcare reform that using administrative action to contain cost escalation is by nature transitional and temporary, and that the effective use of administrative action requires much stronger government capacities than might have been anticipated.
Policy Background
Like many other countries, China has been experiencing a rapid escalation in healthcare costs for decades, bringing about a multitude of economic, societal and health consequences (see Figure 1).Footnote 8 Despite ambitious reforms in national healthcare over the past four years, costs continue to spiral, and health minister, Dr Chen Zhu, has admitted that healthcare still stands as a heavy financial burden to most Chinese citizens.Footnote 9
Total Health Expenditure (and its Share in GDP) and Government Health Expenditure in China, 1990–2009

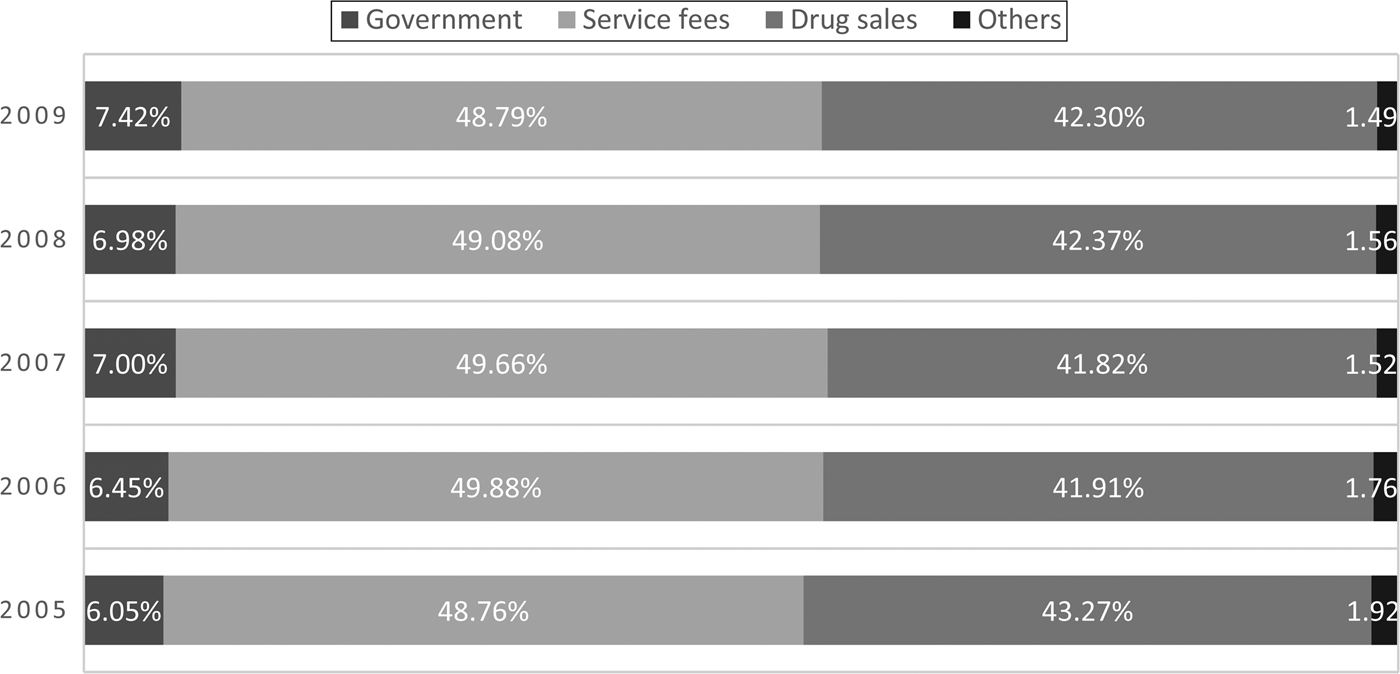
Rapid cost inflation has been predominantly driven by physicians over-prescribing drugs and technological-intensive equipment and procedures in response to the perverse incentives created to increase demand.Footnote 10 This is evidenced by the constant high percentage of drug income in overall hospital income (more than 40 per cent on average; see Figure 2). Fierce competition for state-of-the-art medical technologies and equipment among hospitals results in inefficiencies and massive amounts of waste.
Sources of Income for Government-funded Hospitals, 2005–2009
While hoping that the ongoing national healthcare reform started in 2009 would address the root causes of continuously rising costs, the Ministry of Health (MOH) has realized that it is imperative to take immediate administrative action. Despite many previous statements on the critical importance of containing skyrocketing health expenditure, the 2011 National Health Work Conference announced that the MOH would put cost containment top of its agenda and lead the entire health bureaucracy in this battle. It stressed the crucial role of administrative measures in cost containment and required local health administrations to exert tight regulation by setting “scientific control targets” to cost indicators in public hospitals and, in particular, average inpatient and outpatient bills.Footnote 11 The MOH emphasized that it was imperative to utilize a combination of administrative, economic and legal means.Footnote 12 It is the policymakers' frustration with the resilience of cost inflation to a variety of reform measures that has led to the decision to use “command-and-control” tools to suppress the rising trend.Footnote 13
Reform Context and Policy Design
Fujian, located on the south-east coast, is one of China's most affluent provinces. However, despite this, Fujian's medical system is relatively poor in manpower and physical capacity. Fujian's representativeness lies in the remarkable similarity of its average medical cost profiles with those of the national average, which is rarely seen in other localities with comparable levels of socio-economic development.Footnote 14
Fujian, like most Chinese localities, has experienced a continuous increase in medical spending over the past two decades, but this has gone hand-in-hand with GDP growth as well as the rise of household income. Thus, the increase could largely be absorbed by its rising levels of wealth. According to the most recent available computation, Fujian's total health expenditure galloped from 1.89 billion yuan in 1991 to 14.49 billion yuan in 2001, an increase of 6.7 times within one decade; but still, this increase had been slower than GDP growth prior to 1999.Footnote 15
However, this scenario came to an end in 2000. Between 1999 and 2001 alone, the annual increase rate of its total health expenditure jumped to 22.8 per cent, whereas GDP grew by only 9.02 per cent.Footnote 16 The average bill for inpatient stays in Fujian province began to outstrip that of the national average in 1997. A more striking fact is that it rose even higher than rural per capita net income. Incredibly, the figure jumped from 3,402.91 yuan in 2001 to 4,757.53 yuan the following year (see Figure 3). Note, this medical cost explosion happened during the years when Fujian's general economic inflation rate was at a very low level.Footnote 17 Owing to the poor insurance coverage at that time (less than 10 per cent until 2004),Footnote 18 most of the increased costs were paid out-of-pocket.
Medical Cost and Per Capita Disposal Income, 1993–2004
In 2004, the pressure of this cost explosion and widespread public discontent prompted the Fujian provincial health bureau to undertake a large-scale policy intervention to curb the “unacceptable cost inflation.” Owing to the low coverage rate of health insurance and its inability to reform the payment system claimed by the local labour authorities that manage the Basic Medical Insurance Schemes, Fujian's health administration had little choice but to work alone using the old command-and-control tools. This policy campaign started in 2005 and was greatly supported by the provincial government.
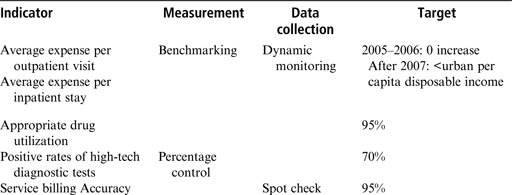
At the heart of this policy design lies indicator management. The health administration prescribes five key indicators to measure the performance of public hospitals in cost containment: average expense per outpatient visit (AEOV); average expense per inpatient stay (AEIS); appropriate drug utilization; positive rates of high-tech diagnostic tests; and the accuracy rate of service billing. To avoid local discretion and policy distortion, the Fujian provincial health bureau sets uniform targets for all medical institutions (see Table 1). AEOV and AEIS are the two touchstones subject to dynamic monitoring while the other three indicators are measured by spot checks.
Key Indicators in Fujian's Healthcare Cost Containment Policy
Source: Fujian Provincial Health Bureau 2005.
Explicit targets were set by the policymakers. The two crucial cost indicators – AEOV and AEIS – would see no increase from 2005 to 2006. “Reasonable” increase was to be allowed after 2007, but the increase rate should not go beyond people's ability-to-bear. The policymakers attached an explicit operational definition: an increase in healthcare costs would be considered as “reasonable” if its rate was lower than that of urban per capita disposable income.Footnote 19 This definition was intended to avoid misinterpretation and discretion at the local level.
With strong political support from the provincial government, the health administration substantially tightened its policy screw. Provincial health bureau and local health departments specify to each medical institution in their jurisdiction the ceilings of AEIS and AEOV. The ceilings in the initial year were calculated based on the average costs of the past three years. Breaking the ceilings would lead to a series of penalties. Hospital managers have to assume full responsibility for the work of cost control, and failing to meet the targets was said to affect their careers.Footnote 20 Among the many constraints imposed on public hospitals, the most crucial one is that hospital income earned over and above the ceilings will be confiscated by the health administration and re-allocated to other causes, including medical education, public health and rural healthcare.Footnote 21
Behind this policy design lies the belief that the medical sector has earned unreasonable profits by providing unnecessary care, for example over-prescribing drugs and the use of high-tech diagnostic tests and expensive procedures. Therefore, requiring hospitals to surrender up part of their profits to mitigate the cost of access to healthcare is not only morally imperative but also justifiable, without jeopardizing their long-term viability. In spite of the hospitals' natural reluctance, the implementation of the policy was made possible by the government's ownership of public hospitals and the traditional administrative command chain between the health administration and public hospitals.Footnote 22
The companion paper to this has analysed the actual implementation of this policy initiative and has found that, with firm political support from the provincial government, the health administration was able to mobilize policy instruments at its disposal and make coherent alignment of the instruments to maximize the policy's effect.Footnote 23 However, despite the unprecedented policy determination, this reform design suffers from three major problems that enable hospitals to react in opportunistic ways. First, while the policymakers set strict targets for average medical costs, they are not accompanied by controls over volume. Second, the administration does not possess essential information on hospitals' real profit margins and the magnitude of induced-demands, and thus the setting of cost ceilings is rather arbitrary. Third, the health administration does not regulate the mix of drug, diagnosis and treatment, which could be manipulated by hospital managers for the sake of economic interests. The consequences of these design flaws soon surfaced.
Methodology
The fieldwork for this study was conducted between May and June 2010, and supplemented with a follow-up trip to Fujian in September that year. Both quantitative and qualitative methods were employed in data collection. Semi-structured interviews were used extensively. Thirty interviews were conducted with government officials, health administrators, medical insurance administrators and hospital managers, as well as with frontline physicians from five representative hospitals in the province, Fuzhou city and Xiamen city.Footnote 24
In the companion paper, the first author of this article compared the inpatient and outpatient cost profiles of Fujian's provincial and municipal hospitals with those of the national average between 1999 and 2009, and found that the average medical spending in Fujian's public hospitals displayed marked declines following policy intervention. This finding was corroborated by comparing it with the average medical bills from two provinces with comparable levels of socio-economic development, namely Guangdong and Jiangsu. It was found that although AEOV and AEIS failed to hold the control targets from 2007 when “reasonable increase” was allowed, their increase rates were kept significantly lower than the national average, in both provincial and municipal categories, in stark contrast with the constant cost escalation of the national average and that witnessed in Fujian before the policy intervention.Footnote 25
The aim of this article is to examine the way in which public hospitals respond to the administrative mandates of cost control and the implications of that response. Our analytical approach is first to elicit hospitals' strategies from in-depth interviews and use some of them as hypotheses to test quantitatively in a larger sample of medical institutions.
The database was compiled from the (hospital) Medical Information Disclosure Systems. There are three such systems in Fujian, administered by the Fujian provincial health bureau, Fuzhou municipal health department and Xiamen municipal health department. We collected from these three sources all the monthly statistic digests available up to the time this article was completed, and merged them into one database containing 30 hospitals from Fuzhou city, Xiamen city and elsewhere in the province. Since their structures are basically the same except for a minor difference, they allow us to construct a panel database and capture the time-variant dynamics.
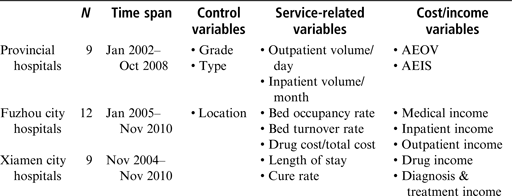
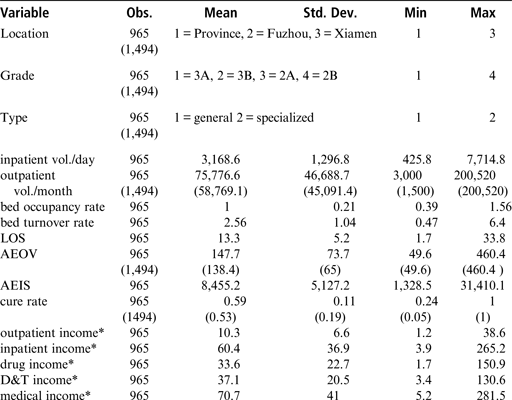
The database is comprised of three types of variables, including service-related variables, expenditure variables and three control variables. The key characteristics of the database are shown in Table 2. A description of the variables contained in the database is presented in Table 3. Hospitals are classified into four grades, i.e. 3A (san jia 三甲), 3B (san yi 三 乙), 2A (er jia 二甲) and 2B (er yi 二乙), and there are 13, eight, five and four hospitals categorized into these grades respectively. Of the 30 hospitals, 18 are general medical institutions while 12 are specialized hospitals (mental, maternal, traditional Chinese medicine, etc.). In terms of administrative status, there are nine provincial hospitals, 16 municipal hospitals, four county/district-level ones, and one People's Liberation Army hospital. Critical service indicators such as bed occupancy rate and average length of stay (LOS) are included. Bed occupancy rate is defined as the percentage of available beds occupied over a given period. Partly owing to the perverse incentive to keep patients for revenue generation, LOS in Chinese hospitals is rather high.
Characteristics and Variables of Panel Database
Source: The database was merged from the hospital medical information disclosure systems (Fujian provincial, Xiamen municipal and Fuzhou municipal); the data were collected from the Fujian provincial health bureau, Fuzhou municipal health department and Xiamen municipal health department, 2009 and 2010.
Description of Variables
Source: The author's calculation. The database was merged from the hospital medical information disclosure systems (Fujian provincial, Xiamen municipal and Fuzhou municipal); the data were collected from Fujian provincial health bureau, Fuzhou municipal health department, and Xiamen municipal health department.
Notes: *in million yuan.
This policy initiative was implemented at the same time as the New Cooperative Medical Scheme (NCMS), Urban Employee Basic Medical Insurance (UEBMI) and Urban Resident Basic Medical Insurance (URBMI) were rapidly rolling out in Fujian. Insurance coverage has expanded from less than 10 per cent in 2004 to 90 per cent in 2010. Health economics knowledge tells us that health insurance and provider payment methods (predominantly fee-for-service even today in Fujian) have a crucial impact on costs and provider behaviour. Unfortunately, hospital-level data on health insurance were unavailable to the authors as officials of the provincial labour bureau viewed this information as “sensitive” and “confidential.” This hindered us from examining the different strategies that hospitals might use for insured and uninsured patients to maximize the hospitals' interests. Therefore, this article focuses on revealing hospitals' overall behavioural responses.
Although the time span is relatively short vis-à-vis typical panel analyses, this database indeed covers almost the full course of the policy intervention since 2005, to the extent that data are available. Of course, there are still imperfections. First, because Fuzhou and Xiamen's information disclosure systems were launched in 2005 and late 2004 respectively, data from before 2005 (when the policy intervention began) were mostly unavailable, hindering a before-and-after analysis. This weakness is largely addressed in the provincial hospital data as the provincial medical information disclosure system provides information dating back to 2002. Second, the provincial system stopped releasing the monthly digest in October 2008 and therefore there is no data for after that time. Third, data on inpatient income and total medical income are missing for the Fuzhou city hospitals. This has made the database unbalanced and thus the observations used in some regression models are different from the rest.Footnote 26
Scholars of China studies are often concerned with reliability of statistical data derived from the government system. The quantitative data used in this analysis were reported for administrative purposes. Certainly, there might be concerns of measurement problems or misreporting. However, it should be noted that the health administration conducts regular inspections every year when financial reports, randomly selected billing records and medical records are scrutinized. These data sources are unlikely to have been substantively manipulated. Hence, this cross-examination strengthens the reliability of the data. Even though the data are still imperfect owing to misreporting, because we are using panel data analysis, if the data are misreported in a consistent manner, the trend of change in health expenditures can still be inferred by using a fixed effects model, as discussed below.
The regression analysis first aims to verify the overall trend of average medical costs and hospital income more accurately than was possible in the companion paper. Second, it attempts to explore the possible opportunistic practices of healthcare providers found in the qualitative investigations. Third, the regression analysis controls for location and examines the effect of the policy of decoupling drug income and hospital revenue, as is implemented in Xiamen city. The database comprises 1,494 observations of 30 hospitals from Fuzhou city, Xiamen city and elsewhere in the province, spanning between 2002 and 2010. However, owing to the unbalanced nature of the database as already explained, the sample shrinks when testing certain models (965 observations from 18 hospitals spanning from 2004 to 2008; see Table 3).
In theory, a fixed effects model is preferable in this instance when estimating the coefficients explaining the time effect of policy change. This model is supposed to show more consistent results because it can control for potentially omitted variations within a hospital. Random effects model will also be tested as a benchmark.
We estimate an equation of the form:
 $$\ln \hbox{E}_{{\rm iym}} = {\rm \alpha} + {\rm \mu} _{\rm i} + {\rm \delta}_{\rm y} + {\rm \gamma}_{\rm m} + {\rm \beta}{\rm X}_{{\rm iym}} + {\rm \varepsilon}_{{\rm iym}}$$
In Eiym represents a number of indicators of natural log of hospital expenditure for hospital i in year y and month m (e.g. total medical income for the hospital). The coefficients on the right hand side amount to elasticity of hospital expenditure after employing natural log on the left hand side; μi is the fixed effect for hospital i; δy and γm are the year and month dummies. We use July as the reference month as this month is least likely to be subject to major quarterly and yearly adjustment for accounting purposes. Xiym denotes control variables such as treatment outcome and natural log of service volume. εiym denotes the error term.
In the analysis, dummy variables were created for year and month so as to capture the longitudinal dynamics. Both inpatient and outpatient volumes (with nature log) are incorporated into all models as indicators of the workload of physicians as well as other capital inputs, in order to explain the fees charged by a hospital. As a proxy for medical outcome, cure rate is included to load the degree of illness. In other words, a higher cure rate indicates a lower average risk in hospital.
Qualitative Research Findings
Five major findings emerged from in-depth interviews. The emphasis of this article lies in the panel data analysis, and so the research findings derived from the qualitative investigation are only briefly reported here. These strategies were educed from the first author's interviews with hospital managers, department heads and physicians, and were corroborated by hospitals' official documents and internal rules.
Quota setting
The in-depth interviews found that when control targets are imposed on hospitals, it is common practice for the hospital managers to pass the targets down to each clinical department, and delegate the task of supervising physicians to department heads. Yet, typically, they allocate differential targets to departments, taking into consideration each department's earning ability, profit margin, utilization of high-tech equipment, and type of diseases cared for (ordinary surgical, chronic, cancer, rehabilitative, etc.). Breadwinner departments are usually granted bigger allowances for cost increases while others have to exercise much more rigid cost control. This was said to be a logical solution when constrained by the dual pressure of keeping costs below target and achieving bottom line objectives. This is essentially an internal cross-subsidization of quotas for cost increase. In the meantime, it is important to note that departments are still assigned with hard revenue targets.
Inter-monthly balancing
In order to maintain profits, hospital managers keep dynamic monitoring on income and average cost profiles and benchmark them with the control targets. When they detect that the costs have been reduced “too much” in relation to the targets, the quotas assigned to certain departments will be adjusted to make up the shortfalls. This manipulation is very often observed in November and December. Therefore, the average cost profiles are unevenly distributed over 12 months.
Drug – diagnosis and treatment mix
Chinese hospitals receive income from four main sources: drug income, diagnostic tests, treatment procedures and government subsidies. On average, drug income accounts for about 40 per cent of hospital income, income from diagnosis and treatment (D&T) contributes approximately 50 per cent, while government subsidies account for less than 10 per cent (see Figure 2). Hospital managers can manipulate the mix of drug and D&T incomes to achieve various objectives. The qualitative enquiries unveiled that, when pressed by hard constraints of cost reduction, hospital managers tend to resort first to cutting unnecessary high-tech tests that are a crucial source of hospital revenue. In order to obtain the cooperation of the physicians, they have to tolerate the over-prescription of drugs, from which the physicians earn commission from pharmaceutical companies.Footnote 27
Drug expenditure and revenue decoupling
Among Fujian's nine municipalities, Xiamen is the only one that instituted the so-called drug expenditure and revenue decoupling policy (yaopin shouzhi liangtiao xian 药品收支两条线), which aims at reducing the hospitals' incentives to over-prescribe drugs. Under this system, public hospitals are required to hand over all drug revenues to the municipal health department every three months; the department pools them with regular subsidies and gives a rebate to the hospitals based on a fixed formula. Most importantly, the amount of drug profits a public hospital turns in is not necessarily linked to the proportion of money returned to it. This policy considerably constrains the hospitals' incentives of increasing revenues by prescribing more drugs, and indeed, since its inception, it has significantly reduced unnecessary drug use. A revealing indicator is the drug costs' share of total medical costs, which has declined from more than 50 per cent to 30 per cent in Xiamen's public hospitals, but remains high (between 40 per cent and 50 per cent) in national and provincial average figures (see Figure 2). This article also examines the combined effect of this policy and cost containment initiatives.
Quantitative Research Findings
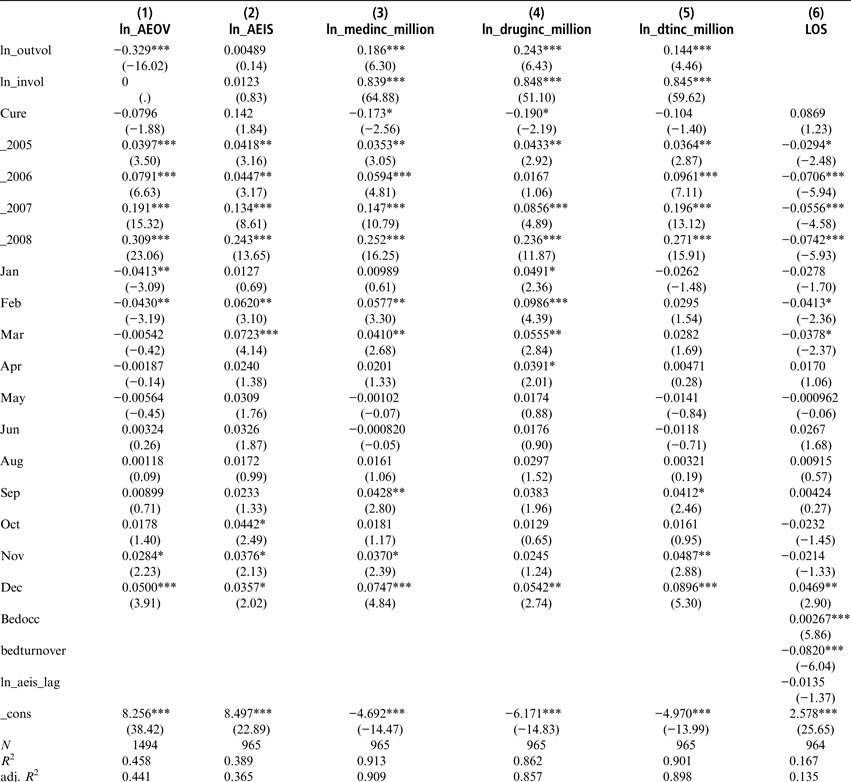
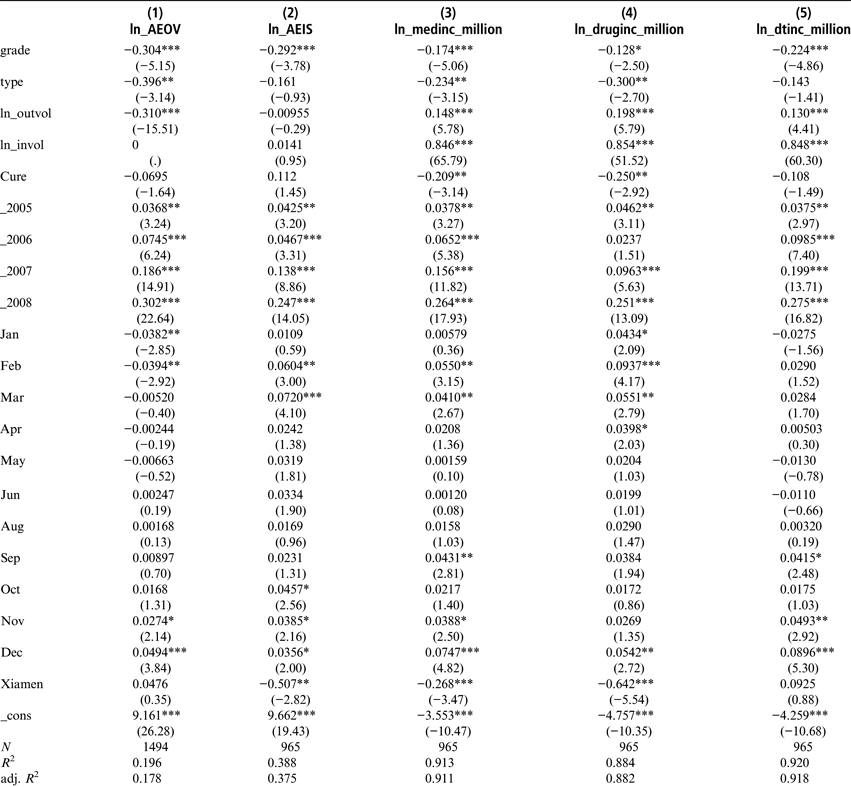
Tables 4 and 5 exhibit the regression results of using a fixed effects model and random effects model, respectively. The Hausman test shows that the fixed effects and random effects models (i.e. the results in Tables 4 and 5) are consistent.Footnote 28 From both models, the regression analysis finds that the increase rates of AEOV in the sample were about 4 per cent from 2004 to 2005 and 2005 to 2006,Footnote 29 and the increase grew at a faster rate (about 12 per cent on average) in the following years, with other control variables fixed. The policy effect has been much more visible in the inpatient sector. The annual increase rates of AEIS were 4.3 per cent and 0.3 per cent from 2004 to 2005 and 2005 to 2006. However, the growth of AEIS rebounded to about 9 per cent in the following years.
Regression Results of Using Fixed Effects Model
Source: Database merged from hospital medical information disclosure systems (Fujian, Xiamen and Fuzhou).
Note: t statistics in parentheses; *p < 0.05, **p < 0.01, ***p < 0.001.
Regression Results of Using Random Effects Model
Source: Database merged from hospital medical information disclosure systems (Fujian, Xiamen and Fuzhou).
Notes: t statistics in parentheses; *p < 0.05, **p < 0.01, ***p < 0.001.
First, this indicates that in comparison to AEOV, AEIS experienced a more significant and sustained decrease prior to 2007, mostly because inpatient care has a greater scope for making profit that could be further squeezed. AEOV, by contrast, has a lower elasticity to policy constraint. While cost reductions were indeed achieved between 2005 and 2007 (it was corroborated in the companion paper that Fujian's average medical costs led a marked decreasing trend while the national average and figures from comparable provinces were still risingFootnote 30), cost increases shoot up again soon after the pressure was relaxed.
The inter-monthly cost balancing is verified in the regression by introducing the dummy variables created for each month. As shown in both models, “December” contributes positively and significantly to AEOV, revealing that hospitals manipulate cost profiles across all months, and when hospital managers find that “we have reduced it too much” before the end of the year, they would try to “make up” by adjusting quotas given to departments. Outpatient services are much easier to adjust than inpatient care, because hospital managers would not want to risk medical quality in inpatient care that is arguably more sensitive to changes in daily outlays. This explains why the correlation between AEOV and the dummy variable for December is statistically significant whereas this pattern is unobservable for AEIS.
However, AEIS is also subject to manipulation. To explain the positive and significant correlation between AEIS and the dummy variables for “February” and “March” in both fixed and random effects models, one must understand the peculiarity of one aspect of Chinese culture which causes people generally to feel uncomfortable staying in hospital wards during the Lunar New Year season that normally falls in January or early February. In virtually all Chinese hospitals, patients and their families try very hard for discharge before the New Year, unless in a critical or severe condition. This makes bed occupancy rates drop significantly during that particular period. Late-February and March usually see large return flows of patients, and a great number of them are actually those who were discharged before the New Year. After losing profits in January until mid-February, hospitals will try every means to increase revenue and make up the deficits. One unspoken way to do this is to “run all the clinical tests again” in the guise of “being responsible for the patients.” It is not surprising that many of these tests are medically unnecessary.
The regression results suggest that hospitals' medical income (drug income + D&T income; variable name: medinc)Footnote 31 saw a moderate increase from 2004 to 2005 and from 2005 to 2006, regardless of grade, type and location. Meanwhile, however, medical income experiences showed a marked growth in March and December, largely explained by hospital managers' opportunistic strategy of avoiding “excessive” losses of income.
Yet still, the contribution of the December dummy to medical income, drug income and D&T income are consistently positive and significant. The coefficients of the December dummy in models 3, 4 and 5 in Tables 4 and 5 indicate that an average hospital's medical income in December is 7 per cent higher than that in July, the reference month in the regression. In terms of drug prescriptions, “December” contributes 5.5 per cent more than “July” and only less than the effect of the dummy variable for February. In D&T, December's effect contributes 9 per cent more than July's effect, and higher than the effect of any other month. Average length of stay (LOS) is regressed in a fixed effects model; the result shows a significant increase of LOS in December, suggesting that an important strategy used by hospital managers in inter-monthly cost balancing is to extend significantly the average LOS in the inpatient sector. In models 3, 4 and 5, it is unsurprising to find that service volumes contribute positively and significantly to all the income variables, while cure rate contributes negatively.
The regression results also suggest that, as seen in the qualitative analysis, reducing the use of high-tech tests and expensive procedures is a prevalent practice adopted by hospital managers. The elasticity of D&T income (variable name: dtinc) for both inpatient and outpatient volumes is lower than the elasticity for drug income (i.e. 0.144 < 0.243 and 0.845 < 0.848 in Table 4, and similarly in Table 5). However, model 5 illustrates that hospitals' drug income has increased rapidly since 2007. It shows that between 2006 and 2008, drug income increased by about 25 per cent (calculated from the coefficient on year 2008: 0.251 from the random effects model in Table 5), while during the same period, D&T income increased by about 19.3 per cent (calculated from the difference between coefficients on year 2006 and 2008 in the random effects model). Similar results can be calculated from fixed effects models. This supports the finding from the qualitative analysis that, when pressed by cost reduction dictates, hospital administrators have to start with sacrificing D&T income in order not to upset the physicians' hard economic interests that would otherwise be affected by a cutback in drug prescriptions which would result in a loss of their income from drug commissions.
Inter-monthly cost balancing is also very evident on the income variables, which also show the respective contributions of drug income and D&T income. For instance, both rise significantly in March and December. The magnitude of manipulation of D&T income becomes very significant between September and December. Owing to the hospital managers' relatively tight control over high-tech tests and expensive procedures during the rest of the year, when pressed to make up the revenue shortfalls and make “adjustments” to meet the hospitals' revenue targets, hospital managers would unsurprisingly relax the restrictions on prescribing high-tech tests and expensive procedures. Ultimately, they have both the revenue targets and staff bonuses to account for.
The analysis paid special attention to hospitals in Xiamen city where drug income has been decoupled from hospital revenues in order to reduce the incentives for over-prescribing. The regression analysis using the random effects model confirmed that the dummy variable for Xiamen contributes negatively and significantly to drug income and medical income (see Table 5). The latter's decrease most probably results from the decline of the former. Yet, the hypothesis that the decoupling policy encourages hospitals to increase D&T in order to make up the deficits is not supported in this model. This might suggest that the decoupling policy indeed constrains prescriptions and hospitals may have to increase service volume in order to increase revenues.
Needless to say, most of the behavioural patterns revealed in this article are undesired. A common consequence is that they introduce a systematic bias to physicians' clinical practices that distort cost profiles across departments, inpatient and outpatient divisions, months, and between drugs and D&T. Ultimately, patients' interests are put at risk by these opportunistic manipulations. Although practically they did help hospital managers keep average medical costs down in the short run, this cost-containment effect is achieved by distorting clinical practices.
In essence, these behavioural patterns are the result of the incompatibility of hospitals' internal and external incentives. As depicted in Figure 4, hospitals under administrative cost-containment policies operate in an environment of conflicting incentives. First, the health bureaucracy enforces the cost containment policy by command-and-control mechanisms, without improving the formula for government subsidies. Hospital managers are situated in a complex environment in which they have to respond to three types of incentives – government directives, revenue pressure and staff's quest for better income.Footnote 32 Any alternative balancing strategy will alter the internal incentives that managers impose on physicians.
External and Internal Incentives in Fujian's Public Hospitals since 2005
Clinical departments find that they have to abide by cost control mandates and revenue targets at the same time. Confronted with this dilemma, it is not difficult to understand their prioritization of revenue collection over cost-saving. This is primarily down to the high-powered bonus system that hospital managers use to incentivize physicians.
Physicians are trapped in a similar dilemma with even more contradictory contractual relationships. Aside from bonuses, executing cost control measures will affect drug commissions and the informal payments received from both pharmaceutical companies and patients. Although hospital managers recognize that these de facto contracts largely countervail physicians' cooperation in cost-saving, they also understand that it is difficult to eradicate such contracts in light of the prevalent culture and incentives.Footnote 33 In some places, hospital managers have tried moral persuasion and have put in place internal rules to eliminate informal payments, particularly drug commissions and bribery (hong bao 红包), but these have largely failed.Footnote 34 Informal payments are in essence a sort of special “social contract” and are more resilient than is usually understood.Footnote 35
A critical finding that has emerged from this study is the reluctance of hospital managers to take action against physicians who over-prescribe. This is not only because drug income constitutes a significant part of hospital revenues,Footnote 36 but is also explained by hospital managers' need for cooperation from physicians. Since physicians are the ones who ultimately implement health policies, their cooperation is indispensable,Footnote 37 especially when a policy directly challenges their hard income. To earn their support for any cost containment work, hospital managers must first resort to cutting back on profitable tests and procedures, which in turn leads to a loss of revenue for the hospitals.
Earning commission on every prescription for high-tech diagnostic tests (CT, MRI, etc.) used to be widespread practice in Chinese hospitals during desperate financial times. However, following public condemnation, this notorious mechanism no longer exists in major hospitals in Fujian. Although physicians are no longer forced to prescribe profitable tests and procedures, there remain two incentives for them to continue to do so. First, revenue targets still guide clinical departments and frontline physicians. Hospital targets are broken down and assigned to each department. These targets are “hard” in nature. Given the existing problematic fee schedule, high-tech equipment is still a major profit-generator. Second, since the early 1990s, bonuses have been highly effective in encouraging physicians to generate revenue.Footnote 38 As argued by Meessen and Bloom, owing to the Chinese health system's heavy reliance on this “particularistic contracting,” bonuses have become a significant and permanent component of physicians' incomes, and one that they are reluctant to give up.Footnote 39 Any reforms that affect this bonus system will face strong resistance from the frontline. Hospital revenues are the ultimate source of the bonuses and physicians will always look to increase their incomes, so it is not difficult to understand the motivation behind the prescribing of high-tech tests and expensive procedures when these generate substantial revenues for the hospitals.
In sum, the need to achieve the business bottom line and avoid deficits is in critical contradiction with the directive to surrender profits, and this is compounded by physicians soliciting more bonuses and resisting foregoing any monetary interests. Trapped within this complex situation, managers have to run hospitals using a scheme of conflicting incentives, which encourages opportunistic behaviour, as revealed in this article. The intrinsic information asymmetry in healthcare makes it imperative for any health policy intervention to be built on coherent design and clear anticipation of the possible opportunistic practices of the providers. The particular type of policy campaign examined in this article is plagued with inherent limitations that necessitate strong regulation on a wider spectrum of hospital activities, rather than solely relying on indicator management.
Concluding Remarks
This article analyses a provincial health policy intervention aimed at cost containment. Based on qualitative enquiries and quantitative analysis of a panel database, it unveils a range of opportunistic practices by providers in response to cost control directives imposed by the local health administration. Although concerted administrative efforts are to some extent able to curb the rapid cost escalation in healthcare, the Fujian case suggests that they come with various inherent limitations that leave plenty of scope for providers' opportunistic reactions. The behavioural changes uncovered in this article are undesired and severely distort the policy intention. This suggests that although using administrative tools can bring about a quick solution, if not carefully designed they may also introduce unintended consequences. Thus, combatting healthcare cost inflation with administrative actions requires a much stronger government capacity than was anticipated.