INTRODUCTION
Efforts to elucidate environmental changes in the Earth system are a cornerstone of the narrative of global change. The last 100,000 yrs are critical because of its relevance to modern change but challenging because of the few records that can be leveraged through multidisciplinary study. We rise to this challenge by describing recent efforts at Toba caldera in Sumatra, Indonesia, where the volcanic history reveals a high-resolution sedimentary record covering tens of thousands of years. Such records are rarely recovered, much less easily accessible and well preserved. We seek to leverage this record to unravel Quaternary chronostratigraphy and its application to local volcanic evolution and a regional paleo-archive age model for the last 100,000 yrs.
One of Earth's largest and youngest calderas, Toba caldera, in Sumatra, Indonesia, erupted 74 ka in one of the most catastrophic supereruptions ever, when 2800 km3 of magma was erupted and emplaced as the Youngest Toba Tuff (YTT) (Chesner, Reference Chesner2012). The associated caldera collapse formed most of the basin that was subsequently filled to form Lake Toba within ~1500 yrs after caldera formation (Chesner, Reference Chesner2012). Subsequent resurgent uplift, during which the floor of the caldera was structurally uplifted from Lake Toba, formed the island of Samosir (van Bemmelen, Reference van Bemmelen1939; Chesner and Rose, Reference Chesner and Rose1991; Chesner, Reference Chesner2012). Samosir Island is elevated ~700 m above the lake on its eastern flank, exposing caldera-filling ignimbrites and lake sediments up to ~100 m thick in some sections (Aldiss and Ghazali, Reference Aldiss and Ghazali1984). A post–74 ka history of sedimentation and uplift is recorded in these sediments, and reconnaissance data reveal that Samosir Island emerged above lake level at least ~36 ka and continued to uplift at progressively lower rates until ~8 ka (de Silva et al., Reference de Silva, Mucek, Gregg and Pratomo2015), with local uplift as recently as ~2 ka (Mucek et al., Reference Mucek, Danisik, de Silva, Schmitt, Pratomo and Coble2017). Constraining the details of the timing of resurgence is challenging, but the sedimentary record at Toba is proving to be an unprecedented archive.
A significant challenge in utilizing the sediment archive on Samosir Island is its complex sediment stratigraphy over a large area. Extensive 14C dating is expensive and not always reliable, as charcoal and macrofossils are not always available, requiring that bulk sediment be analyzed (de Silva et al., Reference de Silva, Mucek, Gregg and Pratomo2015; Mucek et al., Reference Mucek, Danisik, de Silva, Schmitt, Pratomo and Coble2017). Additionally, radiocarbon dating is ostensibly limited to the last 45–50 ka (Fairbanks et al., Reference Fairbanks, Mortlock, Chiu, Cao, Kaplan, Guilderson, Fairbanks, Bloom, Grootes and Nadeau2005). Paleomagnetism provides an alternative approach to sediment correlation across Samosir. Because sediment sections are only separated by tens of kilometers, the geomagnetic field is essentially the same across the island, providing a potential tool for time synchronization using deviations in both direction and intensity. The use of directional paleomagnetic secular variation (PSV) and relative intensity (Reilly et al., Reference Reilly, Stonera, Hatfield, Abbott, Marchetti, Larsen, Finkenbinder, Hillman, Kuehn and Heil2018; Ólafsdóttir et al., Reference Ólafsdóttir, Reilly, Bakke, Stoner, Gjerde and Bilt2019) has been widely employed for stratigraphic alignment in Holocene studies. However, the geomagnetic field is not always robustly recorded and/or preserved in all sedimentary archives or terrestrial sequences.
We report herein a study that combines paleomagnetic analysis and radiocarbon dating of organic-rich lake sediment on Samosir Island to correlate sedimentary sequences across the island. First, we report characterization of the magnetic properties of the lake sediments. This allows us to assess whether PSV stratigraphy of the lake sediment is a viable technique. An age model is then constructed by combining the paleomagnetic record with 14C age determinations. Comparison of this age model with regional reconstructions suggests the Toba lake sediment signal is accurate and of high fidelity. We then discuss the implications of the age model for our goal of understanding resurgent uplift at Toba caldera.
TOBA CALDERA AND SAMOSIR ISLAND
Located in northern Sumatra, Indonesia (Fig. 1), Toba caldera is a 30 × 100 km volcanic-tectonic depression (van Bemmelen, Reference van Bemmelen1939) produced by four eruptions beginning ~1.2 Ma (Chesner and Rose, Reference Chesner and Rose1991). Most of the current caldera depression was produced during the catastrophic eruption of the YTT (Chesner and Rose, Reference Chesner and Rose1991) at 74 ka (73.88 ± 0.64 ka and 75.0 ± 1.8 ka; Storey et al. [Reference Storey, Roberts and Saidin2012] and Mark et al. [Reference Mark, Petraglia, Smith, Morgan, Barfod, Ellis, Pearce, Pal and Korisettar2014], respectively). Based on current precipitation and evaporation rates, Chesner (Reference Chesner2012) posits that the lake could have filled within ~1500 yrs of the eruption. As van Bemmelen (Reference van Bemmelen1939) suggested, post-YTT caldera resurgence has resulted in the 60 by 20 km uplifted dome, Samosir Island (Chesner, Reference Chesner2012). The summit of Samosir Island is 1630 meters above sea level (m asl) with decreasing elevation to the west due to the westward tilt of the island (Chesner, Reference Chesner2012; de Silva et al., Reference de Silva, Mucek, Gregg and Pratomo2015). The lake is currently 906 m asl, and there is no evidence on Samosir, such as lake terraces or stranded deltas, indicating that the lake level has changed since Samosir uplifted (de Silva et al., Reference de Silva, Mucek, Gregg and Pratomo2015).
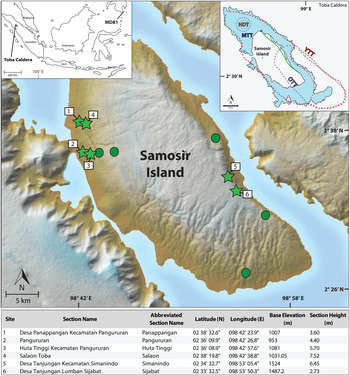
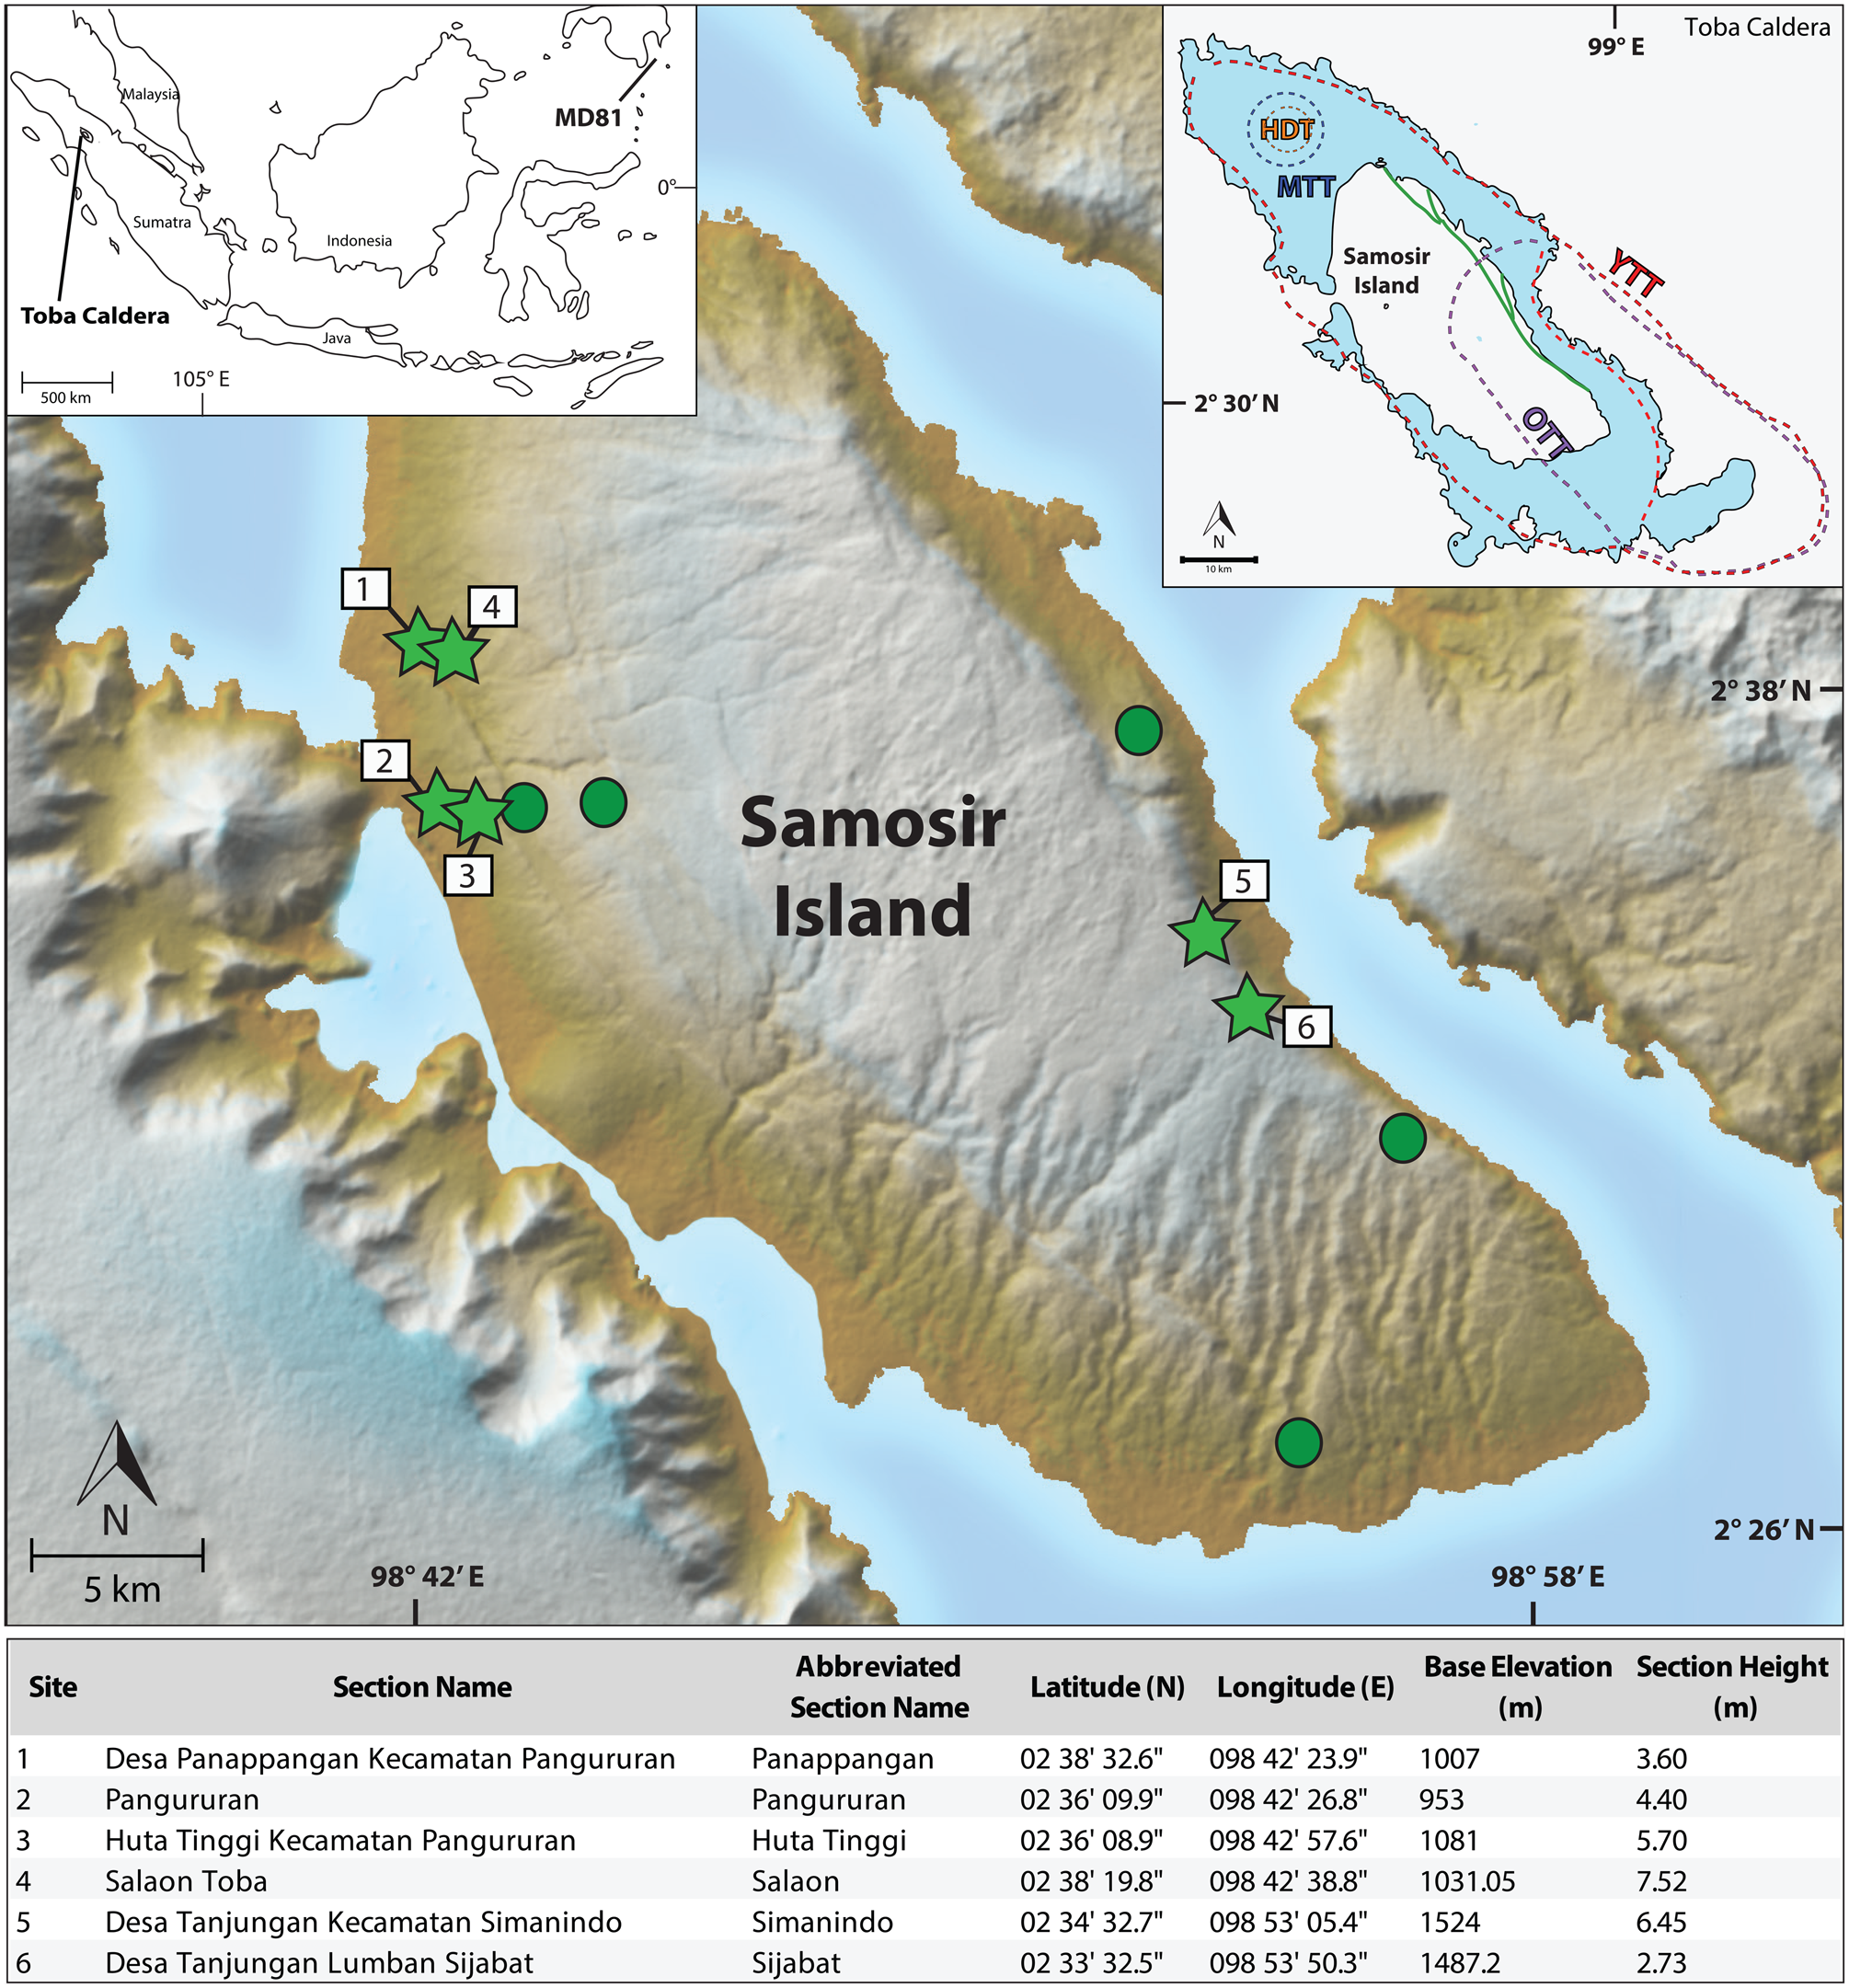
ASTER digital elevation model: 30 m map of the resurgent dome, Samosir Island, Toba caldera, Sumatra, Indonesia. Green circles represent the 11 sampled stratigraphic sections, green stars represent the six key sections. Inset map on the left shows the location of Toba caldera and core MD98-2181 (MD81). Inset map on the right shows the past eruptions of Toba caldera, with the Oldest Toba Tuff (OTT), Middle Toba Tuff (MTT) and Youngest Toba Tuff (YTT) (adapted from Chesner, Reference Chesner2012). The table below contains details pertaining to the six key sections. (For interpretation of the references to color in this figure legend, the reader is referred to the web version of this article.)
Of its 1630 m elevation, only ~700 m of Samosir Island is above lake level. The 100-m-thick lake sediments covering the top of Samosir Island demonstrate that a significant post–74 ka subaqueous sedimentary history has been deposited. Based on the 14C ages of lake sediments, an average rate of uplift of ~1.8 cm/yr is calculated (Chesner, Reference Chesner2012; de Silva et al., Reference de Silva, Mucek, Gregg and Pratomo2015). However, the uplift rate was not constant through time. Minimum uplift rates were higher at ~4.9 cm/yr from ~33.7 to 22.5 ka but slowed to <1 cm/yr after 22.5 ka (de Silva et al., Reference de Silva, Mucek, Gregg and Pratomo2015). Mucek et al. (Reference Mucek, Danisik, de Silva, Schmitt, Pratomo and Coble2017) report that the Tuk Tuk peninsula records uplift as recently as 2000 yrs ago. The motivating force for uplift appears to have been magmatic pressure as hydrostatic, magmastatic, and isostatic equilibria were established after the climactic eruption, and the driving force appears to have been the result of recharge from a single pulse of remnant magma (de Silva et al., Reference de Silva, Mucek, Gregg and Pratomo2015). Geochronological and stratigraphic relations indicate that post-caldera volcanism within the caldera accompanied uplift until at least 15,000 yrs after the eruption (Mucek et al., Reference Mucek, Danisik, de Silva, Schmitt, Pratomo and Coble2017).
The sedimentary sequences we studied were much thinner than the 100 m maximum indicated by Aldiss and Ghazzali (Reference Aldiss and Ghazali1984), mainly due to accessibility. There are three main types of lake sediment found: (1) laminates of sand, silt, and clay with diatomaceous layers, more common to the north and south; (2) dark, finely laminated, clay-dominated beds, common in the center and the east; and (3) debris flow sequences and coarse conglomerates, found in the central part of Samosir. Wood and charcoal were found in several locations and horizons. The lake sediments have average dips 5°–8° degrees SW, which suggests deposition occurred before uplift (van Bemmelen, Reference van Bemmelen1939; Chesner, Reference Chesner2012). Minimum sedimentation rates calculated from two locations (by dividing the difference in sample elevations by the difference in the sample ages) range between 0.08 to 0.2 cm/yr (de Silva et al., Reference de Silva, Mucek, Gregg and Pratomo2015).
APPROACH AND METHODOLOGY
Samosir Island is a complex system with multiple faults deforming the landscape, as well as intense vegetation and rainfall causing high erosional rates on the dome (Chesner, Reference Chesner2012). To leverage the sedimentary archive and gain further insight into the volcanic history of Toba, a robust chronostratigraphy is crucial. This motivated us to investigate the use of paleomagnetism in combination with radiocarbon (14C) age determinations to correlate lake sediment sections across the island to constrain the age-elevation history.
From various elevations and heights at six stratigraphic sections across Samosir Island, 15 bulk sediment samples were collected for radiocarbon dating, and 173 discrete 8 cm3 plastic, nonmagnetic cubes were collected for paleomagnetic analysis (Fig. 1). Stratigraphic sections were chosen by their location and accessibility (roadcut outcrops). Previously sampled sections (de Silva et al., Reference de Silva, Mucek, Gregg and Pratomo2015) were resampled, as those sediments had already proven suitable for dating and yielded good magnetic properties. We also targeted new sampling areas across the island that included a variety of lake sediment lithologies to acquire new ages and to further test which areas and materials are best suited for paleomagnetic study.
Previous work (Chesner, Reference Chesner2012; de Silva et al., Reference de Silva, Mucek, Gregg and Pratomo2015) has shown that the upper lake sediment is within the radiocarbon age range, with the potential to provide age constraints in this study. Bulk sediment from carbon-rich intervals was collected for radiocarbon dating using sterile tools and bags. Care was taken when sampling to avoid contamination from modern carbon such as young root systems. Fifteen carbon-rich bulk sediment samples were sent to Beta Analytic Inc. for dating. Samples underwent physical and chemical pretreatments that included removal of all potential contaminants by forceps, while one charcoal sample had potential contaminants scraped off using surgical scalpels.
Radiocarbon dating
All organic sediment samples were pretreated with acid washes of hydrogen chloride (HCl) at 70°C to remove possible carbonates. The one charcoal piece was pretreated by an acid/alkali/acid wash, in which it was dispensed into deionized water and then washed with HCl at 70°C, followed by an alkali wash of NaOH, then the sample was acid washed again with HCl. Next, samples were converted into solid graphite and analyzed by accelerator mass spectrometry to determine the 14C ages. The resulting ages are reported herein by their 2-sigma calibration (95.4% probability) calendar age ranges (cal yr BP), calibrated with BetaCal3.21 using the IntCal13 atmospheric calibration curve (Talma and Vogel, Reference Talma and Vogel1993; Ramsey, Reference Ramsey2009; Reimer et al., Reference Reimer, Bard, Bayliss, Beck, Blackwell, Ramsey and Buck2013).
Paleomagnetic analysis
Sediment sections were scraped to form a smooth vertical face. Most paleomagnetic cubes could be pushed by hand, but some required gentle tapping. Discrete samples were removed from the lake sediment with pliers, taking care to minimize rotation, and stored in plastic bags away from any metal or magnetic material.
The discrete samples were analyzed at the Oregon State University Paleo-and-Environmental Magnetism Laboratory. Each discrete cube was weighed (kg), then magnetic susceptibility (MS) was measured three times using a Bartington MS2B well sensor with an MS3 meter at a frequency of 0.465 kHz and mass normalized (χ [m3/kg]). Natural and laboratory remanent magnetizations were studied using 2G-Enterprises liquid helium–free 755-165UC superconducting rock magnetometer with inline alternating field (AF) demagnetization coils and direct-current (DC) field capabilities to impart an anhysteretic remanent magnetization (ARM). Isothermal remanent magnetizations (IRM) were acquired using DC fields imposed by an ASC Model IM10-30 Impulse Magnetizer. A single tray on the magnetometer could measure eight discrete samples spaced 20 cm apart. Measurements were made using a modified u-channel protocol that measured at 5 cm intervals with a leader and trailer of 10 cm to monitor for flux jumps and drift.
The natural remanent magnetization (NRM) was studied using AF demagnetization. NRM was measured before and after demagnetization at peak AF from 10 to 45 mT in 2.5 mT increments, 50 to 65 in 5 mT increments, and 70 to 100 mT at 10 mT increments (23 measurements in total). Following AF demagnetization of the NRM, an ARM was applied in a peak AF of 100 mT with 0.05 mT DC biasing field and demagnetized to study the remanent magnetization with respect to a known field. ARM was measured before and after AF demagnetization from 10 to 15 mT in a 5 mT increment, 20 to 30 mT in 2.5 increments, 35 to 50 mT in 5 mT increments, and 60 to 80 mT in a 20 mT increment (14 measurements). After AF demagnetization of the NRM and ARM, an IRM was applied using DC fields of 40, 100, 300, and 1000 mT. IRMs of 40, 100, and 300 mT were demagnetized at peak AFs of 10 and 15 mT, from 20 to 30 mT at 2.5 mT increments, 35 to 50 mT at 5 mT increments, and 60 and 80 mT. One sample at 957.05 m asl at Pangururan could be measured at an IRM of 40, 100, 300, and 1000 mT magnetizations. IRMs on nine samples from Pangururan at elevations between 953 and 956.6 m asl and nine samples from Huta Tinggi at elevations between 1086.4 and 2084 m asl did not yield IRM results because their magnetic intensities are too strong for the DC SQUID sensors even after slowing the tray speed.
All raw data from the magnetometer computing system were monitored and corrected for flux jumps and drift using the UPMAG MATLAB toolset (Xuan and Channell, Reference Xuan and Channell2009). Because the discrete samples were run using a u-channel measurement protocol, the raw x, y, and z output were volume normalized in 2-G Enterprises Long Core Software based on their respective response functions. Accordingly, we renormalized the x, y, and z intensities by the cube volume (8 cm3) and recalculated total intensity, inclination, and declination. AF demagnetization behavior was investigated using PuffinPlot (Lurcock and Wilson, Reference Lurcock and Wilson2012), and the characteristic remanent magnetization (ChRM) was isolated using a principal component analysis (PCA) without anchoring to the origin (Kirschvink, Reference Kirschvink1980). To quantify uncertainty in measurement precision, 95% confidence intervals were estimated from the maximum angular deviation (MAD) values using the conversion of Khokhlov and Hulot (Reference Khokhlov and Hulot2016), which considers the number of steps used and whether or not the ChRM was anchored to the origin. Huta Tinggi's ChRM inclination was tilt corrected 10° to correct for the visible dip measured at that section. ChRM declination was corrected for the azimuthal orientation of the section and transformed into a −180° to 180° scale by subtracting 360° from values greater than 180°. Simanindo's declination values were offset from north due to possible rotation during uplift and were therefore rotated by 145° to achieve a mean of 0 for graphing purposes. Declination values should be considered as relative changes with estimated uncertainty of about 10°, as only the sediment section's azimuthal orientation was accounted for instead of each individual discrete cube.
The susceptibility of ARM (χARM [m3/kg]) is calculated by dividing by the applied biasing field (39.8 A/m), then multiplying the cube's volume and dividing by the sediment mass (kg). χARM is sensitive to the concentration of small (<1 μm) magnetic and ferrimagnetic materials (King et al., Reference King, Banerjee and Marvin1983). The χARM/χ (χ is the mass-normalized MS) ratio is sensitive to the magnetite grain size of a sample, with lower values indicative of coarser mean magnetic grain size and higher values reflecting finer mean magnetic grain sizes (King et al., Reference King, Banerjee and Marvin1983; Stoner and St-Onge, Reference Stoner, St-Onge, Hillaire-Marcel and De Vernal2007). χARM/χ is only well calibrated for lake sediment dominated by ferrimagnetic minerals (e.g., [titano]magnetite) (King et al., Reference King, Banerjee and Marvin1983). Because of instrumentation differences compared with those used in the original calibration, we only use this is as a relative proxy. S-ratios can provide insight into the magnetic mineralogy, where values close to 1 indicate assemblages dominated by lower coercivity (easily demagnetized) ferrimagnetic minerals (e.g., [titano]magnetite) and lower values indicate an increased concentration of high coercivity (resistant to demagnetization) minerals (e.g., hematite) (Stober and Thompson, Reference Stober and Thompson1979). Pseudo–S-ratios are somewhat easier to measure, as they provide similar information but do not require a backfield (Stoner and St-Onge, Reference Stoner, St-Onge, Hillaire-Marcel and De Vernal2007) and are calculated by dividing the IRM300mT by IRM1000mT measurements. To further understand changes in the remanence carriers, the demagnetization ratios NRM30mT/NRM0mT, ARM30mT/ARM0mT are used to monitor coercivity differences.
RESULTS
Sediment observations and analysis
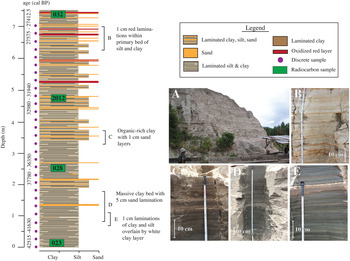
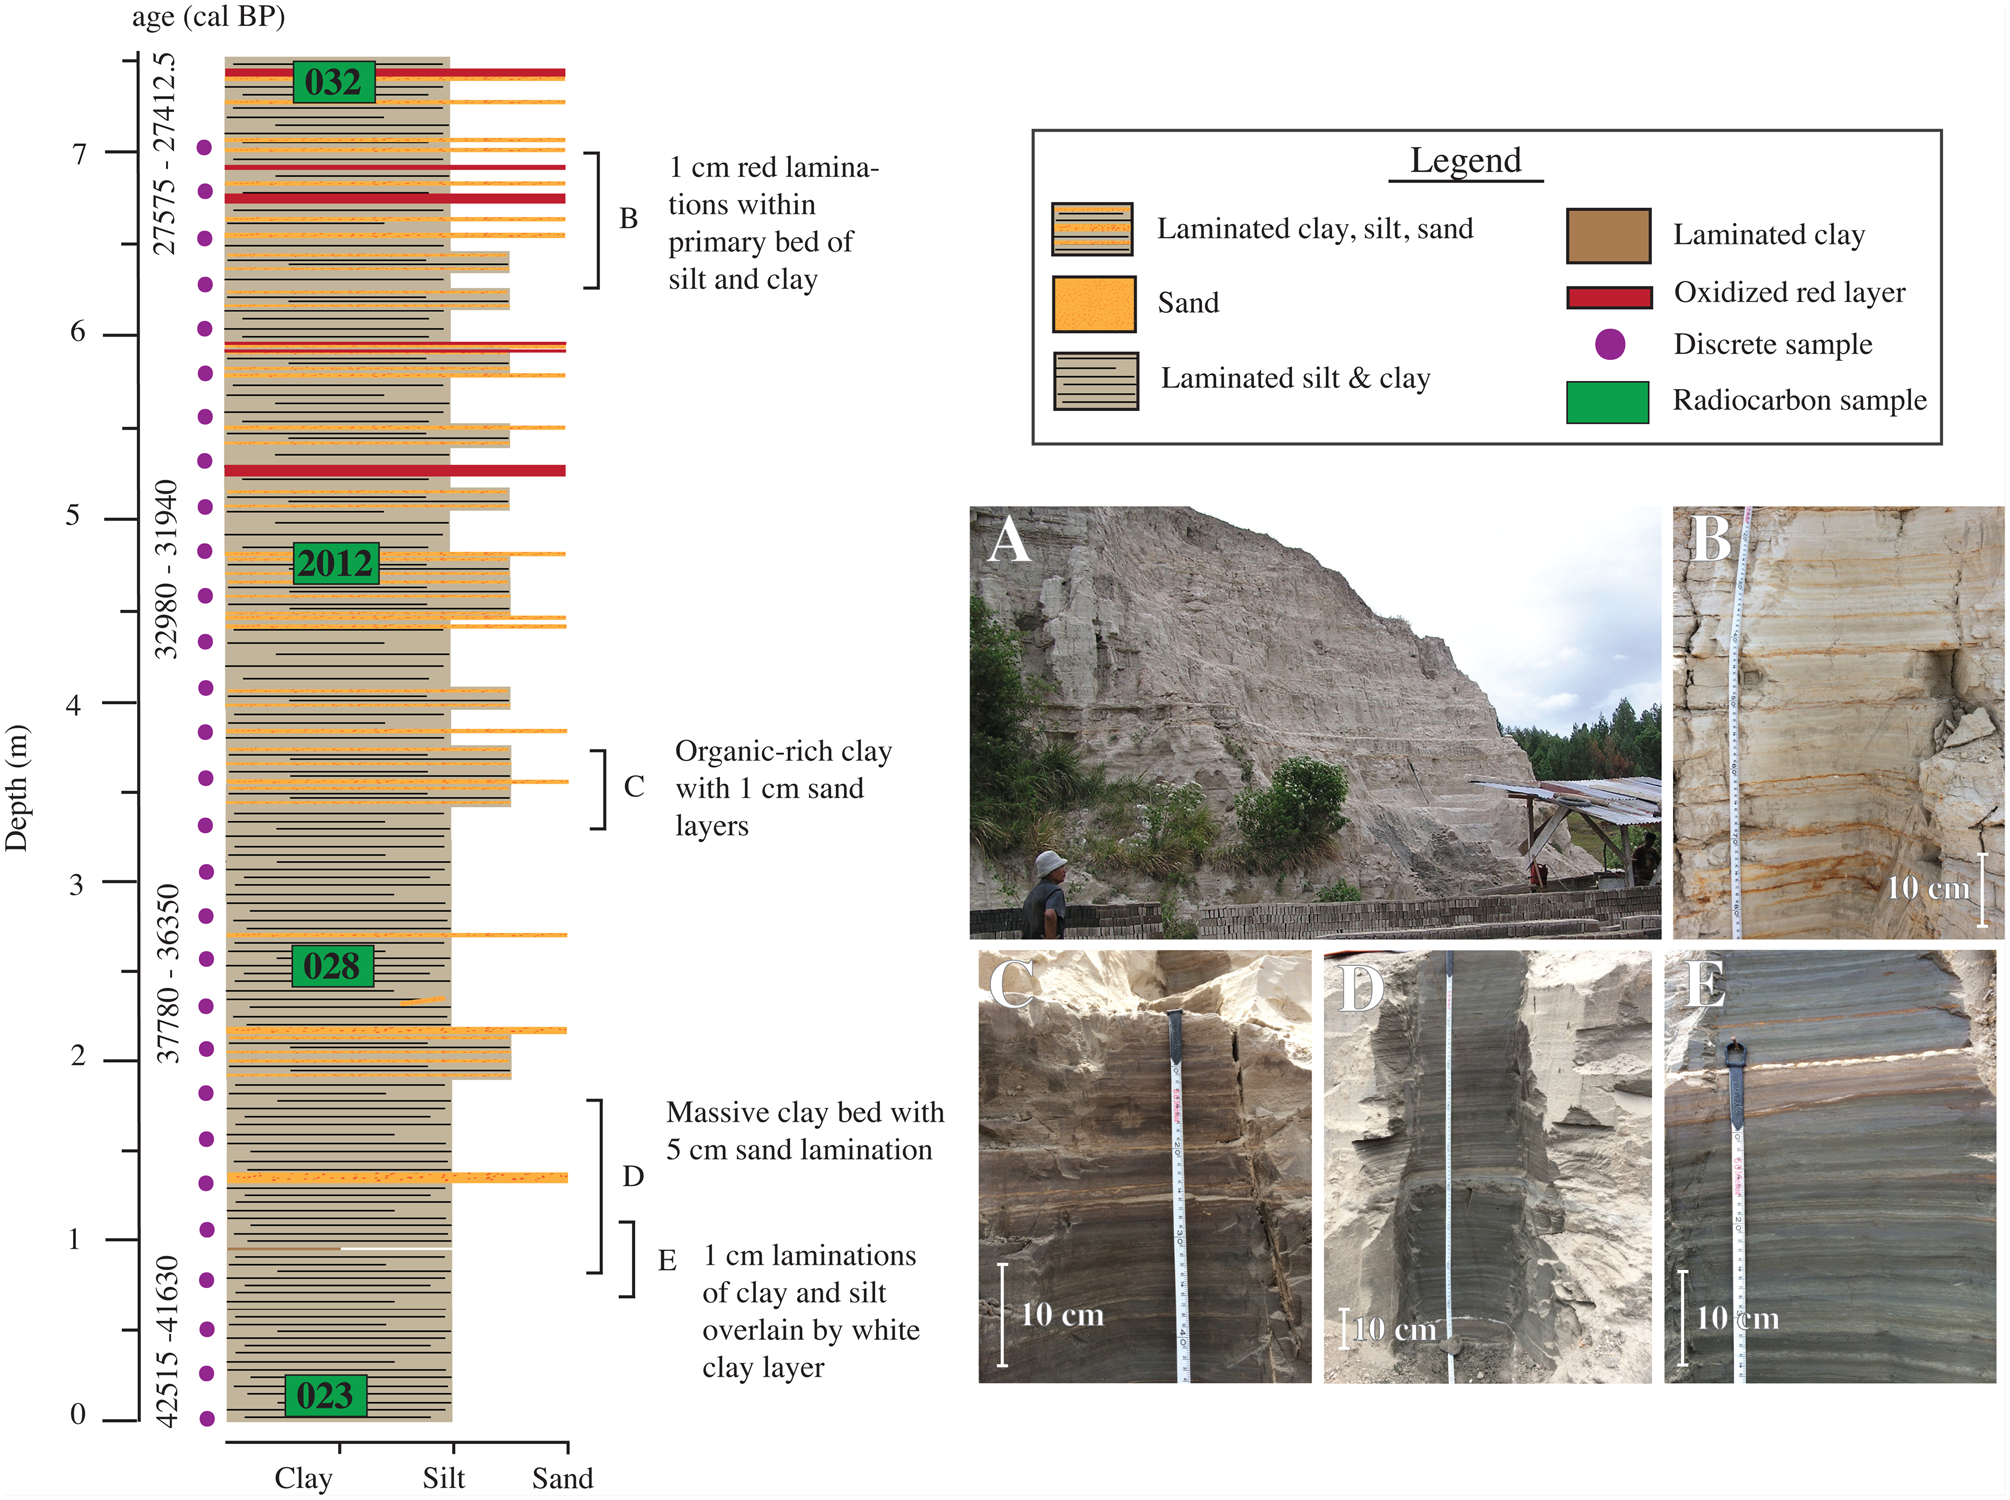
The six key stratigraphic sections are dominated by gray clay and silt, with laminations of coarse-grained sand (Figs. 1 and 2). Diatomaceous sediment dominates at one section to the west (Huta Tinggi). Silt and sand laminations are commonly found on the west side of Samosir, while large clay beds are more common to the east. All sections display laminar bedding with rare disturbances of cross bedding or microfaults.
(color online) Salaon lake sediment stratigraphy log based on field observations. (A) Outcrop photo of Salaon, used by locals for brick making. (B–E) Massive gray clay beds with thin laminations of silt.
The dated samples yield calibrated 14C ages that range from 3560, 3625, and 3690 to >46,600 cal yr BP (Table 1). The Simanindo section yields the youngest ages at 3560, 3625, 3690 cal yr BP, but these are considered inaccurate due to contamination of new carbon from roots causing younger radiocarbon ages. We attempted to date three bulk sediment samples from the Huta Tinggi section, but the samples were either too low in carbon (<0.05%) or revealed evidence of age inversions (Table 1). We therefore disregard the young radiocarbon age at Simanindo and the radiocarbon ages at Huta Tinggi as faithful recordings of the age of deposition. If we disregard those data, the other dates imply that the sediment spans from 18,220, 18,335, and 18,450 to >46,600 cal yr BP. If these are valid, then the minimum uplift rates can be calculated by dividing the elevation of the sample minus the elevation of the lake (~900 m) by the age of the sample. The water depth at which deposition occurred is unknown, but assuming the age of the youngest lake sediment deposited represents the last time the section was underwater (a minimum age limiting assumption), then the lake level of 900 m is the baseline for minimum uplift calculations (e.g., de Silva et al., Reference de Silva, Mucek, Gregg and Pratomo2015).
All measured radiocarbon sample locations and results from the six sediment sections.a
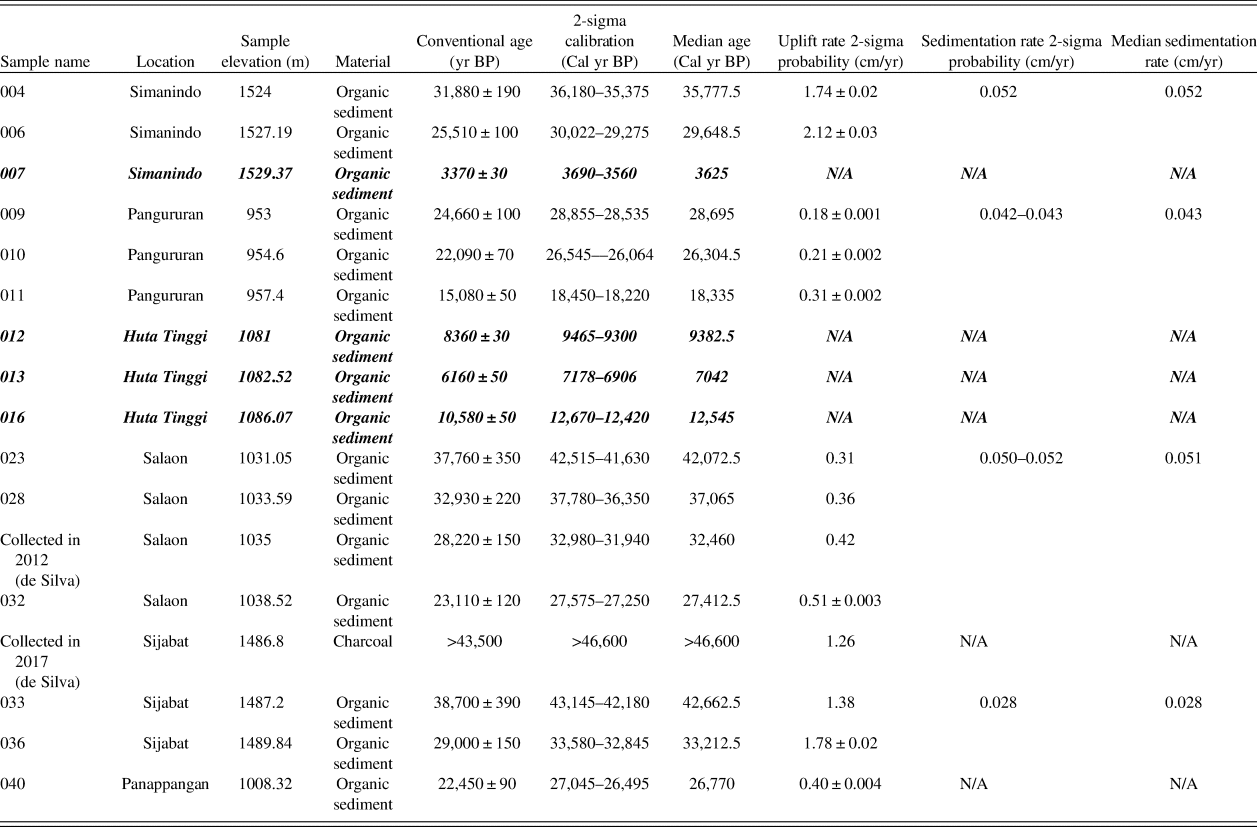
a The bold and italic entries indicate samples deemed unreliable due to possible modern contamination. Ages are calibrated by BetaCal3.21 using the IntCal13 atmospheric calibration curve. Samples marked as “Collected in 2012 and 2017 (de Silva)” are samples collected outside of this study and are reported in de Silva et al. (Reference de Silva, Mucek, Gregg and Pratomo2015). The bold, italic entries are dates that were considered suspect and removed from the final age model.
Sedimentation rates are calculated by dividing the difference between 14C sample elevations and their sample ages, which yields minimum sedimentation rates. The sedimentation rates do not seem to follow any pattern across the island and range from 0.028 to 0.069 cm/yr, with an average median sedimentation rate for all sections of 0.043 cm/yr. This result is slightly lower than the de Silva et al. (Reference de Silva, Mucek, Gregg and Pratomo2015) sedimentation rate range of 0.08–0.2 cm/yr. The de Silva et al. (Reference de Silva, Mucek, Gregg and Pratomo2015) range of 0.08–0.2 cm/yr and our average sedimentation rate of ~0.04 cm/yr are consistent with other lakes located in volcanic–tectonic regions, such as Lake Baikal in Siberia and Lake Chapala in western Mexico which had sedimentation rates between ~0.01–0.3 cm/yr (Fernex et al., Reference Fernex, Zarate-del Valle, Ramırez-Sanchez, Michaud, Parron, Dalmasso, Barci-Funel and Guzman-Arroyo2001; Colman et al., Reference Colman, Karabanov and Nelson2003).
Magnetic properties
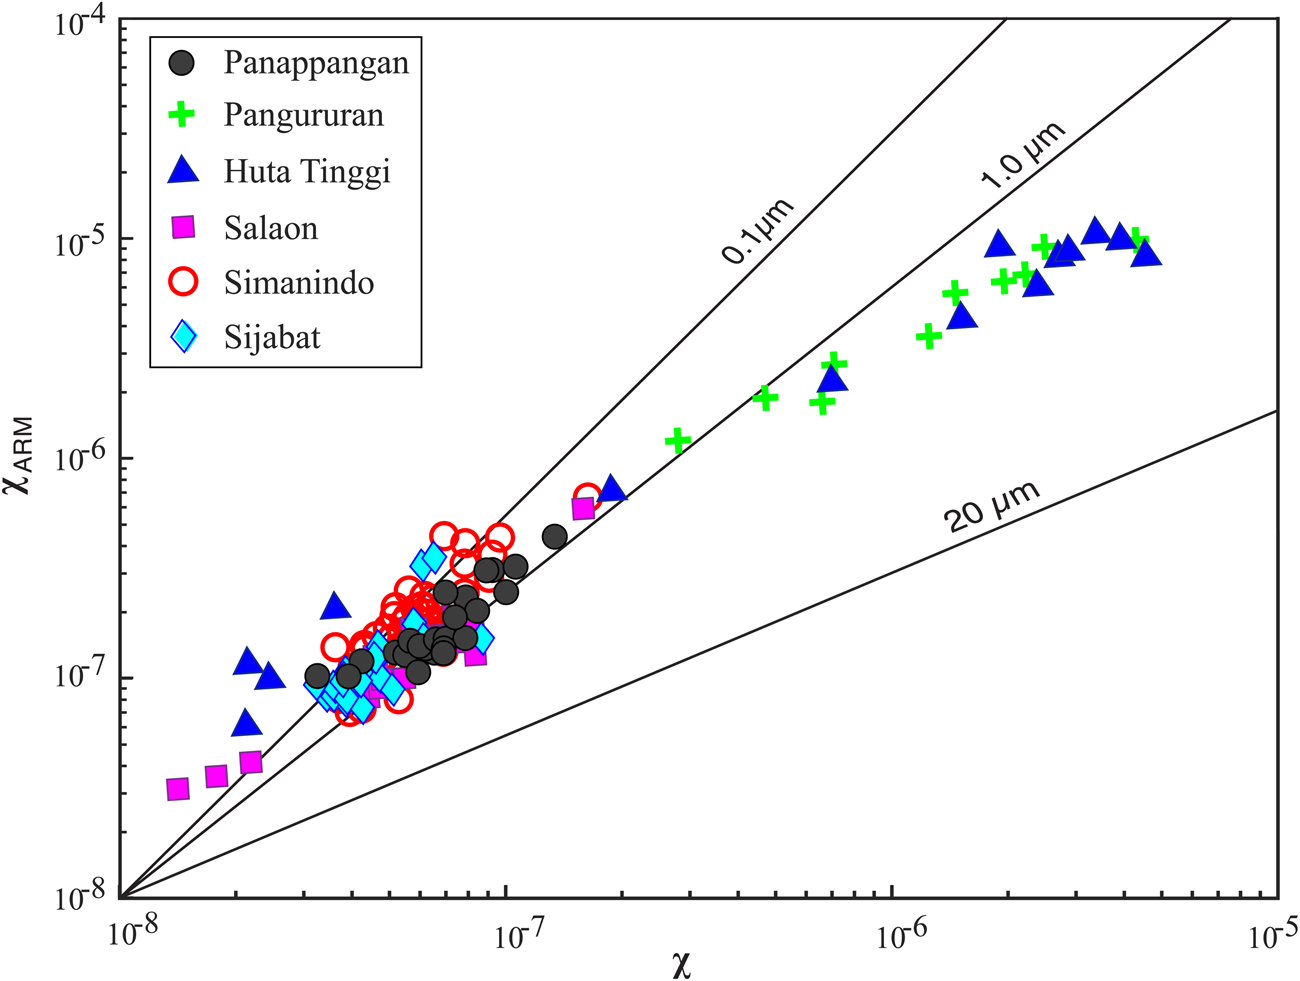
MS is a first-order approximation of the magnetic concentration in a given lake sediment sample (Hatfield and Stoner, Reference Hatfield, Stoner and Elias2013). The mass-normalized MS or χ varies from 1.38 × 10⁻⁸ at its lowest at Salaon to 4.48 × 10⁻⁶ m3/kg at Huta Tinggi. NRM intensities after 20 mT AF demagnetization (NRM20mT) average 4.74 × 10⁻³ ± 1.40 × 10⁻³ A/m, while mean ARM20mT intensities are stronger, averaging 4.49 × 10⁻² ± 1.10 × 10⁻¹ A/m. The magnetic characteristics of the lake sediments measured in different sections across Samosir Island are relatively consistent, although Pangururan and Huta Tinggi are magnetically stronger than the rest. Although there is some variability, mean S-ratios of 0.93 ± 0.02 for all sections (Table 2) indicate that ferrimagnetic minerals (e.g., [titano]magnetite or maghemite) are the main carriers of the remanent magnetization (Stober and Thompson, Reference Stober and Thompson1979). Assuming a magnetite-dominated magnetic mineralogy, supported by S-ratios >0.9 (Stoner and St-Onge, Reference Stoner, St-Onge, Hillaire-Marcel and De Vernal2007), then the King et al. (Reference King, Banerjee and Marvin1983) relationship between χ and ARM can be used to estimate the grain size of the magnetite present in a sample. The χARM/χ ratio of the lake sediment varies, ranging from 2.81 to 4.42, with a mean of 3.68, consistent with fine pseudo–single domain (PSD) grain sizes ranging from ~0.02 to 1.0 μm (Fig. 3).
(color online) χARM (the magnetic susceptibility of the anhysteretic remanent magnetization [ARM]) plotted against χ (mass-normalized magnetic susceptibility [MS]) of the six key sites with grain size interpreted following King et al. (1982). Grain sizes are typically smaller, although Pangururan and Huta Tinggi seem to have either a different magnetic source or different physical particle size distribution than the other sections, as they have a larger magnetic grain size.
Average and standard deviation of the rock magnetic data of each sediment section.a
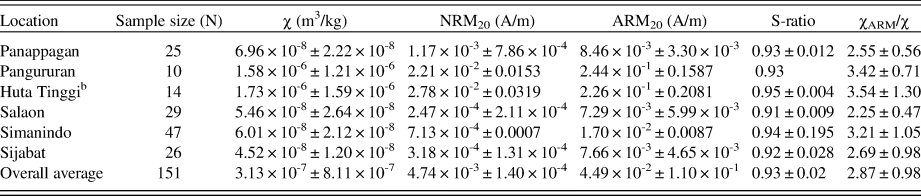
a Abbreviations: ARM, anhysteretic remanent magnetization; NRM, natural remanent magnetization.
b Diamagnetic material measured at Huta Tinggi has been removed.
Natural remanent magnetization
The relative stability of the NRM to AF demagnetization is illustrated by the NRM30/NRM0 ratio with a mean value 0.34, indicating that the magnetization is easily removed, as on average, 67% of the remanence is demagnetized by 30 mT (Stoner and St-Onge, Reference Stoner, St-Onge, Hillaire-Marcel and De Vernal2007). AF demagnetization of the NRM can be investigated using an orthogonal projection or Zijderveld plot that allows the demagnetization components to be examined in detail (Zijderveld, Reference Zijderveld1967). Based on examination of the orthogonal projections of all samples in all sections, a consistent ChRM can be clearly defined between AF demagnetization steps from 10 to 40 mT, after the viscous component is removed by AF of 10 mT and before the sample intensities approach the sensitivity of the magnetometer (Fig. 4). MAD values provide a statistical assessment of the component magnetization defining the ChRM (Kirschvink, Reference Kirschvink1980). MAD values <15° are generally considered reliable, meaning the quality of the remanence vectors can be defined (McElhinny and McFabben, Reference McElhinny and McFabben1999). MAD values average 9.2° ± 5.4° for all sections, suggesting that ChRM is generally reliable, although MAD values are higher in the Salaon section, averaging 16° (Table 3). MAD values can be used to provide information on directional uncertainty through transformation to a 95% confidence interval (Khokhlov and Hulot, Reference Khokhlov and Hulot2016) and circular standard deviation. The average inclination of ChRM determined from PCA analyses of the AF demagnetization data from all discrete samples is −5.6° ± 12.6°, although significant variability within and between sections is observed. This inclination is significantly shallower than the 4° predicted by a geocentric axial dipole (GAD) at the site locations. However, previous observations suggest a negative inclination anomaly of −5° to −9° as a persistent feature of the Quaternary field in this region (Yamazaki et al., Reference Yamazaki, Kanamatsu, Mizuno, Hokanishi and Gaffar2008; Yamazaki and Oda, Reference Yamazaki, Oda, Channell, Kent, Lowrie and Meert2013). Our observed −5.6° inclination is therefore consistent with this, although our observations cover a much shorter time interval, ~40,000 yrs rather than 400,000 yrs (Yamazaki et al. Reference Yamazaki, Kanamatsu, Mizuno, Hokanishi and Gaffar2008). Declination initially corrected for bedding strike and dip, and sampling orientation was rotated to a mean of 0 by adding or subtracting 360°. On average, oriented declination for all sections has a mean of 4.2° ± 35.6°. Five outliers in declination were removed at Simanindo (depths of 2.6, 3.5, and 3.7 m) and Huta Tinggi (depths of 0.3 and 2.1 m) for stratigraphic purposes. Huta Tinggi's outliers were diatomaceous sediment with low NRM intensity and high MAD values and do not resolve a reliable ChRM. The three outliers at Simanindo not only are different in their declination but also have anomalously higher NRM intensity than the rest of the samples in that section. While there was nothing visually different about the sediments, the remanence efficiency (NRM/ARM) of these three samples are much higher on average (0.54) than the rest of the section (0.14), suggesting that their NRM may have been acquired via a different mechanism and/or at a different time than the majority of the Simanindo samples. Further work is needed to fully characterize the remanence carriers in these anomalous samples.
Zijderveld plots of discrete cubes from all six sections illustrating alternating field (AF) demagnetization behavior and specimen characteristic remanent magnetization (ChRM). Vertical (red) and horizontal (blue) projections are generally straight following removal of a viscous remanent magnetization and trend toward the origin, yielding maximum angular deviation (MAD) values <10° and suggesting a single remanence component. (For interpretation of the references to color in this figure legend, the reader is referred to the web version of this article.)

Average demagnetization and directional quality of each sediment section. Simanindo's declination is rotated by 145° due to possible rotation during uplift to achieve a mean of 0.a
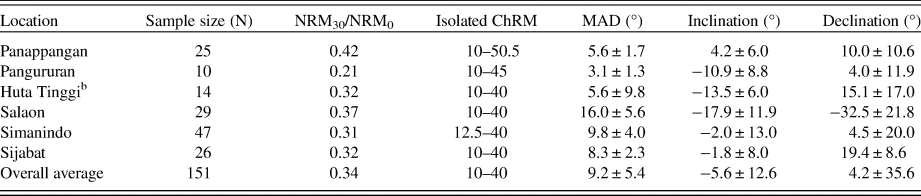
a Abbreviations: ChRM, characteristic remanent magnetization; MAD, maximum angular deviation; NRM, natural remanent magnetization.
b Diamagnetic material measured at Huta Tinggi has been removed.
Assessing sediment magnetism
Each section displays distinct magnetic properties that contribute to the quality of NRM. Pangururan and Huta Tinggi are quite similar in their magnetic properties when compared with the other sections. Their high χ (avg. 1.58 × 10⁻⁶ and 1.73 × 10⁻⁶ A/m) NRM and (avg. 2.21 × 10⁻² and 2.78 × 10⁻² A/m) ARM values (2.44 × 10⁻¹ and 2.26 × 10⁻¹ A/m) are associated with lower MAD values (3.13° and 5.59°) relative to the other sites, suggesting that higher concentrations of magnetic minerals are beneficial for determining well-defined ChRMs. Their respective average S-ratios (0.93 and 0.95) and χARM/χ (3.42 and 3.52) suggest that PSD ferrimagnetic materials are the dominant contributors to remanence in these sections, which further supports the ChRM is faithfully recorded at these two sites (Stober and Thompson, Reference Stober and Thompson1979; King et al., Reference King, Banerjee and Marvin1983).
The other sections, such as Simanindo, Sijabat, and Panappangan, have less well-defined ChRMs, while Salaon has the worst-defined ChRMs, with MAD values averaging 16.01° ± 5.62°. These poorly defined ChRMs are associated with lower NRM and ARM intensities (avg. 2.47 × 10⁻⁴ and 7.29 × 10⁻³ A/m) relative to the other sites. Salaon sediments also have the lowest S-ratio (0.91 ± 0.009). Salaon's lower concentrations of magnetite likely enable high-coercivity magnetic minerals such as hematite to have a more substantial remanence contribution, and as a result, there is greater difficulty resolving a ChRM through AF demagnetization.
Sediment across Samosir Island can be split into three groups based on magnetic properties. Pangururan and Huta Tinggi have a relatively high concentration of ferrimagnetic minerals, as indicated by high MS, NRM, and ARM values that are PSD sized and display a well-defined ChRM. Simanindo, Sijabat, and Panappangan preserve a moderately well-defined ChRM and have lower intensities and χarm/χ values. Salaon has low MS, NRM, ARM, S-ratio, and χARM/χ data, suggesting less ferrimagnetic contributions and higher coercivity components (e.g., hematite) are more important, resulting in poorly defined ChRM.
Although NRM intensities are relatively low, ~10−3 A/m on average, AF demagnetization behavior of the NRM suggests a primary magnetization is recorded, likely by a fine-grained ferrimagnetic material such as magnetite. ChRM is reasonably well defined with MAD values <10° in all but the Salaon section, with stronger samples having better defined magnetizations. Data from all six sites have negative inclinations, with values averaging −5.6°, much shallower than the GAD prediction of 4° for the location of Samosir Island; but these data are consistent with observations of a persistent negative inclination anomaly in this region (Yamazaki and Oda, Reference Yamazaki, Oda, Channell, Kent, Lowrie and Meert2013). Similar patterns between sections suggest preservation of a reliable record suitable for magnetostratigraphy.
Creating a stratigraphic record
Constructing an age model
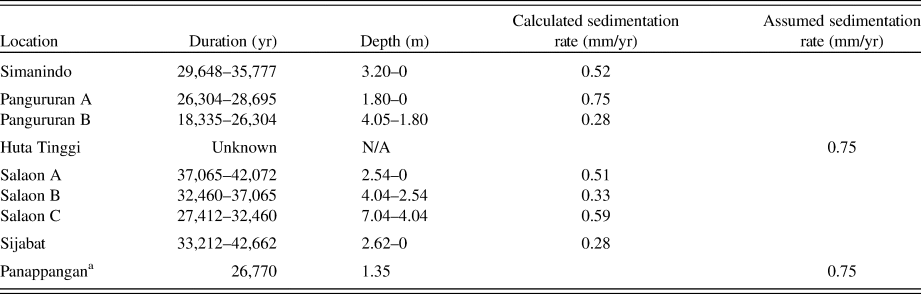
To facilitate comparison of the paleomagnetic records between sites, we derived a pseudo-sedimentation rate (mm/yr) using the median probability of the radiocarbon ages available for each site (Table 4). Extrapolation of the sedimentation rates then allowed us to create an age scale for each section. Because there are no accurate radiocarbon ages for Huta Tinggi and only one at Panappangan, sedimentation rates could not be determined and were therefore assumed using the calculated rates from other sections close in age for our initial framework (Table 4). The age models based upon these sedimentation rate assumptions were used to create a paleomagnetic time series for each section. To facilitate comparison between sections, the time series for all sections except Pangururan were resampled every 200 yrs using a Gaussian filter with a full width at half maximum of 750 yrs (Fig. 5).
Inclination and declination (open circles) plotted for sampled locations (corresponding with assigned color in legend) using the initial age model based on radiocarbon only with 14C tie points (colored blocks). Solid and dashed lines are the data smoothed using a Gaussian filter. Inclination is well aligned between 23–28 ka and 35–42 ka. Huta Tinggi (dark blue) is unconstrained by age and is “wiggle matched” based on fit and the known sediment record. (For interpretation of the references to color in this figure legend, the reader is referred to the web version of this article.)
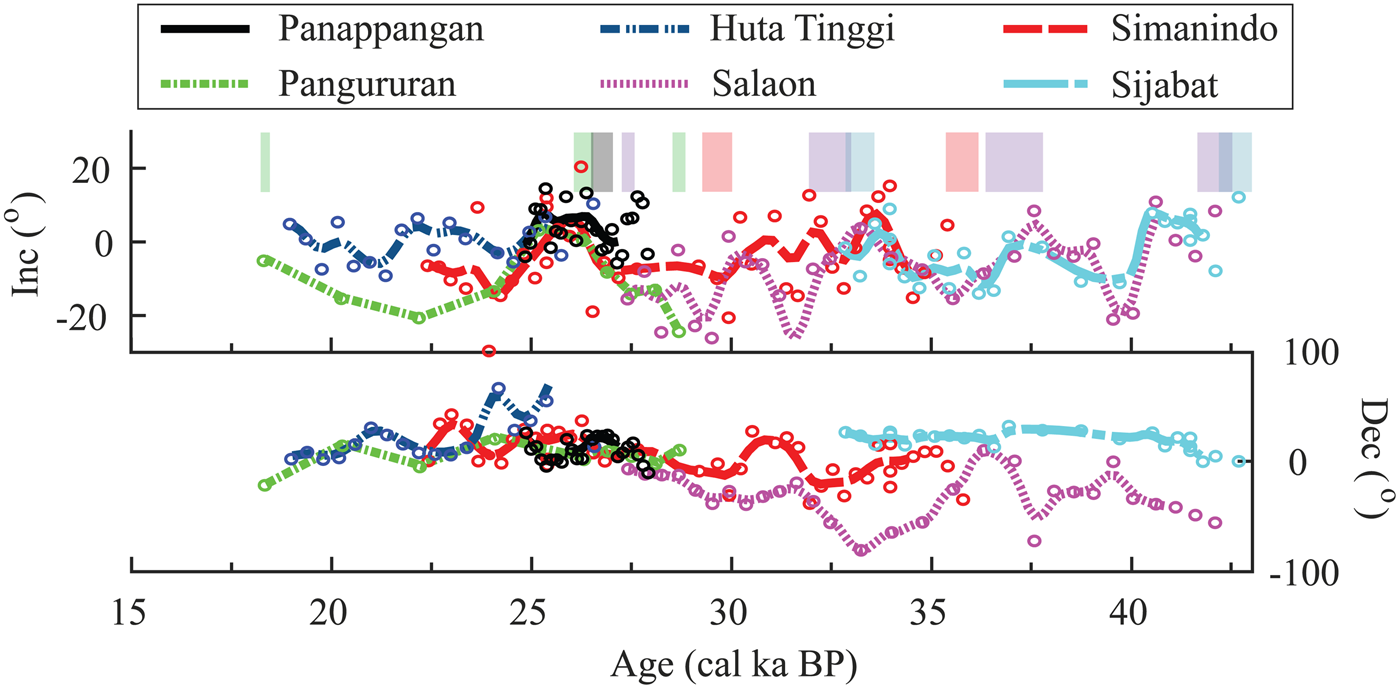
Sedimentation rates for each section shown in millimeters per year.
a Panappangan has an assumed sedimentation rate of 0.75 mm/yr because of its proximity to the age of Pangururan.
Correlating stratigraphic sections
Placing the paleomagnetic records (inclination and declination) on a pseudo-age scale allows comparison from site to site across Samosir Island (Fig. 5). The linear age model assumes a constant sedimentation rate, but the sedimentation rates are unlikely to be uniform through time. Slight adjustments of the age model that improved the paleomagnetic correlation between sites were made by assuming changes in sedimentation rate without changing the radiocarbon-based age tie points. The top of Pangururan is age adjusted from 23 ka to 24 ka, thus increasing the sedimentation rate for that time interval. The top of Panappangan has an age modification from 24 to 25 ka, increasing the sedimentation rate at that time. Two ages for Simanindo are made younger from 26 to 25 ka and 28 to 27 ka, decreasing the sedimentation rate during those time intervals. Sijabat has two age adjustments from 39 to 40 ka and 37.65 to 37 ka, increasing and decreasing the sedimentation rate at intervals around those two ages. Huta Tinggi is unconstrained in age and is therefore “wiggle matched” to Pangururan, because the sections are part of the same depositional unit and share similar magnetic and lithologic characteristics and, therefore, are interpreted to overlap in time, but do not do so in the original age model (Fig. 5). However, there is a possibility that the young date at Pangururan, 18,335 cal yr BP, is inaccurate. Pangururan has a range of radiocarbon dates, 26,064, 26,304, 26,545–28,535, 28,695, and 28,855 cal yr BP, from 953 to 954.6 m, but the radiocarbon age becomes much younger at 18,220, 18,335, and 18,450 cal yr BP at 957.4 m, suggesting that sedimentation rate slowed significantly. As for the sediments at nearby Huta Tinggi, this young ~18 ka radiocarbon age is considered suspect due to possible contamination and was therefore removed, because the age is much younger than the rest of the section. Thus, ages deemed reliable are extrapolated to create new sedimentation rates (Fig. 6).
Inclination and declination (open circles) plotted for sampled locations (corresponding with assigned color in legend) against the modified (radiocarbon and paleosecular variation [PSV]) age model with 14C tie points (colored blocks). Solid and dashed lines are the data smoothed using a Gaussian filter. Pangururan's youngest age is omitted. (For interpretation of the references to color in this figure legend, the reader is referred to the web version of this article.)
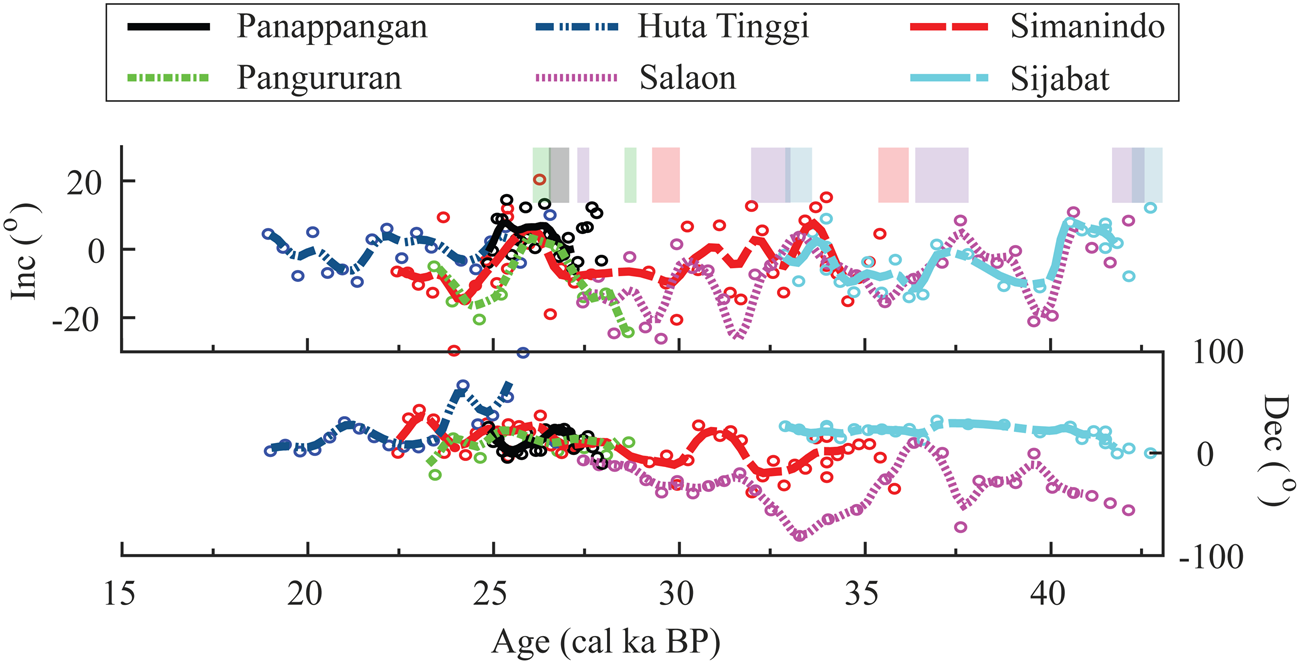
The modified age model displays better agreement in inclination for all sections (Fig. 6). The correlation of inclination matches well between ~23 to 42 ka, with a notable inclination high feature between 23 to 28 ka shared by the Pangururan, Panappangan, and Simanindo sections (Fig. 6). Declination shows agreement but begins to diverge for records older than 30 ka. The sections do not agree as well, with only a good correlation between the 23 to 28 ka time interval. There are several possible explanations for the declination not correlating between sites, including that the sections may have rotated and/or tilted during uplift and/or that the sampling failed to account for azimuthal orientation properly. Additionally, discrete sampling at a spacing of 12–45 cm may not have fully captured the PSV signal, as there are ~200−893 yrs between discrete samples depending on the section. We also note that the rock magnetic properties of these sections do not correlate in any robust manner, suggesting that depositional processes and sedimentation in Lake Toba were diverse (Supplementary Fig. 1).
Evaluating the accuracy of the Toba record to core MD81
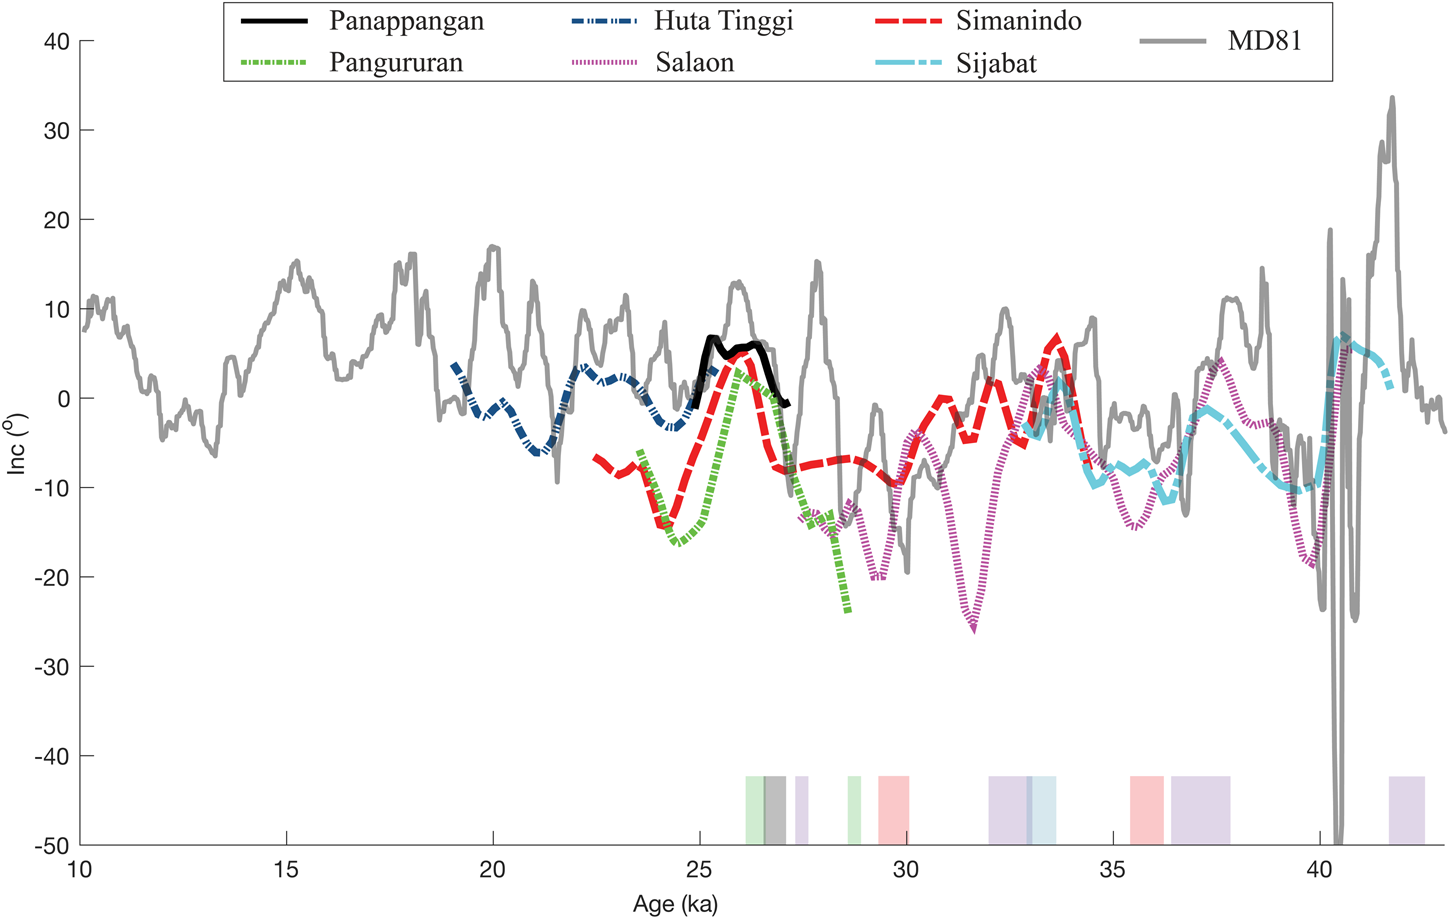
There are few equatorial PSV records around Toba caldera, and none over this time interval. As a result, we must reach out ~3000 km and 28° to the east for an independently dated record to compare against. Initially presented by Stott et al. (Reference Stott, Poulsen, Lund and Thunell2002) and recently updated by Lund et al. (Reference Lund, Schwartz and Stott2017), core MD98-2181 (hereafter MD81), located ~6°N, 125°E, has strong chronostratigraphic constraints with both oxygen isotopes and 28 radiocarbon ages and a high-temporal-resolution PSV record. Inclination comparison shows that the two records are quite comparable between 25 and 40 ka (Fig. 7). Differences could reflect the sampling resolution and lack of age constraints in the Toba record or, at this distance, actual geomagnetic differences. The Laschamp excursion, recorded in MD81 at ~41 ka (Lund et al., Reference Lund, Schwartz and Stott2017), is not observed in our record, and whether this reflects a temporal or sampling limitation is unknown. Overall, the Toba inclination record and the Lund et al. (Reference Lund, Schwartz and Stott2017) inclination record share similar patterns, thus implying preservation of a reliable PSV record in the uplifted sediments in Toba caldera. While the motivation for the present study was to use PSV to improve the stratigraphic framework across Samosir Island, future studies with increased temporal resolution could more fully resolve PSV and, accordingly, improve the correlation between sections, generate higher-fidelity paleogeomagnetic reconstructions, and assess whether the Laschamp excursion was missed in sampling or occurs below the base of our sections.
Lund et al. (Reference Lund, Schwartz and Stott2017) MD98-2181 (MD81) inclination record (gray) plotted against the smoothed Toba inclination record from the six sediment sites on Samosir Island. Colored boxes show Toba's 14C calibrated age range. (For interpretation of the references to color in this figure legend, the reader is referred to the web version of this article.)
DISCUSSION
This is the first paleomagnetic study on the lake sediment on Samosir Island, Sumatra, and it reveals that these sequences record PSV and are a promising target for more detailed paleomagnetic analysis. Although higher sample resolution and replication are needed to define the region's geomagnetic history robustly, the improved chronostratigraphy that the age constraints provide through the combination of radiocarbon and paleomagnetic analysis of six lake sediment sections constrains the uplift of Samosir Island. As a result, we can address the hypothesis that resurgent uplift occurred episodically as a coherent trapdoor with decreasing uplift rates after the initial pulse of uplift (de Silva et al., Reference de Silva, Mucek, Gregg and Pratomo2015).
Uplift rates
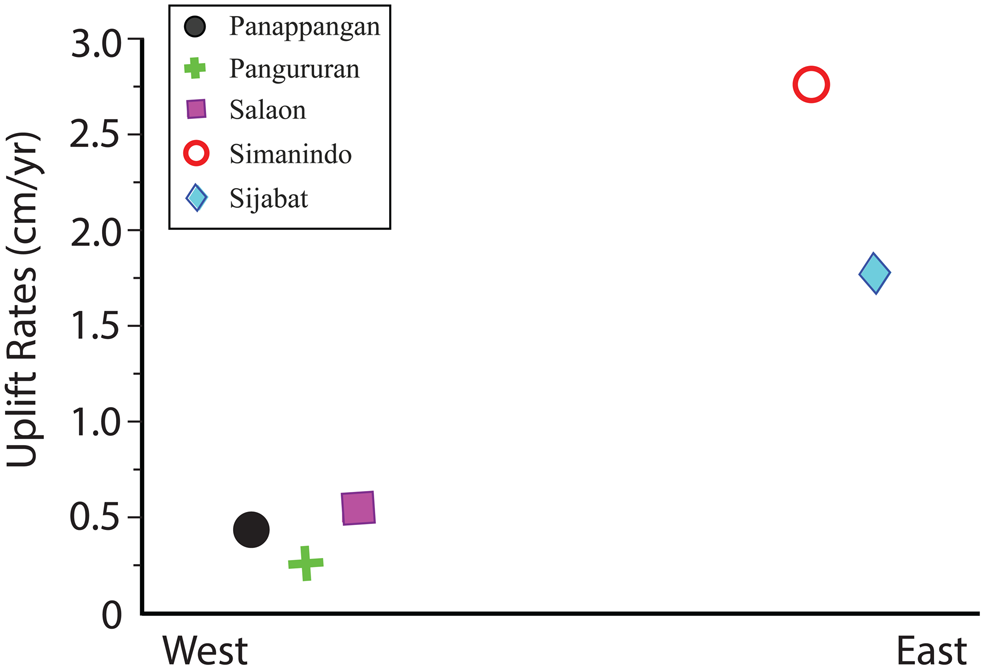
Simanindo and Sijabat are the only two studied sections located on the eastern margin of Samosir Island. Based on the median 14C age and elevation above the lake, Sijabat has an uplift rate of 1.78 ± 0.02 cm/yr, while Simanindo has a higher uplift rate of 2.12 ± 0.03 cm/yr; the age model and radiocarbon ages are interpreted to form minimum uplift rates. The lake level of 900 m is the baseline for minimum uplift calculations. These values are consistent with the Chesner (Reference Chesner2012) and de Silva et al. (Reference de Silva, Mucek, Gregg and Pratomo2015) uplift rates of 1.8 and 2.1 cm/yr for the eastern margin.
The four western sections are predicted to have lower uplift rates assuming a trapdoor style uplift, as suggested by de Silva et al. (Reference de Silva, Mucek, Gregg and Pratomo2015). Salaon and Pangururan have minimum uplift rates of 0.51 ± 0.003 and 0.31 ± 0.002 cm/yr, although the uplift rates would be slightly higher if the uppermost sediment were dated, with the exception Sijabat, where the uppermost sediment was dated. Panappangan has a minimum uplift rate of 0.40 ± 0.004 cm/yr. The uplift rates calculated from the youngest 14C ages indicate that uplift was faster to the east and slower to the west, consistent with trapdoor style uplift hinged to the west (Fig. 8).
(color online) Uplift rates of five sections plotted along their E-W location. Huta Tinggi is not included, as it does not have reliable independent radiocarbon constraint to calculate uplift rate.
Evidence for uplift style
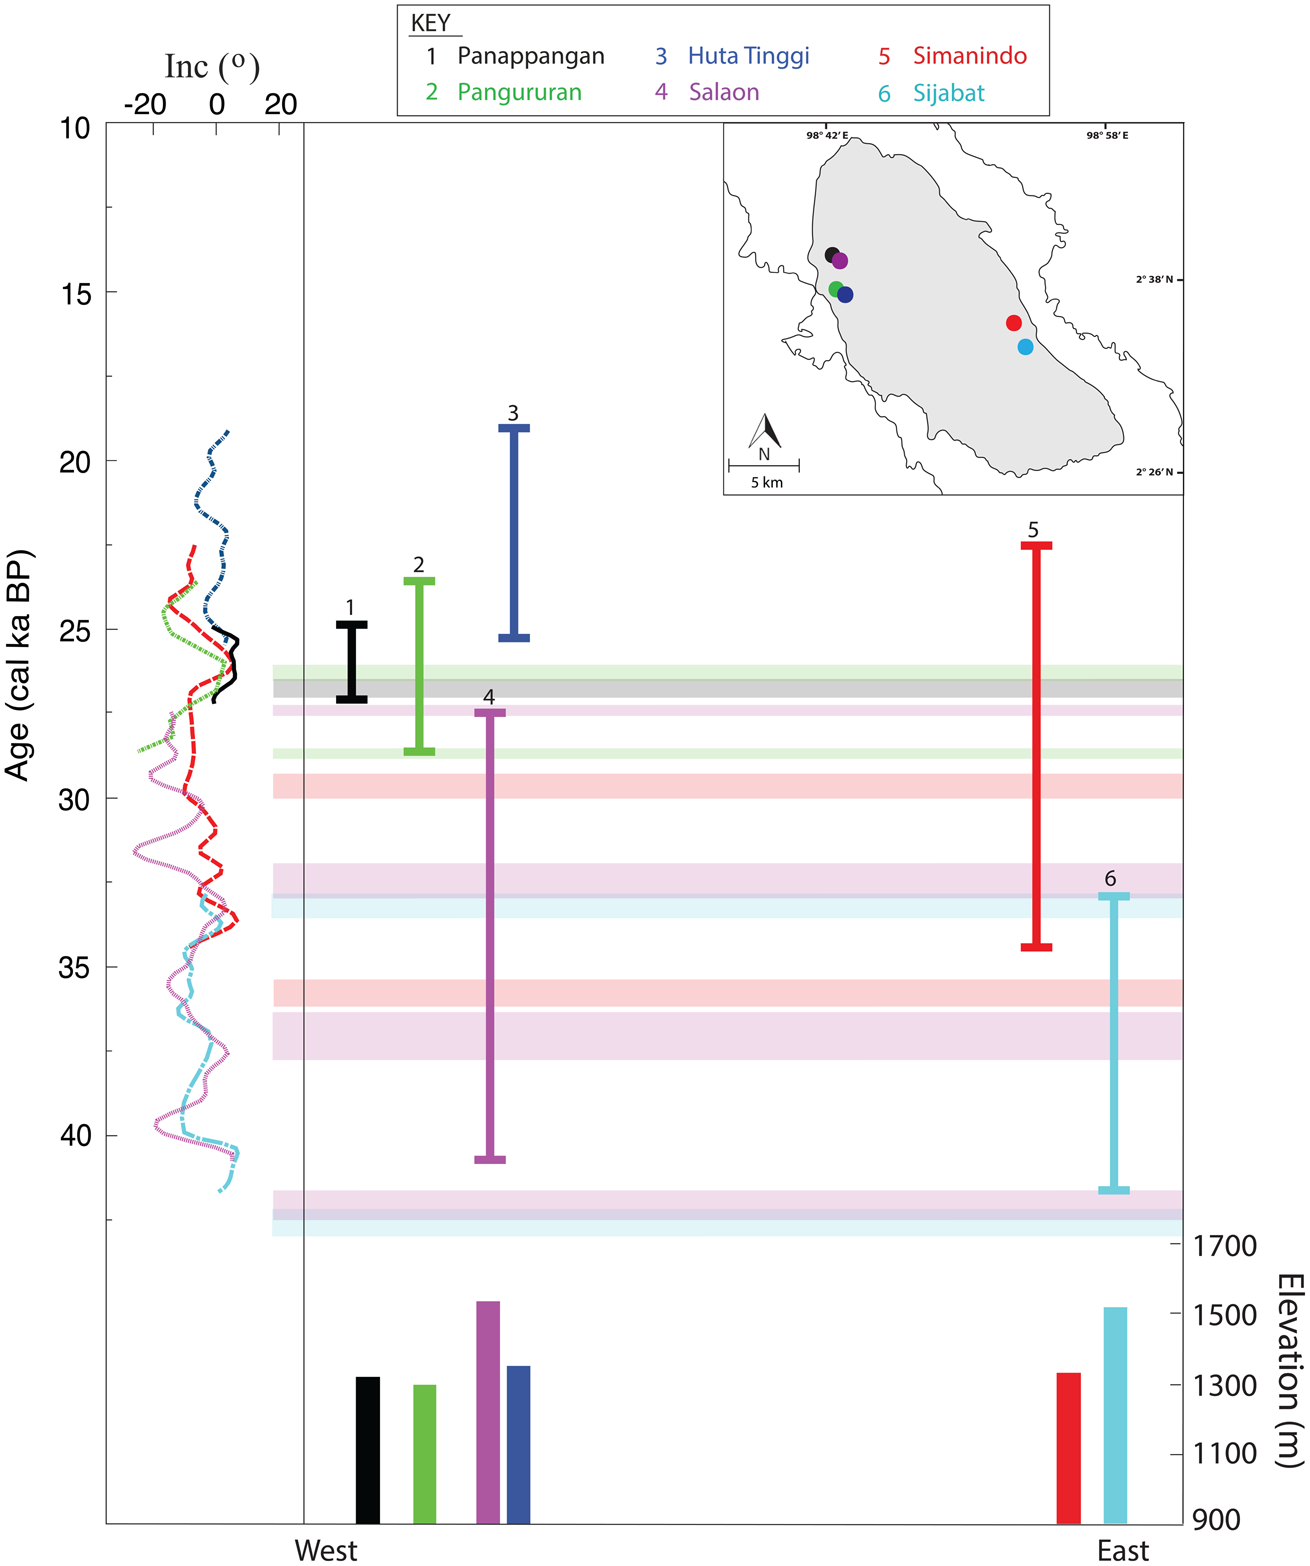
The age section relationship shown in Figure 9 illustrates the depositional history of each site respective to its E-W location. Lake sediment on the eastern and western sections overlap in time of deposition; Salaon and Pangururan could be younger, as the uppermost sediment packages were too high to sample. The two eastern sections (Salaon and Sijabat) range from 27,250, 27,412, and 27,575 cal yr BP to 42,180, 42,662, and 43145 cal yr BP; this is in contrast to the four western sections, where the radiocarbon ages range younger from 26,064, 26,304, and 26,545 to 35,375, 35,777, and 36,180 cal yr BP. The eastern side of the island is older with higher uplift rates, while the west is younger with slower uplift rates. This information does not determine an uplift style, but by making a critical assumption that erosion is negligible through time and at each location, then we can assume that the youngest age at a section is the time of approximate uplift from the lake. Applying this criterion to the age model, we can begin to understand the age-elevation history to attempt to constrain an uplift style.
Illustration of inclination-assisted age model. Smoothed inclination record shown on the left. Horizontal lines represent 14C age tie points, and site sections are represented by their unique colors. Inset map of locations of sampled sections on Samosir Island denoted by colored dots. Thin colored lines denoted by color are a simplified paleosecular variation (PSV) time range illustrating how sections overlap in time and relative latitude. Elevation from sea level of each stratigraphic section shown on bottom, location denoted by color. Sedimentation on the west and east overlap in time, but deposition stops on the eastern side before the west in most sections (except Salaon), suggesting the eastern side was uplifted above lake level first. (For interpretation of the references to color in this figure legend, the reader is referred to the web version of this article.)
Differential trapdoor uplift
Previous work has suggested that Samosir Island uplifted as a coherent trapdoor (van Bemmelen, Reference van Bemmelen1939; Chesner, Reference Chesner2012; de Silva et al., Reference de Silva, Mucek, Gregg and Pratomo2015). However, that conclusion is based on a small number of radiocarbon ages and the structure and dip of the island. This study expands the sample size and has created a more comprehensive picture of Samosir Island. From this, we can conclude that Samosir differentially uplifted as a trapdoor, with faster uplift rates to the east.
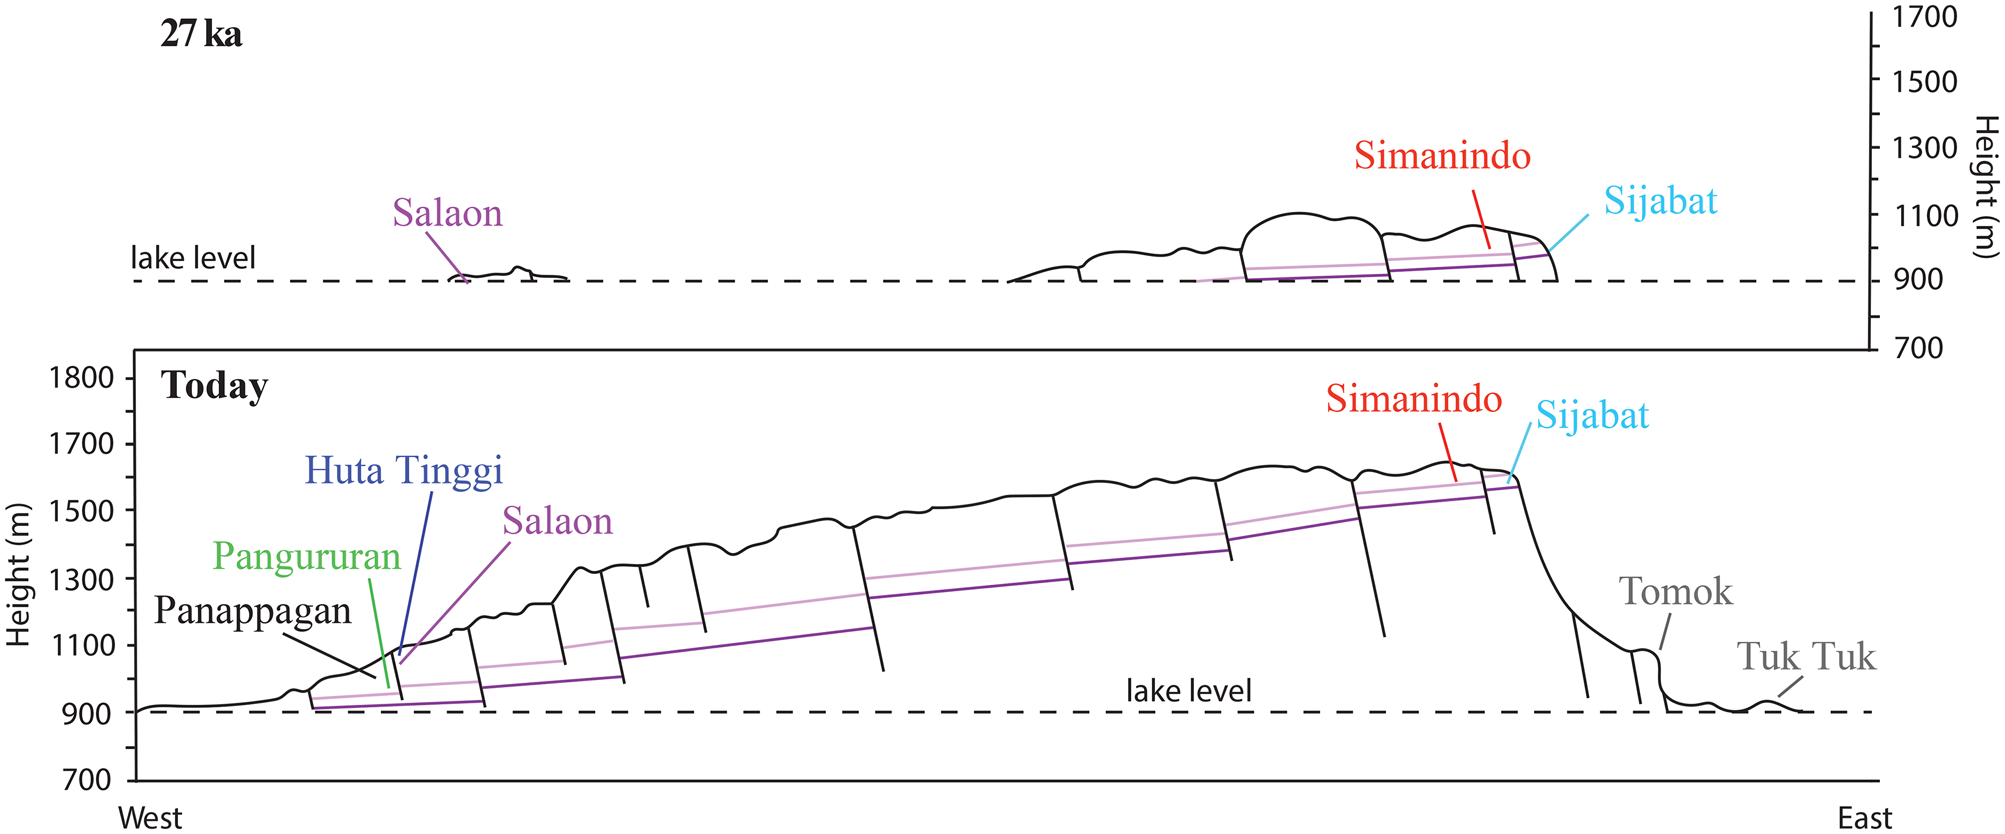
Using the assumption that the tops of the sections reflect when deposition stopped due to uplift out of the lake, then the age model implies a piecemeal style uplift—when multiple blocks of the dome uplift differentially from each other—instead of a coherent block (e.g., Cole et al., Reference Cole, Milner and Spinks2005). According to the PSV record, Salaon, Pangururan, and Panappangan on the western side uplifted with or before Simanindo to the east (Fig. 9). The difference in elevation across the island can be explained by the different rates of uplift that simulate a trapdoor due to the Samosir fault. Faster uplift rates to the east led to a higher elevation, and slower uplift rates to the west resulted in a lower elevation. Another possible explanation for the different elevations is that uplift rates are episodic over time. This would mean that the western side (lower elevation) has a more extended period of quiescence between uplift, while the eastern side (higher elevation) has shorter periods of quiescence.
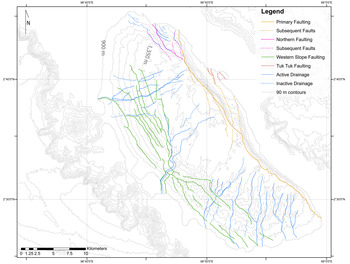
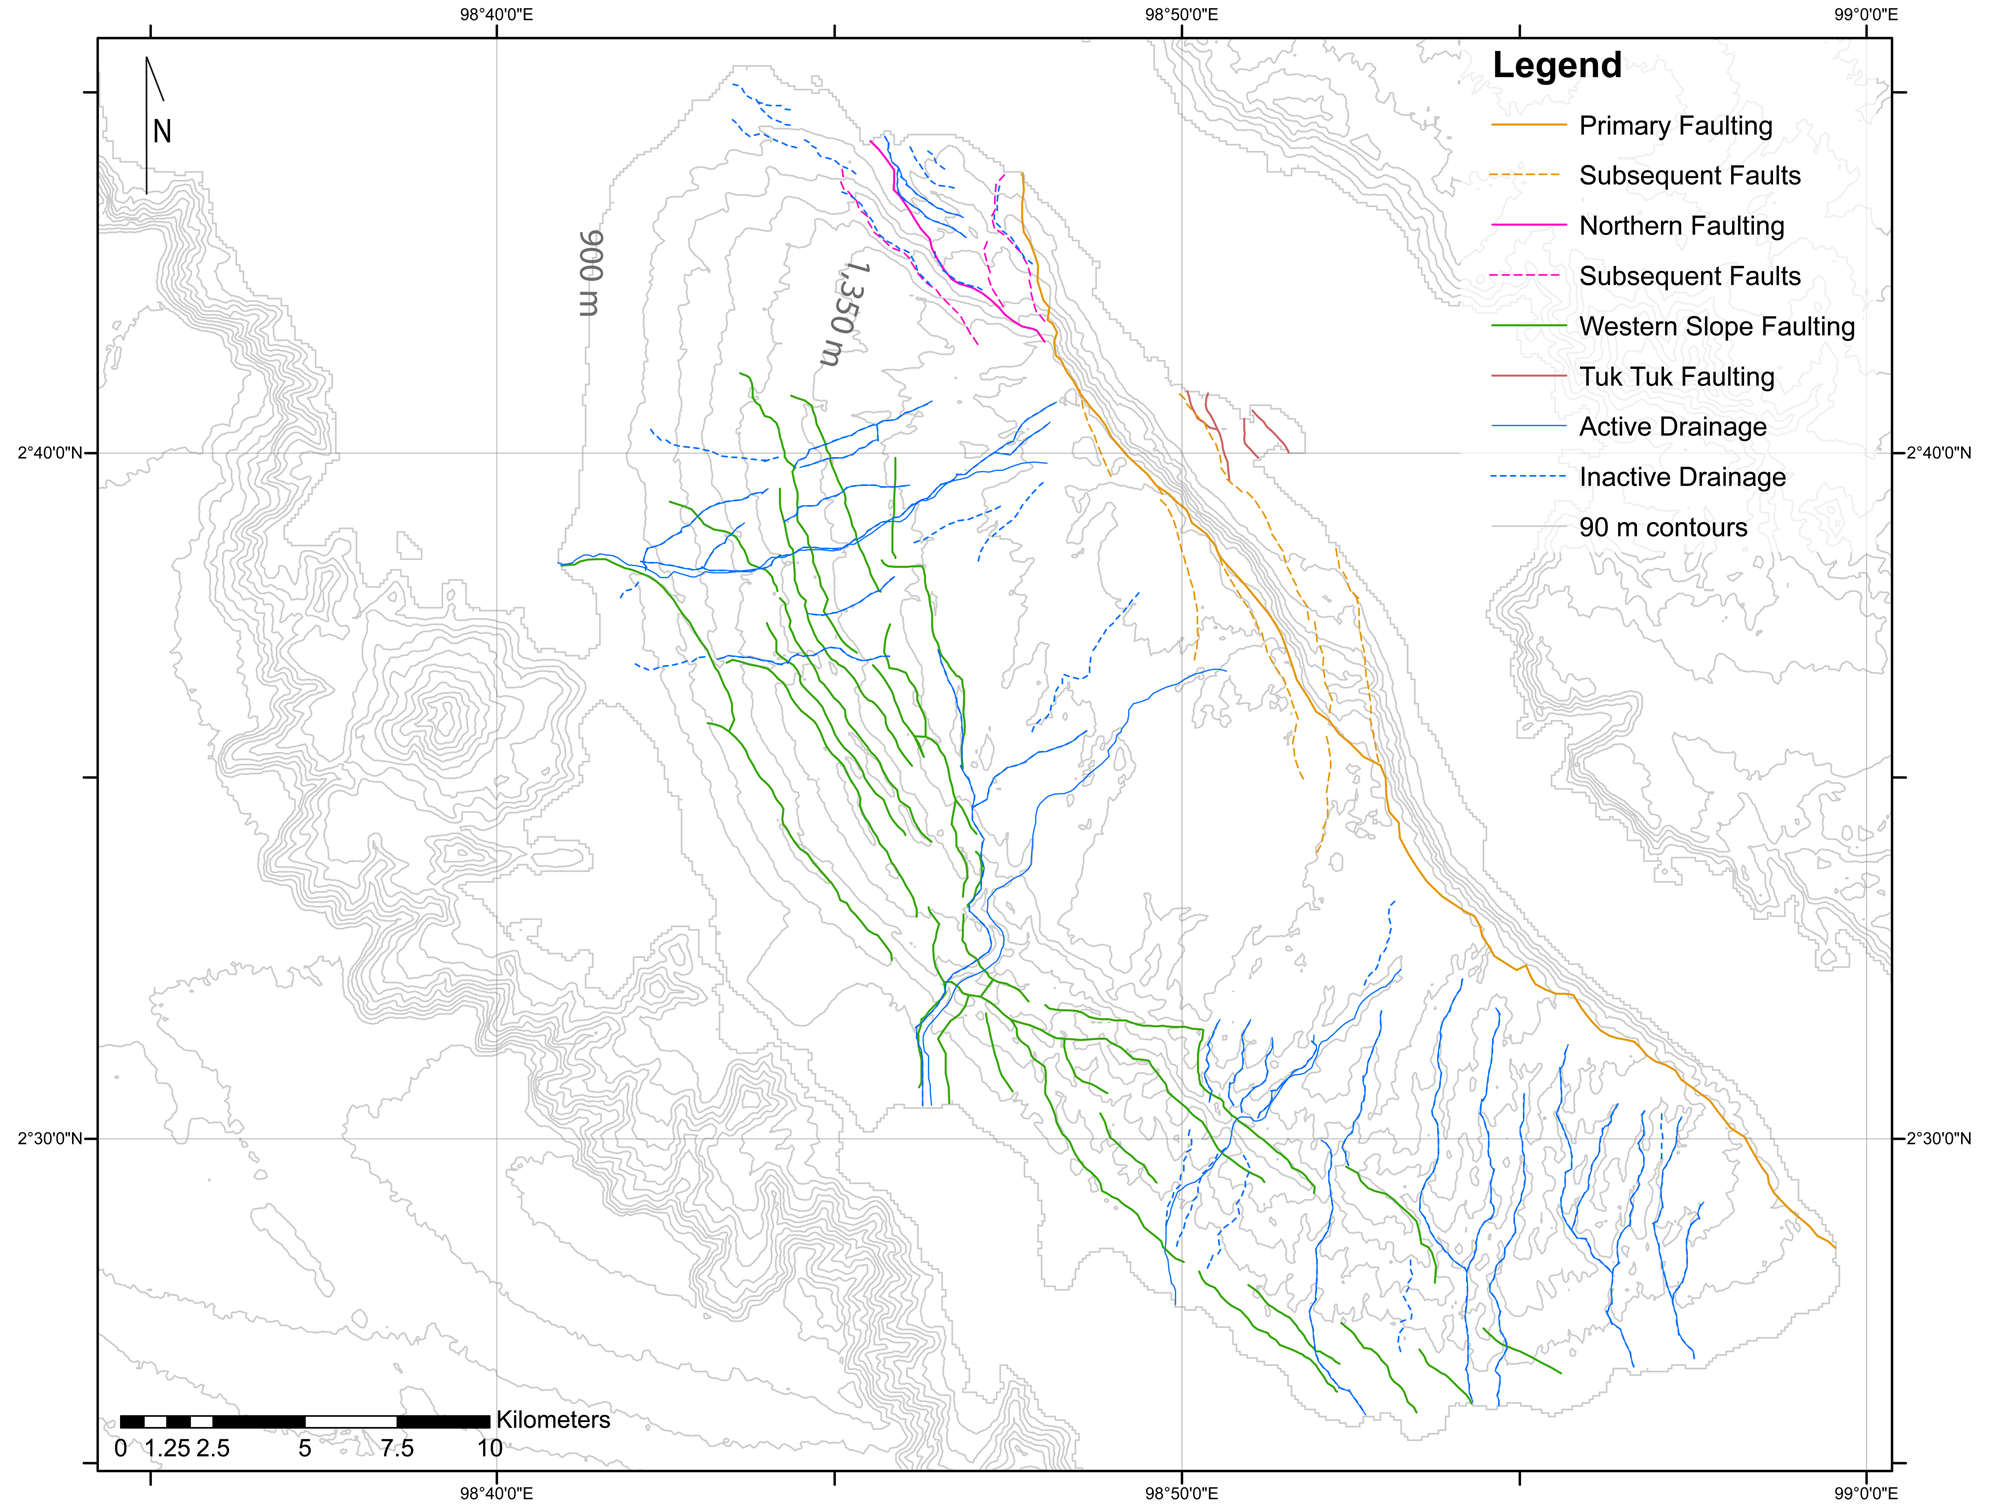
Samosir Island is heavily faulted, reflecting deformation during uplift and probably reflecting faulting during the original collapse of the caldera. These faults have facilitated significant displacement of sediment (de Silva et al., Reference de Silva, Mucek, Gregg and Pratomo2015; Mucek et al., Reference Mucek, Danisik, de Silva, Schmitt, Pratomo and Coble2017; Fig. 10). The faulting, along with the evidence from the PSV record, suggests that Samosir Island uplifted as a trapdoor, but some parts of the island moved differentially during or after uplift (Fig. 11). The uplift style and rate of uplift can provide insight into the mechanism causing resurgence. De Silva et al. (Reference de Silva, Mucek, Gregg and Pratomo2015) modeled these and found that a single-pulse intrusion is responsible for the uplift of Samosir Island. Now, with the possibility of an episodic piecemeal style uplift, this implies that a single pulse of magma could be oversimplified. Resolution of this question requires a higher-resolution investigation than that conducted here, but the present investigation suggests that the potential of the approach used here is promising.
Deformation of Samosir Island from faulting and drainage on a 90 m contour map. Uplift of Samosir Island is thought to be accommodated by the Samosir fault (orange) with hinged normal faults (green) (from de Silva et al., Reference de Silva, Mucek, Gregg and Pratomo2015). (For interpretation of the references to color in this figure legend, the reader is referred to the web version of this article.)
Conceptual model of resurgent uplift of Samosir Island at ~27 ka (top) compared with today (bottom). Samosir Island uplifted as a trapdoor with inferred piecemeal normal fault blocks deforming the surface and causing differential uplift over time. Site locations along two conceptual sediment layers (pink and purple lines) demonstrating sediment section correlation. (For interpretation of the references to color in this figure legend, the reader is referred to the web version of this article.)
CONCLUSIONS
• This first paleomagnetic study of sediments uplifted from Lake Toba on Samosir Island demonstrates that they record the geomagnetic field and can be used for PSV studies. These first results reveal the negative inclination anomaly is a characteristic geomagnetic feature of this region and is apparent over this short 40,000 yr observational period (Yamaskai et al., Reference Yamazaki, Kanamatsu, Mizuno, Hokanishi and Gaffar2008; Yamasaki and Oda, Reference Yamazaki, Oda, Channell, Kent, Lowrie and Meert2013). Directional variations, particularly inclination, can be correlated from section to section consistent with independent dating. The record produced is similar to the PSV record from the marine sediment core MD81 (Lund et al., Reference Lund, Schwartz and Stott2017) supporting the validity of the PSV record. This suggests that large-scale dynamics, and not local variations, drive this geomagnetic variance.
• The combination of radiocarbon and PSV allow us to extend the oldest lake sediment found along the Samosir fault from ~33.7 ka (de Silva et al., Reference de Silva, Mucek, Gregg and Pratomo2015) to older than 46,600 cal yr BP.
• Minimum uplift rates calculated from the youngest sediment estimated at each section reveal that the eastern side of Samosir Island uplifted faster (averaging ~2.3 cm/yr) than the western side (averaging ~0.7 cm/yr) mimicking a trapdoor.
• The age model created from paleomagnetic directional data, 14C ages, and the locations and elevations of the sections suggest Samosir Island uplifted in several piecemeal blocks, but expanded sampling and higher-resolution records are needed to ratify this conclusion fully.
ACKNOWLEDGMENTS
This research is made possible by National Science Foundation grant EAR1551187, the Geological Society of America Harold Stearns Student Research Grant, and the Oregon State University Paleo-and-Environmental Magnetism Laboratory (supported by NSF-EAR0651585). Fieldwork was aided by Martin Danišík from Curtin University and Jade Bowers from Oregon State University.
SUPPLEMENTARY MATERIAL
The supplementary material for this article can be found at https://doi.org/10.1017/qua.2020.13.