

Introduction
Comparative studies of welfare have increasingly questioned the reliability and validity of macro-quantitative approaches, indicating an increased awareness of what has been called the ‘dependent variable problem’ of comparative welfare research (see Clasen and Siegel, Reference Clasen and Sigel2007). This is more than a minor technical problem because the most commonly used measures of ‘welfare state change’ often produce conflicting answers to key research questions about the nature of recent processes of welfare state change (Kühner, Reference Kühner2007). One important outcome of this debate is the understanding that combinations of large-n quantitative and qualitative case study designs are often preferable to single-epistemology approaches. Even within the quantitatively informed literature, scholars have stressed the need to account for the multidimensionality of ‘welfare state change’, acknowledging that single-indicator research is prone to providing simplistic and – in the worst case – misleading assessments of welfare reform trajectories.
Simultaneously, and for related reasons, the long-running debate on the question of how we might best classify the diverse welfare states found across the OECD has become increasingly characterised by dissensus (see Abrahamson, Reference Abrahamson1999; Arts and Gelissen, Reference Arts and Gelissen2002). For the most part, scholars have agreed (albeit often implicitly) that the traditional focus on social protection makes sense. Increasingly, however, the case for a more broadly based conception of social policy has been asserted. Evans and Cerny (Reference Evans, Cerny, Ellison and Pierson2003) suggest the welfare state has been replaced by a ‘competition state’, with traditional social protections being gradually dismantled in favour of workfare type policies. Others have argued that the emergence of a post-industrial knowledge economy has led welfare states to increasingly emphasise investment in human capital (Castells and Himanen, Reference Castells and Himanen2002; Room, Reference Room2002). Such claims suggest that classifications of welfare types now need to account for both the productive and protective elements of welfare.
The ‘dependent variable problem’ matters here in two ways: firstly, the classification of welfare types depends on the data used to measure welfare effort; beyond this, however, there is a growing methodological debate as researchers have proposed different techniques to calculate membership of welfare types based on multiple dimensions. Crucially, similar to the choice of indicators, the choice of method can also have a real bearing on findings. This is particularly true when conceptually distinct and ‘antithetical’ dimensions of social policy are included in the classification.
Here we will revisit our (Hudson and Kühner, Reference Hudson and Kühner2009) exploration of the protective and productive social policy activity across 23 high-income countries. In particular, while utilising the same raw data, we will contrast the findings produced by four different methodological techniques to compute membership of productive–protective welfare ideal types: additive indices using Z-scored data, cluster analysis, factor analysis and fuzzy-set ideal type analysis. In doing so, we argue that the recently developed fuzzy-set ideal type analysis has clear advantages over more traditional statistical techniques.
Classifying welfare states: a problem of measures or methods?
The modern literature on welfare state types has been fundamentally shaped by Esping-Andersen (Reference Esping-Andersen1990). Via extensive analysis of data and, especially, through the development of an innovative decommodification index that drew on administrative data about social security systems as a proxy for the strength of social rights, he identified a trichotomy of ideal types. Recently, his work has been strongly challenged by some scholars. Scruggs and Allen (Reference Scruggs and Allan2006; Scruggs, Reference Scruggs, Clasen and Siegel2007) have provided arguably the most direct critique of Esping-Andersen's methods to date. In particular, they suggest the use of standard deviations from the mean to calculate his decommodification index can create ‘unjustified discontinuities in scoring’ (Scruggs and Allen, Reference Scruggs and Allan2006: 58) as countries with closely related scores just below or above one standard deviation score very differently with this method. As a consequence, they favour utilising standardised Z-scores for the computation of ‘overall welfare generosity scores’. Z-scores measure how far an original score deviates from the respective mean on a continuous scale; a positive Z-score indicates that the observation is greater than the mean, while negative scores indicate a figure below the mean. The calculation of Z-scores is a formidable tool for the compilation of indices that combine data from a range of different measures because they standardise scores in a common format so that data can then be added or averaged to compute a single overall additive index. Aside from Scruggs and Allens’ (Reference Scruggs and Allan2006) use of the approach to capture a measure of the protective intent of welfare, Room (2000) deploys Z-scores in developing a prototype ‘human investment regimes’ index that captures the productive intent of welfare. Both use Z-scores to compile a cumulative index that allows nations to be ranked on the basis of their protective or productive intent respectively.
While useful for ranking nations, index measures can prove more problematic in terms of classifying them into different types, though this did not appear to be an issue that troubled Esping-Andersen greatly. A more sophisticated alternative comes through cluster analysis. Powell and Barrientos (Reference Powell and Barrientos2004) utilise this technique to allocate nations to welfare types on the basis of data similar to Esping-Andersen's, but with new components such as the welfare mix and active labour market policy (ALMP) spending added in for good measure. Indeed, Powell and Barrientos (Reference Powell and Barrientos2004: 91) seem very confident about the method's virtues, arguing ‘cluster analysis has proved the most effective and widely used technique to identify welfare regimes’. Certainly, cluster analysis is a powerful tool for uncovering patterns in any given data set. It is a useful exploratory tool for welfare regime analysis because it groups countries in such a way that the degree of statistical association between two nations is maximal if they belong to the same group and minimal otherwise. Hierarchical cluster analysis uses a stepwise procedure in which cases are combined into clusters, which are then combined further into sub-clusters – thereby, the actual number of clusters is determined solely by the data itself. Contrastingly, the so-called K-means clustering uses a similar basic principle, but requires the researcher to fix the number of cluster centres.
In his discussion of statistical techniques utilised to allocate countries to ideal types, Shalev (Reference Shalev2007: 291) dubs factor analysis the ‘cousin’ of cluster analysis as the underlying statistical properties are quite similar. Factor analysis is a data reduction procedure that allows for the categorisation of numerous related dimensions into fewer unrelated factors without forfeiting a great deal of significant statistical information. More precisely, factor analysis computes factors so that highly correlated variables load high on one factor, but not on any other. Ideally, factors should be completely uncorrelated, but this is rarely the case in social science research. New sets of factor scores are generated for each case in a given sample according to the factor loadings. These scores can be used for further analysis instead of original empirical data.
What all of the above techniques have in common is that they rely on mean averages, standard deviations and a linear understanding of relationships between variables that can mask important elements of cross-national diversity. In particular, they are prone to outlier effects: if a country is exceptionally strong or weak in one dimension, then this can have an undesirable impact on its classification; this is a particular problem for the calculation of additive indices, but the problem can hamper cluster and factor analysis too. Moreover, while useful for identifying statistical patterns in the data, the approaches find it difficult to identify, or, indeed, pay due regard to, important conceptual issues signified by the data. The recently developed fuzzy-set ideal type analysis can overcome these issues (see Kvist, Reference Kvist, Rihoux and Grimm2006; Vis, Reference Vis2007 for applications).
Fuzzy-set ideal type analysis
Fuzzy-set ideal type analysis has its origins in fuzzy-set social science (Ragin, Reference Ragin2000). Its starting point is that cases are best understood as distinct and differing configurations of multiple, conceptually rooted, dimensions. Given this, the first practical step for those undertaking fuzzy-set ideal type analysis is to specify the key conceptual dimensions that are the focus of analysis and then proceed by viewing each of these dimensions as a ‘set’ in which the cases can have varying degrees of membership. Sets are ‘fuzzy’ because in the real world ‘crisp’ boundaries are rare occurrences; fuzzy-set analysis reflects this by analysing cases on the basis of their graded, partial memberships of sets.
The operationalisation of fuzzy-set analysis proceeds by assigning each case a score between 0 (full non-membership) and 1 (full membership) for each set being examined. However, rather than simply rescaling raw data via arithmetic computation, fuzzy-set analysis allows researchers to reconsider their data from a conceptual viewpoint. Fuzzy-set analysis thus differs from traditional quantitative approaches as it requires researchers to calibrate individual variables on the basis of ‘external, dependably known standards’ and is not content with using ‘very crude but passive’ mean averages and standard deviations which depend highly on characteristics of individual samples (Ragin, Reference Ragin2008: 77). So, for instance, as Kvist (Reference Kvist, Rihoux and Grimm2006: 174) notes, if unemployment benefit replaces 100 per cent of previous income in a country, it seems evident that this ought to be regarded as a full member of the ‘generous welfare’ set. Yet, such a system does not exist anywhere in the world and, based on substantive knowledge of cases, a researcher might suggest that any unemployment benefit system replacing 90 per cent or more of previous income can be viewed as a full member of the ‘generous welfare’ set and that variation above this cut-off point means little for the analysis of sets. In short, fuzzy-set analysis demands that researchers consider how raw data relates to verbal descriptors of their concepts and to specify qualitative breakpoints at the top (fully in) and bottom (fully out) of their sets (see Kvist, Reference Kvist, Rihoux and Grimm2006; Ragin, Reference Ragin2000). Ragin (Reference Ragin2000) outlines numerous techniques for specifying the values between these two breakpoints; the most straightforward model is to compute a continuous scale of values between these two breakpoints (see Ragin et al., Reference Ragin, Rubinson, Schaefer, Anderson, Williams and Giesel2006).
For fuzzy-set ideal type analysis – developed in a social policy context by Kvist (Reference Kvist, Rihoux and Grimm2006, Reference Kvist, Clasen and Sigel2007) in particular − the scores for each fuzzy set are essential. Yet, what is equally important is how multiple dimensions are combined; this particular issue is especially important to the arguments we present in this paper. Two key principles of logic are utilised to analyse combinations of sets: logical NOT (the negation principle) and logical AND (the intersection or minimum principle). Together, these two principles can be used to calculate all possible combinations of the multiple fuzzy sets being analysed. Here, fuzzy-set ideal type analysis offers us a number of advantages over techniques that rely on the computation of statistical means. Firstly, it does not allow for compensation effects to mask the real extent of diversity. If a welfare state is ‘weak’ in one area, it cannot ‘make up’ for this by being ‘very strong’ in another area. Secondly, the approach allows for the simultaneous analysis and measurement of multiple dimensions and handles these dimensions in a manner that emphasises, rather than ameliorates, difference: fuzzy logic allows us to classify nations on the basis of multiple, even conflicting, components. Finally, by forcing us to think about the links between data and concepts, fuzzy-set analysis offers a bridge between quantitative and qualitative approaches. In particular, by recognising that not all variation matters, fuzzy-set analysis avoids the distorting effects of extreme values that can thwart some quantitative analyses.
Productive and protective welfare types revisited
The potential of fuzzy-set ideal type analysis in practice is best illustrated by means of an example. Here we draw on our recent classification of welfare states on the basis of their protective and productive dimensions (see Hudson and Kühner, Reference Hudson and Kühner2009 for a broader discussion of variable selection, chosen cut-off points and findings). We have already noted that while many theorists believe welfare states have become more concerned with strategies for investing in human capital in recent years, most attempts to classify welfare states into ideal types follow Esping-Andersen's lead by emphasising the protective intent of social security programmes. In order to address this weakness, we used fuzzy-set ideal type analysis to classify welfare states on the basis of four key components: two reflecting the key protective dimensions found in employment and income protection programmes, and two reflecting productive dimensions found in education and active labour market programmes (ALMPs).
These four conceptually rooted dimensions were translated into four fuzzy sets that logically combine to a total of 16 types. Four of these are ‘pure’ ideal types. Countries which score high on each of the four fuzzy sets – education investment, training investment, income protection and employment protection – combine both productive and protective elements successfully and constitute the productive−protective ideal type. Countries that score high on both productive sets (education and training investment), but do not make it into the protective sets are purely productive ideal types. Equally, purely protective ideal types score high on income and employment protection, but perform less well in education and training investment. Weak ideal types score low on both protective and productive fuzzy sets.
The remaining types are hybrids; these are also relevant. Weak productive–protective types each score high only on one of the respective productive and protective fuzzy-set variables – that is, these cases show high education investment paired with either high income or high employment protection or high training investment with either high income or employment protection. Those countries that score high on both productive sets and also on one of the two protective fuzzy sets are labelled productive-plus types. If a country only scores high on one of the productive and none of the protective countries, they were labelled weak productive. Equally, those countries with high scores on both protective and one additional productive fuzzy set are labelled protective-plus types. Weak protective types score high on only one of the two protective fuzzy-set variables.
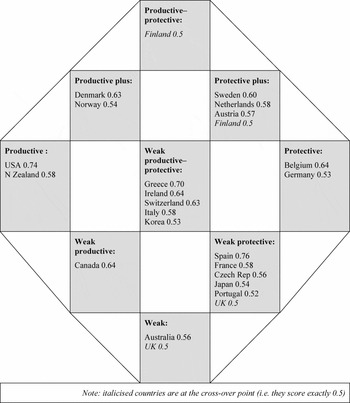
Figure 1 outlines the fuzzy-set ideal type memberships of the different productive–protective property spaces introduced above for the year 2003 (the most recently available data) for the maximum number of countries with available data (23 in total) as presented in Hudson and Kühner (Reference Hudson and Kühner2009). Several countries are members of one of the four ‘pure’ ideal types. Finland is at the cross-over point for the productive–protective ideal type, which is interesting since it matches Castells and Himanens’ (Reference Castells and Himanen2002) thesis of the Finnish model being closest to what they call an ‘informational welfare state’ – that is, managing to combine both productive and protective elements simultaneously. Further support for their thesis comes from the USA − which they regard as an unbalanced informational welfare state, focusing only on the human capital dimension – being placed strongly within the pure productive set, where it is joined by New Zealand. Significantly, the USA's fuzzy-set membership score for this set is amongst the highest across all the countries and all the pure types in the sample, stressing the strong balance of its welfare state toward productive features. Both Belgium and Germany are members of the pure protective set, perhaps reflecting the corporatist orientation of their welfare arrangements. Meanwhile Australia, along with the UK (which is at the cross-over point), are placed within the weak set according to the data, hinting that these two nations steer a mid-course between the American and European traditions – offering a cut-down version of each model – rather than sharing the same features as the USA as suggested by most typologies.
Fuzzy-set ideal type country memberships and fuzzy scores (2003).

The countries placed within the hybrid types are also of interest. Denmark, Norway and Sweden all are very close to qualifying for membership in the productive–protective ideal type. We (Hudson and Kühner, Reference Hudson and Kühner2009) thus suggest that all four Scandinavian countries are, at least, very close to combining productive and protective elements in their respective welfare states. This is an important finding, for it is at odds with Holliday's (Reference Holliday2000) argument that protective and productive features are mutually exclusive and the basis of different welfare state types. Indeed, the fuzzy-set findings present an additional challenge to Holliday (Reference Holliday2000) as, contrary to his suggestion that a focus on productive welfare forms the basis of an East Asian model, neither of the two included East-Asian countries actually qualifies as a purely productive ideal type. Rather, the data suggests that Korea is merely a member of the weak-productive–protective hybrid type alongside countries such as Greece, Ireland, Switzerland and Italy. Japan is characterised as a weak-protective hybrid alongside countries such as Spain, France, Czech Republic and Portugal.
Fuzzy-set ideal type analysis v traditional approaches
Although there is more to be said about the classifications identified above, we believe that, fuzzy-set ideal type analysis has produced a robust set of groupings that stand up well to more detailed case-based scrutiny. The placing of the Scandinavian nations reflects recent reform processes designed to reorient welfare towards a ‘knowledge economy’ while maintaining their protective intent (see Benner, Reference Benner2003); the USA's position emphasises the strength of its welfare state's productive intent rather than, as is the case in most classifications, being merely presented as a welfare laggard on the basis of weak social protection (cf. Castells and Himanen, Reference Castells and Himanen2002); the East-Asian nations are more accurately classified, as Esping-Andersen (Reference Esping-Andersen1997) suspected, as weak hybrids rather than uniquely productively focussed types. While, ultimately, it is only meticulous reference back to the detail of national level cases that can confirm the extent of our classification's utility, we will demonstrate in the following discussion the value of a fuzzy-set ideal type analysis over more traditional statistical approaches by using the same raw (i.e. unfuzzified) data to compute alternative models via Z-scores, cluster analysis and factor analysis.
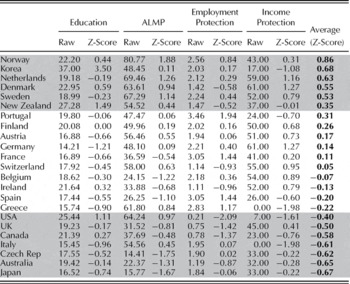
Table 1 presents standardised Z-scores for each of our four dimensions along with an overall index calculated as an average of each of the standardised indicators, with nations listed according to their ‘rank’ in an overall ‘productive–protective’ index. As we noted earlier, cumulative indices of this sort are commonplace in comparative research. However, the severe limitations of this approach become apparent almost immediately in this instance.
Standardised Z-scores based ‘productive–protective index’

Firstly, and most importantly, the rankings that emerge mean very little in conceptual terms. So, for instance, Korea is ranked second in this ‘productive–protective’ index, but a closer inspection of its scores for each individual component shows that its ‘strong’ performance is almost entirely determined by the education indicator: its welfare state is heavily driven by education spending, but its ALMP and employment protection scores are little better than average and its income protection score is significantly below average. In other words, we have a classic case here of the cumulative score being skewed by strong performance in a single dimension. In terms of the productive and protective dimensions of welfare, Korea is a hugely unbalanced case; in fuzzy-set ideal type analysis, knowing this is crucial in terms of classifying it. In a cumulative index, however, this conceptually important imbalance in its constituent elements is masked by the averaging process. On a similar note, Finland ranks well below Korea on this ‘productive–protective’ index for the simple reason that its individual component scores are all distinctly average. Crucially, however, it is one of only two countries (the other is Norway) to deliver average or above-average scores for every component: if our goal is to determine whether welfare states are balanced in their treatment of productive and protective dimensions, then Finland's delivery of consistently average scores across all components is, again, conceptually crucial, but cannot be captured in a cumulative index.
The second major problem, therefore, flows from the first. If our goal is to classify nations into different groupings on the basis of a constructed measure of welfare state effort, then there is always a difficult question as to where the boundaries between the groups might be drawn. In Table 1, we have somewhat arbitrarily chosen a dividing point of one-third above or below 0 as the cut off for our groupings (as indicated by the shaded areas of the table), but there is no conceptual basis for such a division. Moreover, because the final scores cannot tell us anything about the balance between productive and protective intent, the groupings do not work well as classifications when compared to our fuzzy-set groupings.
These weaknesses, of course, would not be apparent if we were to devise an index that aimed to capture only either the productive or protective intent of welfare, but this is our main point: all welfare states have multiple dimensions, some of which may be conceptually ‘antithetical’. Good classifications ought to be able to reflect this.
Given the problems cumulative indices face in producing classifications, many researchers, as we noted earlier, have highlighted the potential of cluster analysis. While undoubtedly more sophisticated as a technique, it is far from the magic bullet that some have suggested. Figure 2 presents the results of a cluster analysis of our raw data; following Powell and Barrientos (Reference Powell and Barrientos2004), we utilised a hierarchical cluster analysis using the Ward method. The analysis produced three groupings indicated by the dashed horizontal lines on the dendogram in Figure 2.
Productive Protective Groupings Based on Cluster Analysis.

While the approach is preferable to a straightforward index insofar as it gives a clear mathematically rooted indication of how our different countries might be grouped together, the validity of these groupings can be swiftly challenged by pointing to the placement of the USA alongside Italy and Greece. Utilising cluster analysis, these three nations are strongly grouped together (forming what is deemed to be a sub-set of the second cluster). It does so largely on the basis of their very weak income protection scores (see Table 1), overlooking the hugely important conceptual significance of its other scores. In particular, cluster analysis deems the similarity of their scores in this one component to be so overwhelmingly important that: (i) the USA's very strong emphasis on education and Greece and Italy's very weak emphasis on education is irrelevant, and (ii) that, equally, the strong employment protection found in Greece and Italy (arguably the key feature of their frameworks) and the USA's very weak employment protection does not matter either. In our fuzzy-set ideal type analysis, these variations are key: the USA, for instance, is fully in the education set and fully out of the employment set, while Italy and Greece are clearly out of the former and clearly in the latter. Consequently, fuzzy-set ideal type analysis identifies a hugely important conceptually rooted difference between the USA and Greece/Italy and so places them in very different ideal types. In stark contrast, cluster analysis pays no attention to the conceptual significance of variations in the data. It looks for patterns that may, or may not, mean something more than that there are some similar numbers in the cases it groups together.
Moving finally to unrotated principal component factor analysis, it yields three factors, which together account for about 90 per cent of the variance. Compared to the fuzzy-set findings, the interpretation of these three factors and corresponding factor loadings is not exactly straightforward either. Education spending loads highest on the first factor and ALMP spending is correlated positively with it as well, but with a much lower loading. Nevertheless, since both employment and income protection load negatively on the first factor, it could be interpreted as a ‘productive factor’ and thus in line with our conceptual discussion of productive–protective ideal types.
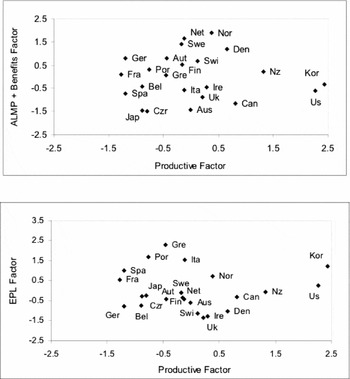
The implication of the second factor for our discussion of productive–protective ideal types is less clear: income and employment protection and ALMP spending load positively. More confusingly still, income protection loads negatively on the third factor, while education and ALMP spending and employment protection load positively. Quite clearly then, the second and third factors are problematic for our purposes, as they challenge our initial conceptual division of welfare into productive and protective elements. A look at the factor scores does not help to shed any light on these rather unhelpful findings. By plotting factor scores against each other, as suggested by Shalev (Reference Shalev2007), some regional clustering becomes apparent (see Figure 3), with some Scandinavian, Southern European and Anglophone countries being relatively close to each other across the two plots, but on the whole this does not leave us with an informative clustering of countries, and there are several countries that do not seem to follow this general pattern (e.g. Denmark, Japan, the United States) and the Continental European corporatist countries are scattered around rather unsystematically.
Productive and Protective Factor Scores.

Again, the limitations of factor analysis can also be highlighted by pointing to specific cases. Finland appears to be closer to some of the corporatist, rather than the social democratic, countries and finds itself right in the centre of the two charts in Figure 3, thus suggesting that its factor scores are ‘average’ and indistinct rather than indicative of an alternative type of welfare state. Meanwhile, the case of Korea demonstrates that factor analysis has not managed to deal with its exceptionally high public education spending, being presented – together with the United States – as a ‘productive’ factor outlier, thereby overstating its exceptional character on the basis of one indicator.
In many ways, these findings are unsurprising. Conceptually, factor analysis assumes that there is a hypothetical parameter behind bundles of variables, which are related to each other. The analysis of relationships between pairs of indicators, which informs the identification of individual factors, as well as relationships between indicators and factors, which is used to determine factor loadings, relies on Bravais Pierson correlation coefficients. While these Bravais Pierson correlation coefficients strictly assume a linear relationship between variables, they are determined by the empirical covariance, which is computed as the sum of products of the standard scores of the two measures  and
 , where
 and
 are the respective sample means and sX and sY the respective sample standard deviations of these measures. This helps to illustrate that factor analysis has rightly been dubbed cluster analysis’ ‘cousin’ and is even similar to additive indices of Z-scores: it cannot uncover the conceptual significance of variations in the data including questions about meaningful and un-meaningful scores for individual cases. Crucially, the calculation of these factors is also highly dependent on distributional characteristics, such as mean average scores, standard deviations and outliers, of the underlying data.
Conclusions
The ‘dependent variable problem’ is no longer only a problem of conceptualisation and indicator operationalisation. As analysts have increasingly acknowledged the multidimensional character of welfare states, it has also become an issue of choosing the most appropriate methodological technique to determine country membership to theoretically informed ideal types. In this paper, we have outlined the virtues of utilising fuzzy-set ideal type analysis for this endeavour. To date, statistical methods rooted in averaging processes have dominated attempts to classify welfare states on the basis of quantitative data. Crucially, while such approaches work well when dealing with a single component of welfare, they struggle to cope with more complex pictures of welfare that highlight multiple, conceptually distinct and ‘antithetical’, components of welfare. Fuzzy-set ideal type analysis, meanwhile, excels in offering just such an analysis because distinct and conceptually rooted sets are its starting point.
Of course, fuzzy-set ideal type analysis is not without problems. Chief amongst these is the issue of how to define qualitative break-off points for the upper and lower boundaries of fuzzy sets. While more recent contributions have begun to address this issue (see e.g. Rihoux and Ragin Reference Rihoux and Ragin2008), those still in doubt should note that arbitrary cut-off points are necessary for drawing boundaries between groups in Z-score based indices or, even, in cluster analysis where judgement calls sometimes need to be made about how many clusters are indicated by the results. Similarly, factor analysis lacks a definite specification to determine the number of factors. While the standard procedure is to extract only factors with an eigenvalue >1, the so-called Kaiser criteria, it is worth stressing that this handling of the data is also strictly speaking subjective, arbitrary and mainly a matter of convention. No doubt, issues around the extraction of clusters or factors are as important – if not more important – than the issue of defining break-off points in fuzzy-set analysis.
It seems clear that fuzzy-set ideal type analysis is a powerful tool for the classification of welfare state types and offers considerable advantages over traditional statistically rooted approaches. With comparative welfare state theory having shifted its focus towards the multidimensionality of welfare state strategies, we believe fuzzy-set ideal type analysis should play a bigger role in future research agendas as a consequence.