Ketosis is a common health problem in early lactation of dairy cows (Steensels et al. Reference Steensels, Maltz, Bahr, Berckmans, Antler and Halachmi2017). The first symptoms of ketosis are loss of appetite, reduced food intake, reduced in milk yield and reduced activity (Steensels et al. Reference Steensels, Maltz, Bahr, Berckmans, Antler and Halachmi2017). Ketosis is also associated with changes in milk composition (Krogh et al. Reference Krogh, Toft and Enevoldsen2011) and decreased reproductive performance (Walsh et al. Reference Walsh, Walton, Kelton, LeBlanc, Leslie and Duffield2007). Because ketosis, subclinical as well as clinical, responds well to treatment (Maplesden, Reference Maplesden1954; Kahn & Line, Reference Kahn, Line, Kahn and LIne2010), early detection can reduce production losses and improve animal well-being.
Information on changes in behaviour of cows can be used for early diagnosis of diseases, as suggested by Tolkamp et al. (Reference Tolkamp, Haskell, Langford, Roberts and Morgan2010) and Steensels et al. (Reference Steensels, Bahr, Berckmans, Halachmi, Antler and Maltz2012). Several studies show the effects of ketosis on milk yield (Lark et al. Reference Lark, Nielsen and Mottram1999), milk parameters (Duffield et al. Reference Duffield, Kelton, Leslie, Lissemore and Lumsden1997; Nielsen et al. Reference Nielsen, Friggens, Chagunda and Ingvartsen2005; Krogh et al. Reference Krogh, Toft and Enevoldsen2011), blood analyses (Forslund et al. Reference Forslund, Ljungvall and Jones2010) or behavioural variables (Bareille et al. Reference Bareille, Beaudeau, Billon, Robert and Faverdin2003; Edwards & Tozer, Reference Edwards and Tozer2004; Huzzey et al. Reference Huzzey, Veira, Weary and von Keyserlingk2007). Management practices have an effect on the incidence of ketosis (Nir (Markusfeld), Reference Nir (Markusfeld)2003; Stengärde et al. Reference Stengärde, Hultgren, Tråvén, Holtenius and Emanuelson2012). A recent companion study by Steensels et al. (Reference Steensels, Maltz, Bahr, Berckmans, Antler and Halachmi2017) demonstrated that ketotic cows have lower rumination duration, lower activity and lower milk yield than do healthy cows.
Several ketosis detection methods were described in the literature, focusing on performance variables, behaviour variables and management factors. Lark et al. (Reference Lark, Nielsen and Mottram1999) found significant deviations in milk yield from 3 d before the diagnosis in ketotic cows, using a time series model of daily milk yield. They note, however, that deviations from milk yield forecasts are not sufficiently sensitive as specific predictors of clinical ketosis on their own. Bareille et al. (Reference Bareille, Beaudeau, Billon, Robert and Faverdin2003) applied a mixed linear model to analyse the relationships between health disorders on the one hand and daily milk production and daily food intake on the other hand. On the day of diagnosis, ketosis was associated with reduced milk production and food intake. Edwards & Tozer (Reference Edwards and Tozer2004) analysed the short-term effects of disease on steps per hour and milk yield, based on a repeated measures regression model. Their results suggest that ketosis might be detected 8 d before the day the diagnosis was actually made, based on walking activity; and 6 d before the day of diagnosis based on milk yield. Duffield et al. (Reference Duffield, Kelton, Leslie, Lissemore and Lumsden1997) analysed test day milk fat and milk protein, using a logistic regression model to detect subclinical ketosis in early lactation. A high percentage of fat and a low percentage of protein in the milk were associated with significant increases in the risk of subclinical ketosis. However, sensitivities and specificities of milk fat or milk protein tests were low. Also, combining the milk fat and milk protein tests did not improve the ability to identify ketotic cows. Krogh et al. (Reference Krogh, Toft and Enevoldsen2011) analysed the fat-to-protein percentage ratio as an alternative for a milk-based cow-side BHBA test and a urine-based cow-side AcAc test. The urine-based cow-side test had the highest sensitivity (0·78) and specificity (0·99). The milk-based cow-side BHBA test had a high specificity (0·99), but a low sensitivity (0·58). The fat-to-protein percentage ratio had a sensitivity of 0·63 and a specificity of 0·78. Nielsen et al. (Reference Nielsen, Friggens, Chagunda and Ingvartsen2005) presented a biological model that can estimate the risk of ketosis in individual cows. In-line measurements of milk β-hydroxybutyrate (BHBA) were used, along with cow identification, DIM, parity, milk yield, body fatness at calving and records of disease. They discuss that a much larger database is needed for thorough validation and for testing under a variety of on-farm situations. By using logistic regression, Nir (Markusfeld) (Reference Nir (Markusfeld)2003) found that heavier cows at dry-off, cows that calved in summer, cows that suffered from uterine diseases or cows that were in a negative energy balance were more likely to develop clinical ketosis. Stengärde et al. (Reference Stengärde, Hultgren, Tråvén, Holtenius and Emanuelson2012) assessed risk factors related to housing, management and feeding at herd level for clinical ketosis, using a multivariable logistic regression model. A large herd size, a high maximum daily milk yield in multiparous cows, keeping all dry cows in one group and not cleaning the feeding platform daily were found to be risk factors for a high herd incidence of ketosis. A decision-tree model with the aim of presenting fewer cows to the veterinarian for routine examination on a robotic milking farm was proposed (Steensels et al. Reference Steensels, Antler, Bahr, Berckmans, Maltz and Halachmi2016), and was developed and validated for a robotic milking farm. However, the model was not validated for a non-robotic farm.
To our knowledge, no attempt was made to develop a model that detects post-calving ketosis by using a commercial system that continuously monitors rumination duration, activity and milk yield in a non-robotic commercial farm. This study is the first attempt to use existing farm data in the automatic detection of ketosis. On all the farms that participated in the study, sensor data were mainly used for heat detection and for monitoring the nutritional status of the herd. Two behavioural variables (rumination duration and activity) and one production variable (milk yield) were measured on all the farms and included in the logistic regression model.
The sensors used were electronic meters used to measure milk, rumination and activity. The manner in which these performance and behavioural variables are affected and the magnitude of impact, support the possibility of using them to automatically detect post-calving ketosis.
The objective of this study was to develop and validate a mathematical model in order to detect post-calving ketosis in multiparous dairy cows, based on individual rumination duration, activity and milk yield measured with existing commercial sensors.
Material and methods
Animals and housing
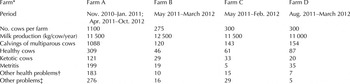
The research was conducted in four commercial dairy farms with Israeli Holstein cows. A total of 706 cows, 203 cows clinically diagnosed with ketosis and 503 healthy cows were included in the database for model calibration and validation (Table 1). The farm practices in Israel include routine post-calving health examinations by the farm veterinarian. The farm veterinarian is part of Hachaklait Veterinary Services Ltd., the main cattle veterinary organisation in Israel. All veterinarians in this organisation use the same post-calving protocol; every cow is examined between five and 12 d after calving for ketosis, using a Ketostix strip (Bayer Corporation) to detect acetoacetate (AcAc) in urine. A cow was considered as ketotic when the strip result was 15 mg AcAc/dL or higher. Ketotic cows were drenched with 1 l propylene glycol for 3 d.
Number of cows per farm, number of sick and healthy cows per farm applied in the model calibration and validation process

* Farm A – Yifat, Farm B – Metzer, Farm C – Nirim, Farm D – Reshafim
† Lameness, mastitis, retained placenta, milk fever, etc.
‡ Data collection problem, health examination outside of the time window of 5 to 12 d after calving, preventive treatment with propylene glycol or unexplained 10% drop in milk yield over two consecutive days
All cows after calving were examined by the veterinarian, during the first 21 d, at least once (cows that had no health problems whether diagnosed by the veterinarian or by the farm staff) and twice (cows that were diagnosed with a health problem). Severe problems that were diagnosed early (day 5 pp) were examined, by the veterinarian, three times during the first 21 d after calving. A healthy cow (i) was declared healthy by the veterinarian in the routine health examination five to 12 d postpartum; (ii) was not diagnosed and not treated for any health problem either by the vet or by the farmer and (iii) had a normal lactation curve increasing gradually and constantly without production collapses of two consecutive days of 10% or more from the previous day.
The cows were housed in groups, in no-stall, fully roofed open cowsheds with dried manure bedding, which is the most common dairy housing in Israel. The cows could move freely in the open yard and the available space was about 20 m2 per cow.
The cows were milked thrice daily in intervals of 8 h in a conventional milking parlour (small farms: herring bone; large farms: parallel). All cows were fed a TMR, according to NRC (NRC, 2001) recommendations. A local feeding centre distributed the feed twice daily. In every farm, scattered food was pushed-up (at least) five times per day.
Sensors and software
All cows, after calving, were equipped with an acoustic HR-Tag™ monitoring system (SCR Engineers Ltd., Netanya, Israel), that was fitted to the neck collar of each cow. The tag measured the activity level and the rumination duration of each individual cow in real time. Milk yield was recorded by electronic milk meters (Free Flow™, SCR Engineers Ltd., Netanya, Israel). All data were transferred during each milking to the herd management software (DataFlow, SCR Engineers Ltd., Netanya, Israel). All diagnoses, treatments and vaccinations were recorded using the same definitions and coding schemes and entered into the herd management program NOA (Hebrew acronym for Managing the National Dairy Herd; Israeli Cattle Breeders Association, Caesarea, Israel). Reports were extracted daily from the DataFlow and NOA software. Data migration and merging were performed in Excel (Microsoft, Redmond, Washington, U.S.A.), and then with Matlab software (MathWorks Inc., Natick, MA, USA).
Database building
Rumination duration, activity and milk yield were analysed for the first three weeks after calving. The data were put in order, by the day on which the routine health examination was conducted by the veterinarian. For rumination duration and activity, a daily sum of twelve 2-h data points was calculated for every cow. For milk yield, a daily sum of milk session data was calculated for every cow.
Model design
A logistic (binary) regression model was developed, where the dependent variable is categorical, i.e. health status which indicated if the cow was ketotic or healthy; and a set of explanatory variables, which were the model inputs: rumination duration, activity and milk yield. The model was developed with Matlab. A logistic regression model was constructed because it can handle categorical variables and it provides a risk probability between 0 (healthy cow) and 1 (sick cow). The logistic regression model used a combination of n model variables in order to fit the response variable z (Hosmer & Lemeshow, Reference Hosmer and Lemeshow2000). Before entering the logistic regression model, each model input variable (var) was transformed to a uniform scale [0–1], using Eq. (1).
 $${\rm xrescaled} = \displaystyle{{{\rm var}-{\rm minimum}\;{\rm (var)}} \over {{\rm maximum}\;{\rm (var)} - {\rm minimum}\;{\rm (var)}}}$$
The general logistic regression equations are presented in Eqs. (2) and (3). The cut-off threshold for classification as healthy or ketotic was set at 0·5.
 $$f\,(z) = (1{\rm} + {\rm} e^{ - z} )^{ - 1} $$
 $$z = \beta _0 + \beta _1 x_1 + \beta _2 x_2 + \ldots + \beta _k x_k $$
As performance measures for the model, confusion matrices, correct classification rates (CCR), false negative rates (FNR), false positive rates (FPR) were used. FNR was defined as the proportion of sick cows that was classified as healthy by the model. FPR was defined as the proportion of healthy cows that was classified as sick by the model. CCR was defined as the proportion of cows, both sick and healthy, that was correctly classified by the model.
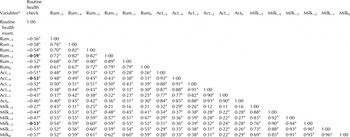
The selection of model variables was based on (i) the correlation between the variables and the day of the routine health examination (Table 2) and (ii) a stepwise regression procedure. Rumination duration (Rum) had the highest correlation with the ketosis diagnosis 2 d before the clinical diagnosis (Table 2, column 1). Activity (Act) had the highest correlation with the ketosis diagnosis 4 d before the clinical diagnosis (Table 2, column 1). Milk yield (Milk) had the highest correlation with the ketosis diagnosis 1 d after the clinical diagnosis. For the model, however, the day with the highest correlation before the routine health examination was chosen, which was 2 d before the routine health examination (Table 2, column 1). Rumination duration (Rum), activity (Act) and milk yield (Milk) on any day from −5 to 0 correlated significantly (P < 0·05) with those variables on the following day respectively (Table 2). Rumination duration on any day from −5 to 0 correlated significantly (P < 0·05) with milk yield and activity on the same day. Activity and milk yield also correlated (P < 0·05) to each other. In order of importance, Rum−2, Act−4 and Milk−2 were the variables with the highest correlation over the course of time (Table 2) and these variables contributed the most, according to the stepwise regression.
Cross-correlation matrix of 45 healthy and 45 sick cows from the large farm

Rumination duration, activity and milk yield were analysed from 5 d before until the day of the routine health examination
* Variables are rumination duration (Rum), activity (Act) and milk yield (Milk) from 5 d (−5) before to the day (0) of the routine health examination and diagnosis. a: correlation is significant at the 0·05 level
The logistic regression coefficients are presented in Eq. (4).
 $$\eqalign{z & = {\rm 17} \cdot {\rm 9}-0 \cdot {\rm 19} \times {\rm Rum}_{ - {\rm 2}} - 0 \cdot {\rm 17} \times {\rm Act}_{ - {\rm 4}} - 0 \cdot {\rm 16} \cr & \quad \times {\rm Milk}_{ - {\rm 2}}}$$
The CCR of the calibration model was 86%, the FNR 18% and the FPR 11%.
Model Calibration and Validation
In a first validation step (within-farm), the model was calibrated on the database of each farm separately. Two thirds of the sick cows and an equal number of healthy cows were randomly selected for model validation. The remaining cows (one third, those cows that did not participate in the model validation) were used for model calibration. In order to overcome the random selection effect, this procedure was repeated 100 times. In a second (between-farms) validation step, the model was calibrated on one single farm and was validated on another farm.
As performance measures for the model, accuracy, specificity and sensitivity were used. Accuracy was defined as the proportion of cows, both sick and healthy, that were correctly classified by the model. Specificity was defined as the proportion of healthy cows classified as healthy by the model. Sensitivity was defined as the proportion of sick cows classified as sick by the model.
Results
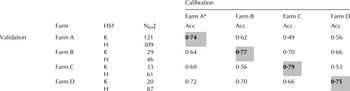
Within-farm accuracy (on the diagonal, Table 3), ranging from 74 to 79%, was higher than between-farm accuracy (not on the diagonal), which ranged from 49 to 72%, on all farms (Table 3).
Accuracies (Acc) of logistic regression model calibrated and validated on four different farms

Within farm (on the diagonal): two thirds of the ketotic cows and an equal number of healthy cows were used for calibration. The remaining cows, those that did not participate in the calibration (one third) were used for model validation. The model was validated on the average coefficients obtained after 100 repeated calibrations
* Farm A – Yifat, Farm B – Metzer, Farm C – Nirim, Farm D – Reshafim
† HealthStatus: K – ketotic; H – healthy
‡ The total number (NTot) of ketotic (K) and healthy (H) cows on each farm are presented in the third column
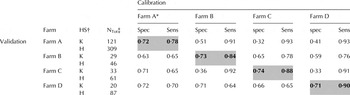
The within-farm sensitivities and specificities ranged from 78 to 90% and 71 to 74% respectively (Table 4, on the diagonal). The between-farms (not on the diagonal) sensitivities ranged from 65 to 95%.
Specificities (spec) and sensitivities (sens) for logistic regression model calibrated and validated on four different farms

Within farm (on the diagonal): two thirds of the ketotic cows and an equal number of healthy cows were used for calibration. The remaining cows, those that did not participate in the calibration (one third) were used for model validation. The model was validated on the average coefficients obtained after 100 repeated calibrations
* Farm A – Yifat, Farm B – Metzer, Farm C – Nirim, Farm D – Reshafim
† HealthStatus: K – ketotic; H – healthy
‡ The total number (NTot) of ketotic (K) and healthy (H) cows in each farm are presented in the third column
Table 4 indicates: (I) when calibration was performed on the data of farm A (big farm) and validation on each farm separately, the specificity ranged from 63% (farm B) to 72% (farms A and D) and the sensitivity ranged from 65% (farms B and C) to 78% (farm A) (See the first two columns in Table 4 – Calibration Farm A). (II) When calibrated on the data of each farm (within-farm calibration and validation), specificity and sensitivity ranges were greatly improved: 72% specificity and 78% sensitivity for farm A, 73% specificity and 84% sensitivity for farm B, 74% specificity and 88% sensitivity for farm C and 71% specificity and 90% sensitivity for farm D (See the diagonal values in Table 4).
Discussion
When the model was calibrated on the data from the bigger farm (Farm A), robustness seems to be satisfactory, with small ranges for within-farm specificity and sensitivity. However, when the model was calibrated on a relatively small number of cows (farms B, C and D), specificity and sensitivity ranges were greater than when calibrated on data from farm A. This indicates that (a) a model calibrated on a higher number of cows is more robust than models calibrated on a lower number of cows, (b) a model should be calibrated on data from the same farm; that is preferable to adopting a model that was calibrated elsewhere, even if that entails a larger number of cows.
Within-farm accuracy was higher than between-farm accuracy, demonstrating that differences exist between farms, despite the fact that all farms have similar housing and veterinary attention. Between-farm differences could be due to differences in weather, distances to the milking parlour or management and milking practices. For example, Farms C and D were located in a warmer and drier climate zone of the country and in Farm A, the distance to the milking parlour was greater. These differences can affect either performance or behaviour or both.
The performance of the model should not be judged separately for specificity and sensitivity. Only when both specificity and sensitivity are high, can the model be considered robust. Sensitivity and specificity are a trade-off between each other. The selection of the cut-off threshold in the logistic regression model influenced the sensitivity and specificity of the model. In this study, the cut-off threshold for the model was set at 0·5. In our case, a higher value will lead to higher specificity and lower sensitivity. In further research, optimising the threshold may maximise model accuracy. However, it is possible that each farm needs its own threshold: a lower specificity means that more healthy cows will be presented to the veterinarian. On the other hand, a lower sensitivity implies that some ketotic cows were missed by the model. One can argue that it is more important that a cow is deemed to be sick than that she is correctly diagnosed, since the farmer can bring the cow to the veterinarian for an exact diagnosis. In the smaller farms (farms B, C and D), the veterinarian routinely visits the farm twice a week. In the big farm (farm A) the veterinarian routinely visits the farm every day, except Saturday.
Because ketosis is associated with significantly lower milk yields (Rajala-Schultz et al. Reference Rajala-Schultz, Grohn and McCulloch1999; Bareille et al. Reference Bareille, Beaudeau, Billon, Robert and Faverdin2003), a decrease in reproductive performance (Gillund et al. Reference Gillund, Reksen, Grohn and Karlberg2001; Walsh et al. Reference Walsh, Walton, Kelton, LeBlanc, Leslie and Duffield2007) and an increased incidence of other health problems (Dohoo & Martin, Reference Dohoo and Martin1984; LeBlanc et al. Reference LeBlanc, Leslie and Duffield2005), it is important to detect sick cows as soon as possible. A higher sensitivity is therefore preferred, even if it entails lower specificity, because treatment for ketosis (i) can be applied by the farmer, (ii) is a relatively cheap medication and (iii) has a low risk of side effects, such as hyperventilation and salivation (Nielsen & Ingvartsen, Reference Nielsen and Ingvartsen2004).
Cows that were not detected by the model at first would likely be detected by the model the next day or two and treated then. Some ketotic cows that might be missed and therefore not treated, might recover spontaneously. Simensen et al. (Reference Simensen, Halse, Gillund and Lutnaes1990) reported a spontaneous recovery in 40% of the ketotic cows. However, the loss in milk in ketotic cows that were not treated could be considerable (Rajala-Schultz et al. Reference Rajala-Schultz, Grohn and McCulloch1999).
Unlike the situation in other studies (Veenhuizen et al. Reference Veenhuizen, Drackley, Richard, Sanderson, Miller and Young1991; Hansen et al. Reference Hansen, Norgaard, Pedersen, Jorgensen, Mellau and Enemark2003; DeVries et al. Reference DeVries, Beauchemin, Dohme and Schwartzkopf-Genswein2009), and a review by (Tatone, Reference Tatone2016), the disease was not induced in this study. Therefore, the exact time of onset of the disease is unknown; the disease might have developed earlier. A possibility for achieving greater accuracy in the model is to induce the disease, but that would only involve a small number of sick cows.
The model is not intended to replace the veterinarian. The practical application of the model developed in this study could be an automatically created list of cows at risk for a disease. In each farm, together with the local veterinarian, a period of a few months could be used as a calibration database. In future research, the developed model can be improved, variables from other sensors can be added or other models can be explored to reach a higher sensitivity and specificity. The additional variables can be real-time milk components (fat, protein, lactose or BHBA), housing, management, feed factors, eating behaviour and so on.
Conclusion
A logistic regression model was developed to predict ketosis in early lactation. The model combined rumination duration, activity and milk yield, recorded by commercial sensors, into one single alarm signal; a list of cows at risk.
The model detected ketosis 1 d before the routine health examination conducted by the veterinarian, with an average accuracy of 76%. A well-calibrated procedure (one third of the data at the same farm) resulted in a sensitivity of 90%.
The fact that the model was developed on one farm and performed reasonably well on other farms evidences the validity of the approach. There might be a farm effect, but the results are not conclusive. The farm effect might be due to different numbers of healthy or sick cows, management practices and environmental conditions (two farms were in the desert region). Therefore, it might be worthwhile to make a larger dataset of farms in the desert regions of Israel and calibrate the model based on that dataset.
In future research more sophisticated models, such as decision-trees or neural-networks can be explored to achieve higher accuracy.
The authors would like to thank the farm personnel and veterinarians from Refet HaEmek, Nirim, Reshafim and Metzer for their cooperation in the project and Doron Bar, Dani Amram and Roni Meyer from SCR Engineers Ltd. for their technical help. The research was funded by the Israeli Agricultural Ministry Chief Scientist Fund, projects nos. 459-4426-10 and 459-4369-10.