





Sarcopenia is a muscle disease resulting from adverse muscle changes that accrue across a lifetime and is defined by low levels of muscle strength, muscle quantity/quality and physical performance(Reference Cruz-Jentoft, Bahat and Bauer1). It leads to an increased risk of falls, fractures, physical disability and mortality(Reference Cruz-Jentoft, Bahat and Bauer1). According to a recent systematic review(Reference Petermann-Rocha, Balntzi and Gray2), the prevalence of sarcopenia ranged from 8 % to 36 % in individuals aged < 60 years and from 10 % to 27 % in those aged ≥ 60 years. In an ageing society, the economic losses caused by sarcopenia are substantial. For instance, the total cost of hospitalisations for individuals with sarcopenia in the USA was estimated to be $40·4 billion, with an average cost of $260 per person(Reference Goates, Du and Arensberg3). Therefore, preventive measures against sarcopenia are a pressing global issue.
A number of studies have reported that BMI, specifically low BMI, is associated with sarcopenia. According to a meta-analysis of cohort studies(Reference Gao, Huang and An4), the OR of low BMI (< 18·5 kg/m2) for sarcopenia was as high as 4·5 compared to that of a BMI ≥ 18·5. Because BMI is an easily computable indicator and affected by demographic and lifestyle factors, the effect of these factors on the association between BMI and sarcopenia warrants investigation. Indeed, previous studies have revealed sex to be an effect modifier of the association between BMI and sarcopenia(Reference Han, Zhao and Guo5,Reference Yoo, Won and Soh6) . However, no studies have identified factors other than sex that contribute to this interaction. Identifying such factors could pave the way for a targeted approach to sarcopenia prevention.
The present study aimed to clarify the impact of demographic and lifestyle factors on the association between BMI and sarcopenia within the framework of a 9-year follow-up study targeting community-dwelling middle-aged and older adults. Given that most studies have focused on sarcopenia in older populations, the present study contributes to this topic by providing insight on sarcopenia in younger individuals, including middle-aged and early-older people.
Methods
Design and participants
This was a 9-year follow-up study. We examined the association between BMI levels at baseline (2011–2014) and the presence of sarcopenia at follow-up physical examinations conducted in 2021 and 2022. Sarcopenia was not evaluated at baseline. The study population consisted of 45 071 community-dwelling adults aged 40–74 years who participated in the baseline surveys of two community-based cohort studies: the Murakami Cohort Study(Reference Nakamura, Takachi and Kitamura7) and the Uonuma Cohort Study(Reference Kabasawa, Tanaka and Nakamura8).
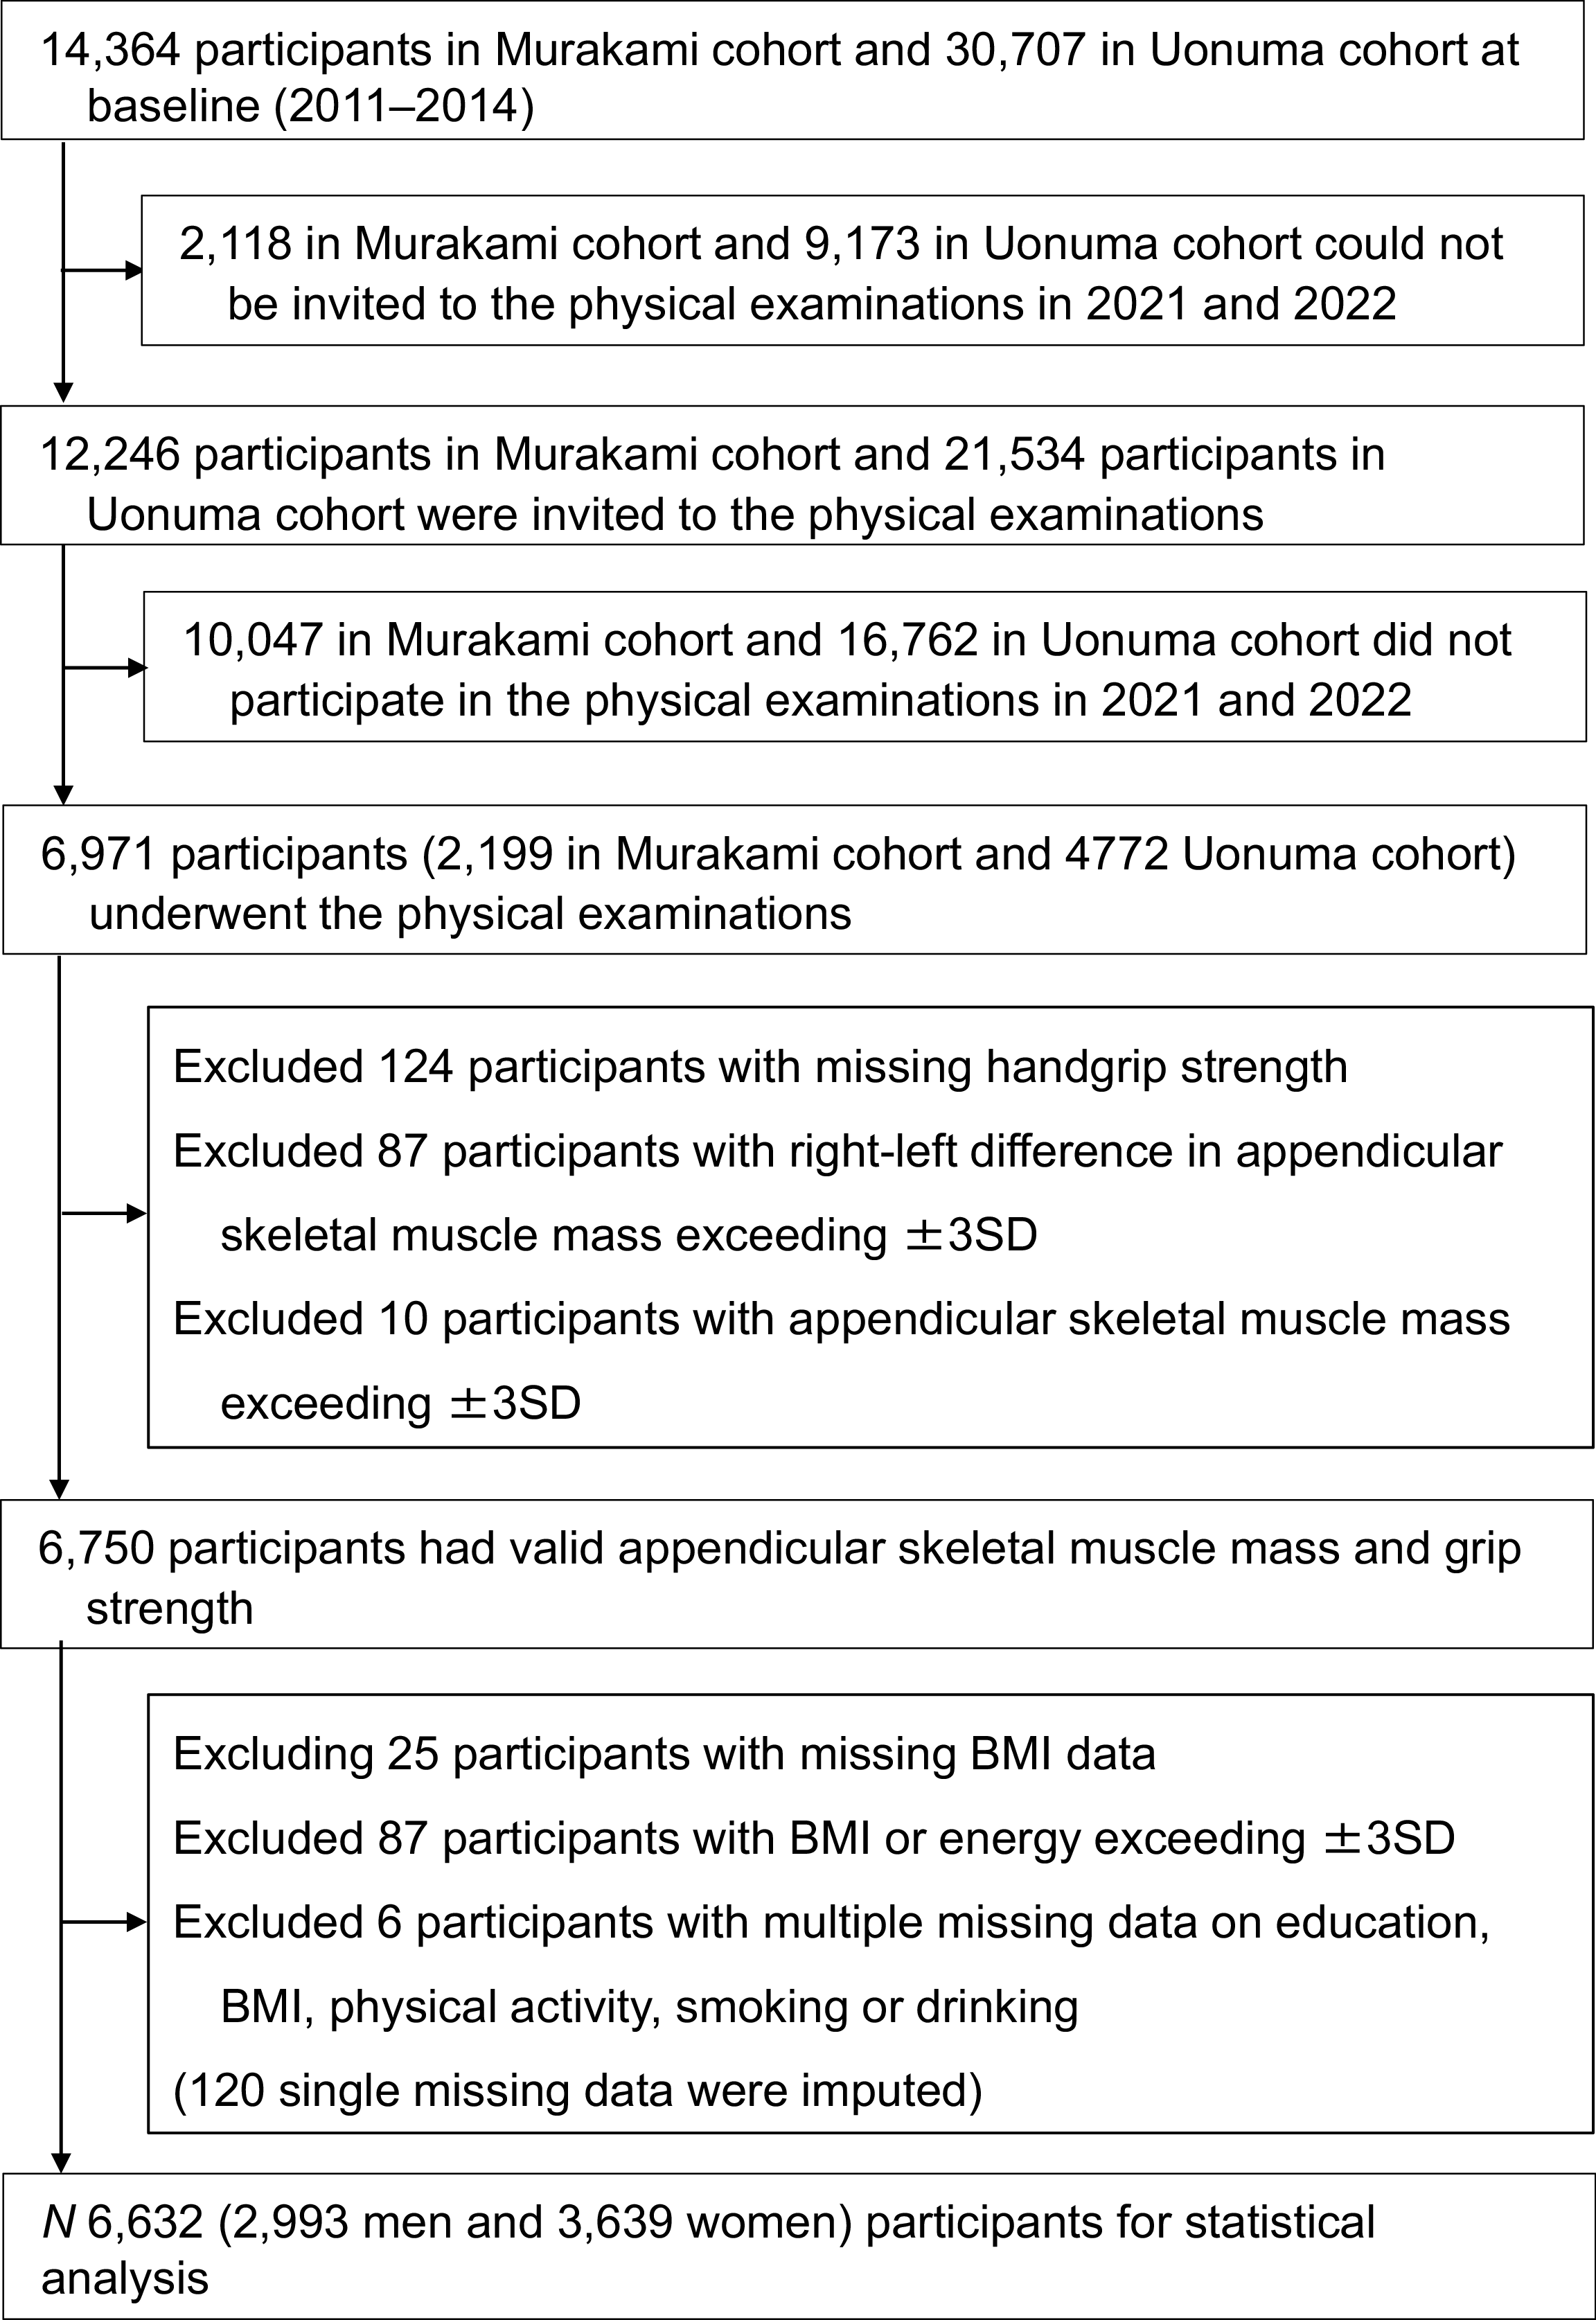
The flow chart of participant selection is shown in Figure 1. Of the target population of 45 071 individuals, 6971 participated in follow-up physical examinations. We excluded 124 participants with missing handgrip strength, eighty-seven with a right–left difference in appendicular skeletal muscle mass exceeding ±3 sd, ten with appendicular skeletal muscle mass exceeding ±3 sd and eighty-two with extreme values exceeding ±3 sd of log-transformed BMI or log-transformed energy as outliers. There were a total of 126 missing values for education level, total PA, energy intake, smoking status and alcohol consumption. Of the 126 participants with missing covariate data, we imputed data for 120 participants who had only one missing value among the five variables, leaving 6632 participants for the final statistical analysis.
Flow chart of participant selection.

To evaluate the representativeness of the analytic sample, we compared selected baseline characteristics between participants included in the present analysis and the original cohort. Baseline distributions of age, sex and BMI group for the analytic sample (n 6632) and the full cohort (n 45 071) are shown in online supplementary material, Supplemental Table 1.
Written informed consent was obtained from all participants. The study protocol was approved by the Ethics Committee of Niigata University (Nos. 2019-0376, 2019-0409 and 2022-0240).
Baseline survey in 2011–2014
The baseline survey was conducted from 2011 to 2013 for the Murakami Cohort Study and from 2012 to 2014 for the Uonuma Cohort Study. At baseline, participants completed a self-administered questionnaire that gathered information on demographics (marital status, education and occupation), body size (height and weight), lifestyle (physical activity (PA), smoking status and alcohol consumption) and disease history (stroke and diabetes). The coding of variables, except for PA, is presented in online supplementary material, Supplemental Table 2. PA levels were estimated by calculating metabolic equivalent (MET) scores (h/d), derived by multiplying the intensity of various activities (listed in online supplementary material, Supplemental Table 2) by the time spent on each activity (The Japan Public Health Center-based Prospective Study Physical Activity Questionnaire: JPHC-PAQ)(Reference Kikuchi, Inoue and Odagiri9). Total PA assessed by the JPHC-PAQ consisted of occupational and household PA, leisure-time PA, sleep and other sedentary activities. Time spent in other sedentary activities was calculated by subtracting the total time spent in occupational and household activities, leisure-time activities and sleep from 24 h. Energy and total protein intakes were assessed using a previously validated FFQ(Reference Yokoyama, Takachi and Ishihara10). Total protein intake was energy-adjusted using the residual method.
BMI
BMI was calculated as weight (kg) divided by height squared (m2). BMI levels were classified according to the WHO criteria as underweight (< 18·5 kg/m2), low-normal (18·5–20·6 kg/m2), mid-normal (20·7–22·6) kg/m2, high-normal (22·7–24·9 kg/m2) and overweight/obese (≥ 25·0 kg/m2)(11). To evaluate the validity of self-reported anthropometric data, we compared self-reported and directly measured height and weight in a subsample. Spearman’s rank correlation coefficients between self-reported and measured values were 0·974 for height in men, 0·975 for height in women, 0·972 for weight in men and 0·973 for weight in women (n 1752 for men and 2259 for women; P < 0·0001 for all coefficients)(Reference Nakamura, Takachi and Kitamura7). After excluding outliers exceeding ±3 sd, the mean differences (self-reported minus measured) were 0·4 cm (sd, 1·6) in men and 0·4 cm (sd, 1·4) in women for height, and 0·1 kg (sd, 2·3) in men and 0·2 kg (sd, 1·8) in women for weight. For BMI, the Spearman’s rank correlation coefficient between self-reported and measured values was 0·962 (P < 0·0001), and the mean differences were –0·1 kg/m2 (sd, 0·9) for men and 0·0 kg/m2 (sd, 0·8) for women.
Physical examinations in 2021–2022
Physical examinations, including body composition and grip strength measurements, were conducted in collaboration with local governments at annual health checkups in 2021 and 2022. Body composition measurements were performed using an 8-electrode standing multi-frequency bioelectrical impedance analysis (MF-BIA) device (MC-780A-N, Tanita), and appendicular lean mass (ALM) was estimated. Measured data obtained with this device have shown high correlations with data from dual-energy X-ray absorptiometry(Reference Yamada, Nishizawa and Uchiyama12). Grip strength was measured using a digital hand dynamometer (Grip-D, TKK-5401; Takei Scientific Instruments). Measurements were taken twice for each hand in the standing position, and the maximum value was used.
Sarcopenia
The presence or absence of sarcopenia at follow-up was estimated based on adjusted ALM (ALM/(height)2) and grip strength, according to the diagnostic criteria of the Asian Working Group for Sarcopenia 2019 (AWGS 2019)(Reference Chen, Woo and Assantachai13). AWGS 2019 criteria, using data from Japanese populations, showed that the prevalence of sarcopenia is low, particularly in women, which may be related to the generally lower BMI and leaner body composition observed in Japanese populations(Reference Yamada, Yamada and Yoshida14). Therefore, the 20th percentile of adjusted ALM was used as an alternative cut-off(Reference Yamada, Yamada and Yoshida14). Based on this approach, cut-off values for sarcopenia in this study were set at adjusted ALM < 7·0 kg/m2 for men and < 6·1 kg/m2 for women, while cut-off values for grip strength were < 28 kg for men and < 18 kg for women. Sarcopenia was not assessed at baseline.
Statistical analysis
Statistical analysis was performed using SAS software (version 9.4, SAS Institute Inc.). Multiple imputation was performed under the assumption that data were missing at random. Missing data were handled using multiple imputation performed with the PROC MI procedure in SAS (NIMPUTE = 3). The imputation model included sex, age, education, marital status, occupation, log-transformed BMI, log-transformed energy intake, energy-adjusted protein intake, total PA, smoking status, alcohol consumption and histories of stroke and diabetes. Statistical analyses were conducted separately for each imputed dataset, and the resulting parameter estimates were pooled according to Rubin’s rules using PROC MIANALYZE. Continuous variables related to participant characteristics are expressed as medians and interquartile ranges according to BMI levels. The P for trend values showing linear associations between participant characteristics and BMI levels in Table 1 were obtained using ordinal logistic regression analysis. Energy intake was log-transformed when conducting all statistical tests. OR for sarcopenia occurrence by BMI levels (reference group: overweight/obese group) were calculated using unadjusted and multivariable-adjusted logistic regression analyses. Covariates in the multivariable-adjusted model included sex, age, marital status (dummy variable), education level, occupation (dummy variable), total PA, log-transformed energy intake, energy-adjusted protein intake, smoking status, alcohol consumption and histories of stroke and diabetes. As subgroup analyses, similar multivariable logistic regression analyses were performed by sex, age (< 68 v. ≥ 68 years, median of participants with sarcopenia), total PA (< median v. ≥ median of all participants), energy intake (< median v. ≥ median by sex), smoking status (current non-smokers v. smokers) and alcohol consumption (current non-drinkers v. drinkers). The interaction cross-term between log-transformed BMI and these variables on sarcopenia was evaluated by P for interaction in the multivariable-adjusted model. To evaluate the robustness of the results, sensitivity analyses were conducted using complete-case data (without imputation), using the original AWGS 2019 definition of sarcopenia, and inverse-probability weighting to account for potential selection bias due to loss to follow-up. Participation probabilities for the weighting were estimated from baseline covariates using logistic regression. P < 0·05 was considered statistically significant.
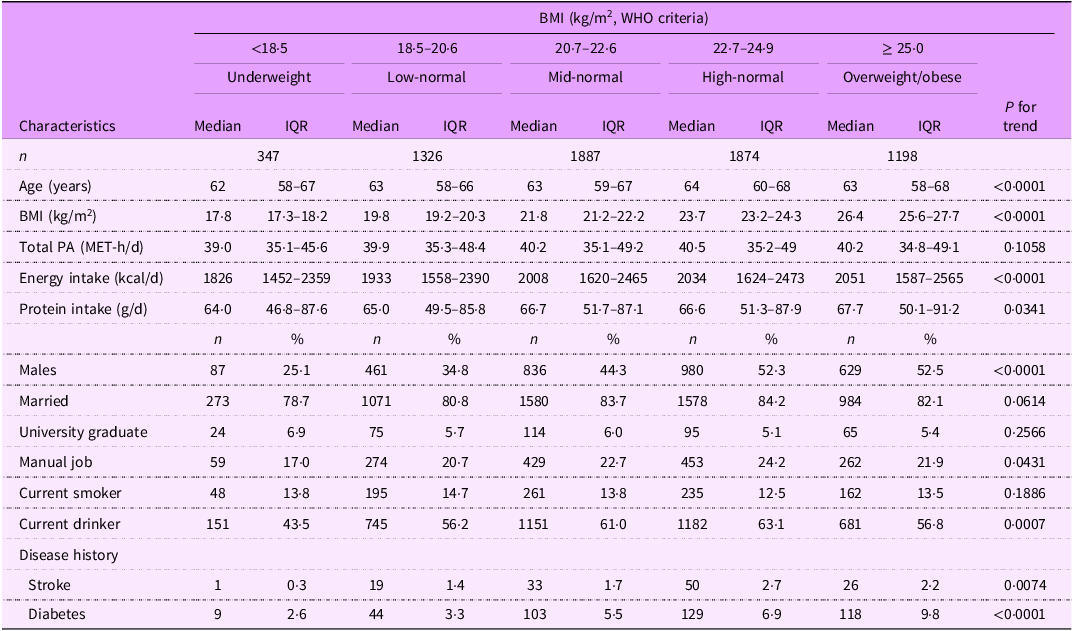
Participant characteristics according to BMI levels at baseline

Table 1. Long description
The table presents participant characteristics according to BMI levels at baseline. It has 16 rows and 11 columns. The columns are labeled as follows: Characteristics, BMI (kg/m^2) with subcategories Underweight (< 18.5), Low-normal (18.5-20.6), Mid-normal (20.7-22.6), High-normal (22.7-24.9), Overweight/obese (≥ 25.0), and P for trend. The rows are labeled as follows: n, Age (years), BMI (kg/m^2), Total PA (MET-h/d), Energy intake (kcal/d), Protein intake (g/d), Males, Married, University graduate, Manual job, Current smoker, Current drinker, Disease history (Stroke, Diabetes). Each row provides median and interquartile range (IQR) values for each BMI category. Notable trends include increasing age, BMI, energy intake, and protein intake with higher BMI categories. The percentage of males, married individuals, and current drinkers also increases with higher BMI categories. The percentage of university graduates and those with manual jobs decreases with higher BMI categories. The prevalence of stroke and diabetes increases with higher BMI categories.
PA, physical activity; MET, metabolic equivalent.
Values are presented as median with interquartile range or number with percent.
P for trend was calculated using ordinal logistic regression analysis.
Results
The mean age at baseline and mean follow-up period were 62·4 years (sd = 7·1) and 9·1 years (sd = 1·6), respectively. Participant characteristics according to BMI levels are presented in Table 1. Higher BMI levels were positively associated with age, energy intake, protein intake and proportions of males, university graduates, individuals with a history of stroke and individuals with a history of diabetes and were inversely associated with the proportion of current drinkers. Detailed participant characteristics according to BMI levels by sex are presented in online supplementary material, Supplemental Table 3. The occurrence of sarcopenia among participants in their 40s at baseline was 1/422 (0·2 %), 20/1479 (1·4 %) for those in their 50s, 132/3621 (3·7 %) for those in their 60s and 117/1110 (10·5 %) for those in their 70s. Participant characteristics according to physical examination results are shown in online supplementary material, Supplemental Table 4.
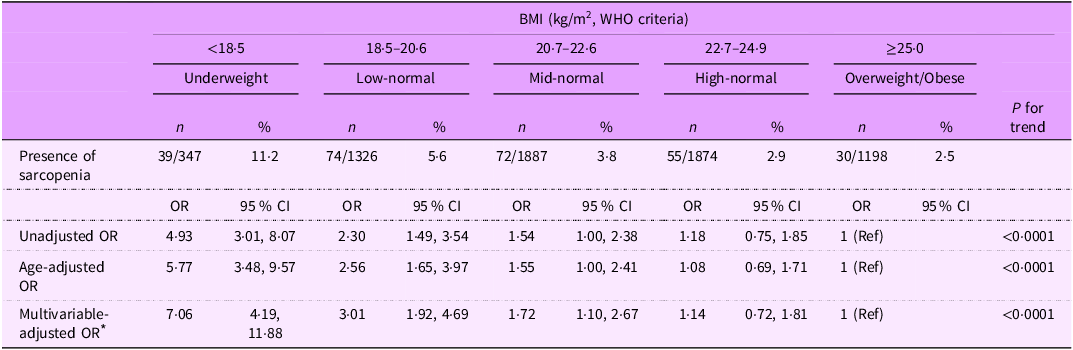
OR for sarcopenia according to BMI levels are shown in Table 2. In the unadjusted and age-adjusted models, ORs for sarcopenia were higher with lower BMI levels compared to the obese/overweight level. In the multivariable logistic regression model, these associations remained significant (multivariable-adjusted P for trend < 0·0001), with underweight (OR = 7·06), low-normal (OR = 3·01) and mid-normal (OR = 1·72) groups showing significantly higher OR than the overweight/obese group (reference). The multivariable-adjusted OR for 1 kg/m2 decrease in BMI was calculated to be 1·26 (95 % CI: 1·19, 1·33). Sensitivity analyses for the association between BMI levels and the presence of sarcopenia using complete-case data, using the original diagnostic criteria of AWGS 2019, and inverse-probability weighting are shown in online supplementary material, Supplemental Table 5. The pattern of these associations was similar to that in Table 2.
OR for the presence of sarcopenia at follow-up according to BMI levels at baseline

Table 2. Long description
A table comparing the presence of sarcopenia across different BMI levels. The table has 4 rows and 7 columns. The columns are labeled as BMI (kg/m2, WHO criteria), Underweight, Low-normal, Mid-normal, High-normal, Overweight/Obese, and P for trend. The rows are labeled as Presence of sarcopenia, Unadjusted OR, Age-adjusted OR, and Multivariable-adjusted OR. The BMI categories are < 18.5, 18.5-20.6, 20.7-22.6, 22.7-24.9, and ≥ 25.0. The table provides the number of cases (n), percentage (%), and odds ratios (OR) with 95% confidence intervals (CI) for each BMI category. The presence of sarcopenia is highest in the underweight category (11.2%) and lowest in the overweight/obese category (2.5%). The odds ratios decrease as BMI increases, with the underweight category having the highest unadjusted OR (4.93) and the overweight/obese category serving as the reference (OR 1). The trend remains significant in the age-adjusted and multivariable-adjusted models.
Unadjusted, age-adjusted and multivariable-adjusted OR per 1 kg/m2 decrease of BMI were calculated to be 1·20 (95 % CI: 1·14, 1·26), 1·23 (95 % CI: 1·17, 1·30) and 1·26 (95 % CI: 1·19, 1·33), respectively.
* Adjusted for sex, age, marital status, education level, occupation, total physical activity level, energy intake, protein intake, smoking status, alcohol consumption and disease history.
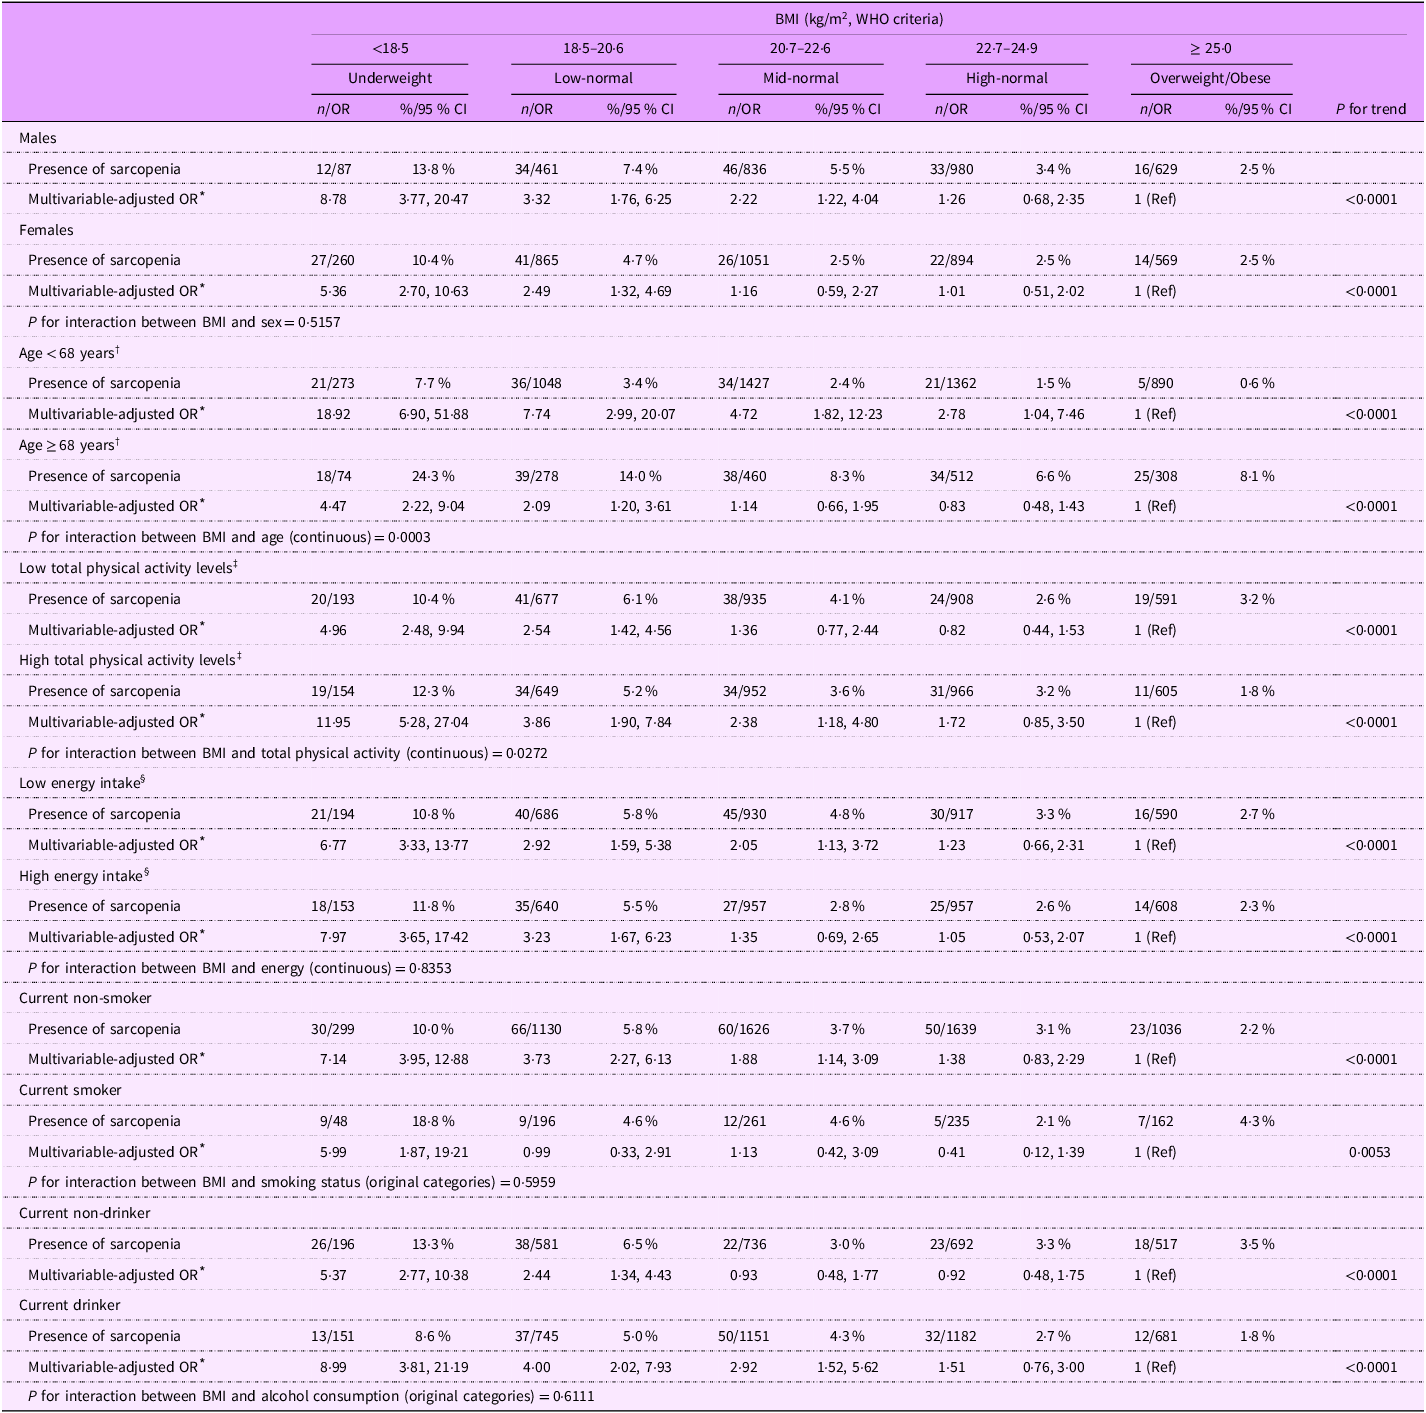
OR for sarcopenia according to BMI levels stratified by sex, age (< 68 v. ≥ 68 years), total PA (< median v. ≥ median), energy intake (< median v. ≥ median), smoking status (current non-smokers v. smokers) and alcohol consumption (current non-drinkers v. drinkers) are shown in Table 3. There was a significant inverse association between BMI and the OR for sarcopenia across all strata. There were interactions between BMI and age (continuous) (P for interaction = 0·0003) and interactions between BMI and total PA levels (continuous) (P for interaction = 0·0272). The predicted probabilities of sarcopenia across BMI levels are presented in online supplementary material, Supplemental Figure 1(a) and (b). Specifically, the OR of underweight for sarcopenia compared to obese/overweight was significantly higher in participants aged < 68 years and in those with high total PA levels compared to each counterpart. No interactions were observed for the other assessed variables.
Subgroup analyses of OR for the presence of sarcopenia at follow-up according to BMI levels at baseline

Table 3. Long description
A table comparing the odds ratios (OR) for the presence of sarcopenia at follow-up according to BMI levels at baseline, stratified by sex, age, total physical activity (PA), energy intake, smoking status, and alcohol consumption. The table has 25 rows and 13 columns. Column headers include BMI categories (< 18.5, 18.5-20.6, 20.7-22.6, 22.7-24.9, ≥ 25.0), and subcategories for males, females, age groups (< 68 years, ≥ 68 years), total PA levels (low, high), energy intake (low, high), smoking status (current non-smoker, current smoker), and alcohol consumption (current non-drinker, current drinker). Row labels include presence of sarcopenia, multivariable-adjusted OR, and P values for trend. Each cell contains the number of cases, percentage, OR, and 95 percent confidence interval (CI). Notable trends include higher odds ratios for sarcopenia in underweight individuals across all strata, with significant interactions between BMI and age, and BMI and total PA levels. The table highlights the inverse association between BMI and the odds of sarcopenia across all examined variables.
MET, metabolic equivalent.
* Adjusted for sex, age, marital status, education level, occupation, total physical activity level, energy intake, protein intake, smoking status, alcohol consumption and disease history.
† Median in sarcopenia-diagnosed participants.
‡ Lower or higher than the median of 40·1 MET-h/d in all participants.
§ Lower or higher than the median of 2154 kcal/d for male participants and 1860 kcal/d for female participants.
Sensitivity analyses for the association between BMI levels and the presence of sarcopenia stratified by age and PA, using the original diagnostic criteria of AWGS 2019 and inverse-probability weighting, are shown in online supplementary material, Supplemental Table 6. The pattern of these associations and interactions was similar to that in Table 3.
Discussion
This 9-year follow-up study found a robust association between lower BMI and an increased odds of sarcopenia in community-dwelling middle-aged and older adults. We also identified significant effect modifiers (age and PA levels) of this association. Specifically, the odds of sarcopenia among underweight individuals were higher in younger participants and those with high PA levels (≥ 40·1 MET-h/d) compared with their respective counterparts.
The observed inverse dose-dependent relationship is consistent with that reported in previous studies(Reference Gao, Huang and An4). Nonetheless, to the best of our knowledge, the present study is the first to identify significant effect modifiers of the association between BMI and the odds of sarcopenia and also had the largest population of middle-aged and older adults with the longest follow-up period(Reference Gao, Huang and An4).
The present study identified a significant interaction between BMI and age. Notably, the overall occurrence of sarcopenia was substantially lower in middle-aged individuals than in older individuals (2·3 % in those aged < 68 years and 9·4 % in those aged ≥ 68 years; data not shown). Accordingly, the extremely high odds observed with low BMI levels, particularly in underweight individuals, are noteworthy. Middle age represents the stage following the attainment of maximal muscle mass in young adulthood(Reference Janssen, Heymsfield and Wang15). In addition, fat mass in young and middle age serves as an important mechanical load that triggers anabolic responses which promote muscle growth and function, particularly at younger ages(Reference Cooper, Tomlinson and Hamer16). Therefore, being underweight during the middle-age period may reflect inadequate muscle mass accumulation.
The association between low BMI and sarcopenia was particularly strong among participants with high total PA levels (OR = 11·95 for underweight) compared to those with low PA levels (OR = 4·96 for underweight). This suggests that maintaining high PA levels while having low BMI markedly increases the odds of sarcopenia. In the field of sports medicine, low levels of energy availability, defined as dietary intake minus exercise energy expenditure normalised to fat-free mass, is known to result in loss of muscle mass(Reference Thoms, Erdman and Burke17). The present findings may also be explained by a similar mechanism, that is, individuals with low BMI and high PA levels may fail to consume adequate amounts of energy to maintain muscle mass. Since no population-based epidemiological study has reported findings similar to those of the present study, further investigation is warranted.
In the present study, older individuals (≥ 60 years), women and those with a normal BMI were more likely to participate in the follow-up physical examination (see online supplementary material, Supplemental Table 1). This suggests that individuals with greater health awareness may have been more likely to participate in the follow-up examination than their counterparts, potentially reducing the representativeness of the study population. To assess the impact of this potential selection bias, we conducted an inverse-probability weighting analysis. The OR for sarcopenia in the lowest BMI group (< 18·5 kg/m2) was slightly higher in the weighted analysis (OR = 8·45) than in the main analysis (OR = 7·06), suggesting that the association may have been slightly underestimated due to selective participation.
A strength of this study is that it is the first to reveal a clear interaction between BMI and demographic/lifestyle factors in relation to sarcopenia based on data from a large cohort with a 9-year follow-up. However, this study also has several limitations. First, as sarcopenia was not assessed at baseline, the initial sarcopenia status of participants was unknown. Therefore, some participants may already have had sarcopenia at baseline, which could have adversely affected the ability to assess the causal relationship between BMI and sarcopenia. Second, lifestyle factors were assessed by self-report, which may have led to misclassification of variables and an underestimation of OR. Third, the estimation of muscle mass by bioelectrical impedance analysis is influenced by individual hydration and electrolyte status(Reference Saunders, Blevins and Broeder18), which may have introduced error into the estimation of ALM and affected the diagnosis of sarcopenia. Finally, because participants were residents of small- to medium-sized municipalities, the findings may not be generalisable to populations in large municipalities or metropolitan areas, where lifestyles may differ.
In the present study, low BMI, particularly underweight in middle-aged adults, was identified as a high-risk factor for sarcopenia, highlighting the importance of addressing underweight status. Because BMI tends to track across the life course(Reference Aarestrup, Bjerregaard and Gamborg19), avoiding underweight in young adulthood, especially intentional thinness, should be considered a meaningful public health strategy. Moreover, our findings highlight the importance of both BMI and PA in sarcopenia. While regular PA is generally recommended for preventing chronic diseases, it is also important to implement strategies that combine maintaining an appropriate body weight with guidance on PA and exercise. Given that BMI is an easily obtainable indicator in community and clinical settings, its potential interactions with other sarcopenia-related factors warrant further investigation.
Conclusions
In this 9-year prospective study of community-dwelling middle-aged and older adults, low BMI was found to be a crucial factor for sarcopenia, and this association was modified by age and PA level. Specifically, the adverse impact of being underweight on sarcopenia was greater among middle-aged individuals and those with high PA levels. These findings highlight the need for preventive interventions against sarcopenia among underweight individuals.
Supplementary material
For supplementary material accompanying this paper visit https://doi.org/10.1017/S1368980026103255
Acknowledgements
The authors thank Niigata Prefecture, Murakami City, Sekikawa Village, Awashimaura Village, Minamiuonuma City and Uonuma City for their valuable support in data collection. The investigators and their affiliations in the validation study of the self-administered FFQ in the JPHC-NEXT Study (the JPHC-NEXT FFQ Validation Study Group) at the time of the study were Tsugane S, Inoue M, Sasazuki S, Iwasaki M, Sawada N, Yamaji T, Shimazu T, Charvat H, Noda A, Hara A, Mishiro I, Ishii Y, Shinozawa Y and Umezawa J: National Cancer Center, Tokyo; Takahashi T: JA Hiraka General Hospital, Yokote; Ito Y: Akita Prefectural Yokote Public Health Center, Yokote; Kobayashi K: Nagano Prefectural Saku Public Health Center, Saku; Iso H: Osaka University, Suita; Ishihara J: Sagami Women’s University, Sagamihara; Chikusei City and Ibaraki Prefectural Chikusei Public Health Center, Chikusei; Nakamura K, Tanaka J, Kitamura K and Takachi R: Niigata University, Niigata.
Author contributions
The authors’ responsibilities were as follows – N.C., K.Ka. and K.N.: design; N.C.: statistical analysis; T.K., K.Ka., K.Ki., Y.W., Y.I., A.T., T.S., J.T. and K.N.: investigation; N.C., K.Ka. and K.N.: writing; K.W., R.T., S.T. and S.Y.: review; K.Ka. and K.N.: the primary responsibility for the final content; and all authors read and approved the final manuscript.
Financial support
This work was supported by JSPS KAKENHI Grants (grant numbers JP23249035 and JP23790708) and the National Cancer Center Research and Development Fund (23-A31(toku) (since 2010)). The funders had no role in the study design, data collection and analysis, decision to publish or preparation of the manuscript.
Competing interests
The authors report no conflicts of interest.
Ethics of human subject participation
This study was conducted according to the guidelines laid down in the Declaration of Helsinki, and all procedures involving research study participants were approved by the Niigata University Ethics Committee (Nos. 2019-0376, 2019-0409 and 2022-0240). Written informed consent was obtained from all participants.


 Open access

