For decades economic historians have debated when Latin America fell behind other countries and the causes of this economic backwardness.Footnote 1 The debate has been limited by the scarcity of good data.Footnote 2 Information on the formation of physical capital and machinery, in particular, has been limited. As a result, the classical economists' view that capital accumulation has been a key source of long-term economic growth has not been fully explored. To help rectify this problem, I develop annual series for imports of machinery into all Latin American countries between 1890 and 1930. Since domestic production of machinery was extremely limited during this period, the data offer the opportunity to study Latin American machinery expenditures during the height of the first globalization and to learn a great deal about many smaller countries that have not been studied in depth before.Footnote 3
Study of machinery investment has a long history in studies of economic growth. Classical economists regarded capital accumulation as the prime source of growth. In the early 1960s, however, neoclassical macroeconomic growth accounting exercises found that physical capital accumulation explained a very small part of the increase in economic growth.Footnote 4 The dominant explanation appeared to be growth in total factor productivity—the famous residual in Solow's model. The new economic growth theory of the 1980s argued further that economic growth was largely derived from human capital formation and expansions in research and development and innovation.Footnote 5 There has been a more recent shift toward greater emphasis on physical capital formation after Bradford De Long, and De Long and Lawrence Summers found a strong causal relation between investment in equipment and long-term economic growth in broad samples of developed and developing economies between 1960 and 1985 and between 1870 and 1980.Footnote 6 Investment in machinery creates external benefits by stimulating the development of new innovations and other social benefits, particularly in countries going through their first industrialization. Indeed, the causal link between investment in equipment goods and growth has been more powerful in semi-industrialized economies.Footnote 7
The work performed here adds to series constructed for other time periods and for some larger Latin American countries. In the 1950s and in the early 1960s, the Economic Commission for Latin America and the Caribbean (ECLAC) undertook a series of studies of the process of physical capital accumulation and its determining factors for some countries after 1925. André Hofman developed estimates of capital accumulation and examined its role in economic growth for six economies: Argentina, Brazil, Chile, Colombia, Mexico, and Venezuela starting around 1900.Footnote 8 While these six countries have received a great deal of attention, we know very little about the experiences in the other Latin American countries.Footnote 9
The data I construct for machinery imports per capita allows scholars to expand their analysis to all of Latin America. The article explains the methods and sources used. Description of the problems stemming from the deficiencies and limitations of the sources, as well as the description of the procedures used to overcome them are detailed in the Appendix.
Four major implications can be derived from analysis of the series: (1) Latin American nations made significant economic progress through the accumulation of productive capital; (2) growth in machinery imports per capita was very unstable; (3) capital investment varied widely across Latin American countries, so that the diversity of experiences was equally or even more important than common trends within the region; and (4) after a period of divergence before 1914 which led to greater inequality across Latin America, half of the more backward economies made a great investment effort from World War I and began to catch up to the leading countries.
DATA AND METHODOLOGY
To measure machinery imports, I use the System of National Accounts (SNA) established by the United Nations as a guide.Footnote 10 The goods counted are those contained in the category of machinery and other equipment goods—category AN.11132 in the United Nations' classification—as well as tools—category 10.63. The estimates therefore do not include, among others, transport equipment or any type of buildings or structures, such as civil engineering constructions and works (roads, bridges, railways, etc.). They do include expenditures on the acquisition of machinery and tools and their parts, pieces, and accessories, either for general or for specific uses (agricultural, mining, manufacturing, office equipment); machinery and electrical equipment; communication equipment and apparatus; engines and pumps, as well as other apparatus used as the means of production of all types of goods.Footnote 11
We are far from having at our disposal the minimum information necessary to be able to carry out a direct estimation. Very few countries in the region undertook industrial censuses during the period. The countries performing censuses did not do so in a regular fashion. The activity of domestic industries dedicated to the production, installation or repair of machinery and tools was not registered, or they barely left a trace in statistical publications of the Latin American republics.
Specialists have been aware of these insurmountable limitations for a long time and have resorted to an indirect means of measuring capital formation in machinery. Most Latin American historians agree that virtually all the machinery used to equip Latin America was acquired abroad. All the available evidence to date suggests that domestic production in most countries, with Chile as a possible exception, was not relevant enough to alter the profile of the series of investment in machinery that can be deduced from imports.Footnote 12 Hence, scholars have constructed machinery series using import data and/or exports from the main supplier countries.Footnote 13
I follow the same procedures to expand the coverage of Latin America to 20 countries. The estimates are based on the systematic use of annual official foreign trade statistics (FTS hereafter) of the three countries that supplied by far the largest share of machinery to Latin America: Germany, the United Kingdom, and the United States (G-3 hereafter). In the years 1913 and 1925, when official import statistics are available for most Latin American countries, the G-3 countries accounted for an overwhelming share of imported machinery in every country. As seen in Table 1, the G-3 share of machinery imports in 1913 ranged from 83.2 percent in Brazil to 96.7 percent in El Salvador. In 1925, when G-3 shares are available for 15 countries, the shares ranged from 77.7 percent in Bolivia to 98.1 percent in Guatemala.
The use of the FTS of the G-3 as a source of evaluation of Latin American imports has three great advantages. The data are collected in a consistent fashion by the G-3 countries throughout most of the period, all Latin American countries are covered, and annual data are available for most years.
There are limitations, however. In some cases, the exports are not allocated to the true destination country of exports. Although some specialists have criticized the value of the FTS in this sense, we must not exaggerate the problem.Footnote 14 Comparisons of the figures for equipment
PERCENTAGE OF LATIN AMERICAN IMPORTS OF MACHINERY IMPORTED FROM THE UNITED STATES, THE UNITED KINGDOM, AND GERMANY IN 1913 AND 1925

* The Latin American countries for which official importation statistics are available for 1913.
** The Latin American countries for which official importation statistics are available for 1925.
Source:
Derived from the sources cited in Tafunell and Carreras, “América Latina.”
goods registered in the FTS of the G-3 and the Latin American countries for the year 1925 show that the differences are not significant.Footnote 15 It is likely true that in 1913 the discrepancies were greater. Some would have stemmed from the “statistical disappearance” of part of the trade of the smallest importer countries in the FTS of the G-3. Some might have come from mistakes made in the allocation of the destination of exports. Nonetheless, it is generally accepted that the quality of the G-3 information prior to the First World War is higher than the quality of the import statistics in Latin America.Footnote 16 I have explored using information from the Latin American countries to supplement the G-3's statistics. However, in the most problematic cases the information from the importer countries is not available.
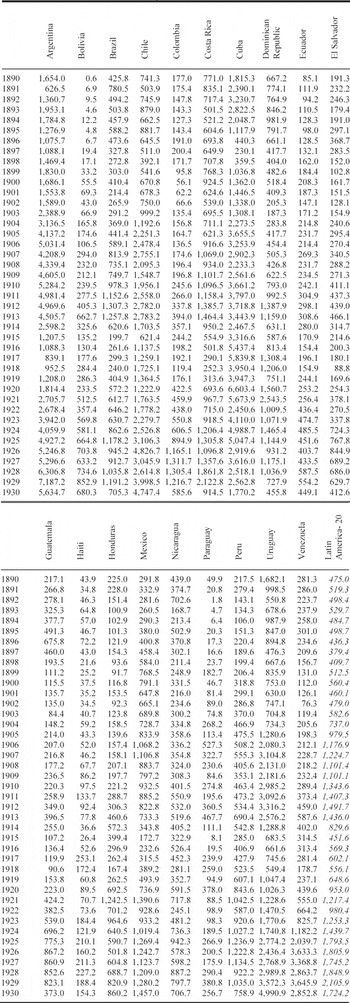
The FTS of the G-3 have some shortcomings which complicate the calculation of the magnitudes of the machinery imported by Latin America. The Appendix details these shortcomings and describes the methods used to overcome them to obtain the magnitudes of the machinery exported for every one of the members of the G-3. With these magnitudes at our disposal, the estimates of machinery equipment are calculated by summing the figures for exports from Germany, the United States and the United Kingdom to each Latin American country. The G-3 totals are then adjusted using the information on the G-3 shares of imports in Table 1 to come up with a total figure for imports of machinery per capita in Table 2.
The machinery measure is in values because the United States and Britain reported only the value of machinery and not units exported for most items. To put the values on a comparable basis, I converted the values for Germany and Britain into U.S. dollars using the exchange rates of the period recommended by Lawrence Officer, who compiled them for the Historical Statistics of the United States.Footnote 17
The information in Table 1 on the imports from the G-3 as a share of total imports is then used to get an estimate of the total machinery imports into each country. For the period 1890 to 1913, I used the percentage of imports from the G-3 in the second-to-last column in Table 1 in the calculation. For example, Argentina imported 83.3 percent of its machinery from the G-3. Therefore, the total value of machinery imports is equal to the value of exports in the G-3 divided by 0.833. For the period from 1914 to 1930, I assumed that the 1925 values in the last column of Table 1 were the percentages throughout the period for each country. Argentina's figure of 83.8 percent meant that the total machinery imports would have been the G-3 exports divided by 0.838. In most countries, the import shares from the G-3 in Table 1 were similar in 1913 and 1925. In the cases where a value is not reported in Table 1 for a country, the notes to Table 2 show which country or group of countries were used to extrapolate an estimate of the G-3 share. The range of the extrapolation coefficients is between 1.019 and 1.287, with the arithmetic average at 1.112 and the median at 1.084.
VALUE OF PER CAPITA MACHINERY IMPORTS EXPENDITURE IN LATIN AMERICAN COUNTRIES 1890-1930 (1913 USD per 1,000 inhabitants)*

*Machinery is valued at FOB pricing.
Notes:
The figures in the table are the result of an extrapolation based on the information indicated in Table 1 (see the text). Below I indicate the options chosen in cases when it has not been possible to extract the extrapolation coefficients for 1913 and/or 1925 when there was not access to the official imports statistics: Bolivia and Colombia: for the whole period the extrapolation coefficient of 1925. The Dominican Republic and Haiti: for 1890-1913 the coefficient corresponds to Cuba. Ecuador: for 1890-1913 the coefficient of the sum total of countries of the region for which we have information. Guatemala and Nicaragua: for 1890-1913 the average extrapolation coefficient of Costa Rica, El Salvador, and Mexico. Honduras and Panama: for 1890-1913 the same as Guatemala and Nicaragua; for 1914-1930 the average extrapolation coefficient of Costa Rica, El Salvador, Guatemala, and Nicaragua. Paraguay: the coefficient corresponds to Bolivia. Uruguay and Venezuela: for both 1890-1913 and 1914-1925 the respective extrapolation coefficients of the sum total of countries in the region for which we have information.
Sources:
The population information comes from Maddison, Statistics on World Population (http://www.ggdc.net/maddison). In the cases in which Maddison does not provide annual information for 1890-1899, I have taken the population data of 1890 from Bulmer-Thomas, Economic History, p. 412; the values of the remaining years have been calculated using exponential extrapolation.
The final step requires the deflation of the dollar values. As a deflator I have used the price indexes of equipment goods drawn up by Charles Feinstein with 1913 as a base for the United Kingdom.Footnote 18 Obviously, it would have been preferable to deflate every national series by a price index representative of the machinery of the respective country. However, Feinstein's series is more complete than any series currently available for Germany and the United States during this period.
How reliable are the estimates? It is possible to make comparisons with estimates of machinery plus transport equipment compiled by Hofman for Argentina, Brazil, Chile, Colombia, Mexico and Venezuela in the 1900-1930 period. In another paper I have quantified the investment in transport equipment with the same territorial and time coverage as this paper and using the same methodology. After adding my series on transport equipment to the machinery series reported here, I have run correlations with Hofman's series for those countries. The correlation coefficients are 0.890 for Argentina, 0.961 for Brazil, 0.786 for Chile, 0.936 for Colombia, and 0.991 for Venezuela.Footnote 19
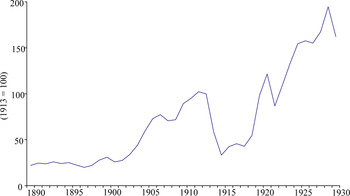
LATIN AMERICAN MACHINERY IMPORTS, 1890-1930 (1913 USD)

MACHINERY IMPORTS IN ALL OF LATIN AMERICA
The creation of the machinery series offers a unique opportunity to examine all of Latin America during the first era of globalization and the fluctuations associated with World War I and the 1920s. The machinery expenditures shown in Figure 1 went through a long-term expansion between 1890 and 1930, despite stagnation in the first decade and the dramatic drop suffered during World War I. Machinery imports grew more rapidly than other measures of economic activity in Latin America. For example, in a group of eight large Latin American countries, machinery imports over the period grew approximately 5.8 percent, while GDP grew only 3.4 percent. Further, the growth rate of 5.4 percent for all of Latin America from 1890 to 1930 exceeded the average annual rate of capital formation in equipment goods of 4.9 percent that occurred during the “golden age” of Latin American growth between 1950 and 1990.
Latin American machinery imports experienced a great deal of volatility, as well. Latin American economies were dependent on the more industrialized countries for their demand for Latin American exports. Further, they were exposed to intense fluctuations in the foreign supply of machinery, the availability of international means of payment, and internal money supply.Footnote 20 The 1890s were a period of total stagnation with virtually no growth in machinery imports between 1890 and 1898. Initially, investor sluggishness was a reaction to the Baring Crisis, but the depression continued due to a sharp drop in the prices of Latin American export products. Footnote 21
At the start of the new century, the Belle Époque arrived in Latin America. Between 1900 and 1913 machinery imports increased at an astonishing annual rate of 12 percent, despite the marked instability created by the crises of 1901 and 1907. World War I then triggered a collapse of investment in Latin America, as the level of capital formation in Latin America fell nearly 60 percent between 1913 and 1918.
After the Armistice, European industry and international markets did not regain normality until 1920. The traditional story suggests that Latin American demand for machinery rose sharply to make up for the lack of machinery available during the war and because they were flush with gold from running trade surpluses. Therefore, imports of machinery rebounded to prewar levels in 1920 and 1921, suffered a strong setback due to the postwar crisis, and then followed an upward trend of roughly 10 percent per year until 1929.
NATIONAL DIVERSITY
Latin America was and continues to be a diverse collection of economies. The most obvious differences arise in the size of the economies. Argentina and Brazil alone account for 47.6 percent of total machinery imports during the period. Adding Mexico raises the share to 63.1 percent and including Cuba raises the share of the top four to 73.6 percent. The bottom ten countries account for only 4.9 percent of the total.
The diversity of the economies are not simple products of physical size or geography. Per capita income and wealth levels displayed a large range between Argentina, near the top among all countries worldwide, to the extremely poor countries. The new series created in Table 2 for the annual value of machinery per capita imported offers one of the few means of ranking Latin American countries circa 1900 using a major measure of economic development.
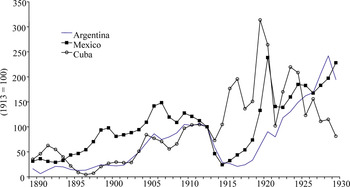
MACHINERY IMPORTS OF ARGENTINA, CUBA, AND MEXICO, 1890-1930 (1913 USD)

The table is full of elements of great interest and it holds several surprises. Many know that Argentina and Uruguay ranked among the countries with the highest income per capita in the world. Few know, however, that Cuba often rivaled those two countries in its imports of machinery per capita. Surprisingly, Chile ranks ahead of Uruguay in machinery imports per capita, when estimates of GDP per capita rank them the opposite way. The remaining 16 countries are below the Latin American average. It should not seem strange that Costa Rica is at the average, given its precocious economic development. That investment per capita of Mexico was one step below, just behind the Dominican Republic, indicates that the volume of capital formation in machinery did not always depend on the presence or importance of the industrial, resource extraction, or manufacturing sectors. Mexico was nearly matched by Venezuela, as it moved late but rapidly from agriculture into petroleum production. Brazil and Peru lie well below the mean, while Colombia and many of the small economies were at levels below half the Latin American average.
Comparisons of the longer-term movements show that a number of countries followed similar longer-term paths. For example, Argentina followed a pattern in Figure 2 followed by many Latin American countries. Its expenditures on machinery per capita peaked circa 1910-1913, fell markedly during World War I, and then rose to a new peak in 1929 that exceeded the 1910 peak by 42 percent. In the debate over whether Argentina's demise as a leading export country began in 1913 or 1929, this timing seems most consistent with its drop beginning after 1929.Footnote 22
Mexico also experienced a similar path between 1911 and 1929 in Figure 2, although one influenced by the Mexican Revolution of 1910. Historians traditionally have insisted that Mexico was dramatically marked by the revolution, but the recent literature asserts that the revolution endowed the Mexican economy with great dynamism in the 1920s.Footnote 23 Comparisons of the machinery import series for Mexico and the rest of Latin America raise question for both interpretations. Mexico's machinery imports declined 22 percent during its civil war from 1911 to 1913. Stephen Haber describes a relaunch of Mexican manufacturing investment after the end of the civil war, while the data here show a decline in Mexican machinery imports through the end of World War I. However, the decline in Mexico was less than in other Latin American countries, such as Argentina. Haber, Armando Razo, and Noel Maurer, argue that Mexico grew unusually rapidly after World War I due to the new institutional order established by the civil war, but the series here show Mexican machinery imports grew no faster than in many other Latin American countries.Footnote 24
Despite broad similarities in growth, annual fluctuations show that the countries did not move together in lockstep. Only in 1904 and 1920 did investment move in the same direction in all 20 countries. In fact, there are very frequently movements in opposite directions. The experience shown for Cuba in Figure 2 is a prime example. While the rest of Latin America reduced its machinery imports during World War I, Cuba's imports in 1917 reached a peak that exceeded its prior 1911 peak by 54 percent. In the latter half of the 1920s, Cuba's expenditures declined by nearly two-thirds, while most of the machinery imports in the rest of Latin America were stable or expanded.
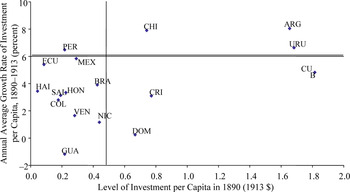
ANNUAL AVERAGE GROWTH RATES IN MACHINERY IMPORTS, 1890-1913 AND MACHINERY IMPORTS PER CAPITA IN 1890

WAS THERE INVESTMENT DIVERGENCE?
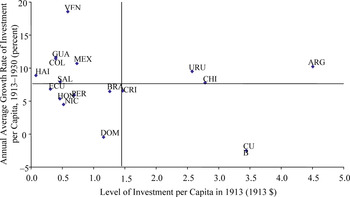
One of the central questions in the debate about Latin America's backwardness is whether there was convergence among the economies of the region.Footnote 25 We can gain a rough sense of the extent of convergence by plotting the relationship between the prior levels of machinery imports at the beginning of a period and the growth rates that followed in Figures 3 and 4. The horizontal line in each figure represents the population-weighted average growth rate of machinery imports for Latin American countries while the vertical line shows the population-weighted per capita level of machinery imports at the start of the period. Figure 3 shows that the gap separating the less capitalized economies from the more capitalized ones tended to widen between 1890 and 1913. Except for Peru, nations with a low level of investment in 1890 increased their per capita imports of machinery at lower rates than the regional population-weighted average for all Latin America, as
ANNUAL AVERAGE GROWTH RATES IN MACHINERY IMPORTS, 1913-1930 AND MACHINERY IMPORTS PER CAPITA IN 1913

shown by their location in the lower left portion of the figure. The Dominican Republic, Costa Rica, and Cuba also experienced growth rates that were lower than the overall regional average. Of these, Cuba merits a mention, since at the beginning of the period studied it had the highest level of per capita expenditure on machinery. In the top right quadrant with relatively high initial levels and a strong growth rate, we find only Argentina, Chile, and Uruguay. This fits with the emphasis in the prior literature that only these three countries embody real success stories in economic growth in the era of globalization before the World War.Footnote 26
The World War changed the previous patterns of growth due to the great disruption of maritime traffic caused by war operations. After the war, there was a more protectionist trade environment and the demand for primary products was influenced by changes in technology and demand. All of this is expressed in the more complex picture of the relative evolution of machinery imports in Figure 4. The most capitalized economies, Argentina, Uruguay, and Chile, remained in the upper right golden quadrant. Costa Rica and the Domincan Republic, which before had been incapable of rapidly expanding their machinery imports, continued to show little growth. Cuba was the only country to suffer a sharp drop in investment.Footnote 27
The paths of the more backward economies forked. Half developed at least as much and sometimes more than the more developed economies and thus jumped into the upper left quadrant. Venezuela and Colombia both benefited from the expansion in external demand for their petroleum. The other half, including Peru, the Dominican Republic, and Brazil, imported machinery at rates inferior to the Latin American average. In short, the divergence that had emerged in the heart of Latin America under the globalization prior to 1914 shrank to some degree afterward as a few backward countries began to catch up to the advanced ones.
CONCLUDING REMARKS
The new annual estimates of per capita machinery imports in Latin American countries for 1890 to 1930 span the end of the first phase of globalization, World War I, and the expansion of the 1920s. They provide a quantitative basis for comparisons across all Latin American countries at any point in time and for each country across time.
We can draw several conclusions from an initial analysis of the series. Despite a depression in the 1890s and a large drop in machinery imports during World War I, imports of machinery into Latin America grew at a rapid average annual rate of 5.4 percent between 1890 and 1930. The key periods of growth were the Belle Époque during the period from 1900 through 1913 and the expansions in the 1920s. Although there were some broad common trends, there was as much diversity in the experiences across countries as there was commonality. Argentina, Brazil, Chile, Cuba, and Mexico together accounted for over 80 percent of the machinery imports. The dispersion of machinery imports fluctuated year to year, and the greatest dispersion occurred during World War I. Countries that relied on the United States for machinery imports or that produced sugar fared reasonably well, while countries relying on Europe saw a sharp drop in machinery imports from Britain and Germany.
The Latin American history literature has defended the idea that the first globalization widened the gap between the richest and poorest nations in the region. The evidence on machinery imports supports this pessimistic view of the period before the World War. All of the economies with a low level of initial investment, except Peru, increased their machinery endowment per capita at rates that were inferior to the regional average. The situation is ambiguous for the period between World War I and the Great Depression. The most developed economies maintained their previous investment pattern, while half of the most backward economies grew faster or at least maintained a similar pace of investment.
Appendix
This appendix discusses the difficulties posed by the FTS of the G-3 for the calculation of machinery exported by the G-3 to Latin America, as well as the procedures I have used to carry out this calculation.Footnote 28 For greater clarity, the criticism of the sources and the methodological description deal with each of the members of the G-3 separately.
Germany
The German FTS present a series of problems.Footnote 29 First, there were no annual statistics published between 1914 and 1919 due to World War I and the data for 1921 begin only in May. To deal with the gap, I have assumed that between January and July of 1914, Germany would have exported a volume of machinery to Latin America that was equivalent to half of the volume of 1913, whereas from August 1914 to December 1919 it would not have exported machinery at all.Footnote 30 I have also supposed that the export figures of 1921 can be derived by multiplying 1.5 by the export figures for May through December to replace data missing for the other third of the year due to a reorganization of the statistical services.Footnote 31
Second, the statistics from the years 1920, 1921, and 1922 record only the quantities exported, likely because of the German hyperinflation. To avoid using Germany's hyperinflated prices, I developed a quantity index for these three years. After converting the 1923 exports into constant marks, the real values for 1920 through 1922 were derived by applying the growth rates in the quantity indices to the 1923 value. This is reasonable as long as the relative prices of different types of machinery remained constant and the composition of the equipment exported remained unaltered.
Third, the territory to which the FTS of Germany refer is not the same before and after the World War, since Germany lost some regions during the war.
Fourth, the German FTS, like those of the United States, and in contrast to those of Britain, give information about the exports to all countries of every type of product registered in the customs tariffs. However, the German FTS combine product worth less than 5,000 marks (1,191 dollars at par value) into a miscellaneous category. This does not appear to be a serious problem because nearly all machinery values exceeded this threshold.
Fifth, the values are in thousands of marks, which lead to some imprecision for small aggregates and unitary values of specific products.
Sixth, there is a structural break in the statistics at March 1906 when a new tariff law caused the number of machinery categories to rise from 36 to 145. In practice, the change made it very difficult to match up the pre- and post-1906 classifications. However, the trend in estimated machinery exports from Germany between 1905 and 1906 looks similar to the trends seen in the U.S. and British data.Footnote 32 It does not appear that the 1906 rise in categories covered by the tariff actually added new types of machinery to the exports to Latin America.
Seventh, exports to Costa Rica, Guatemala, and the Dominican Republic did not appear individually until 1897. Exports to El Salvador, Honduras, and Nicaragua were grouped together as “Central America” until 1906. Statistics for Cuba and Puerto Rico are reported separately only after 1896.
The United States
The American FTS constitute a source of extraordinary quality with information about trade with all sovereign states and American colonial territories, however small the amount.Footnote 33 Goods are classified using rational economic criteria. Nevertheless, there still are some problems.
First, until 1917 the data are reported for fiscal years from July 1 of the previous year to June 30 of the current year. After that the data are reported for calendar years. For the period through 1917, the value for year t is calculated as half of the fiscal year value reported for year t+1 plus half of the fiscal year value reported for year t.
Second, only values, and not quantities, are reported for a considerable portion of the products registered in the customs tariffs. Thus, a quantity index can only be developed using a broad price measure.
The consistency of the U.S. statistics provides a service in that in several cases I use trends in the U.S. statistics to extrapolate missing information for Germany and the United Kingdom in situations where the United States represented most of the exports in the years that followed. When the data for estimation refer to very few years and there is a clear tendency in the following years, I have been inclined to extrapolate the tendency back into the past. Thus, I extrapolated exports from the United Kingdom to Guatemala backward for the years 1890/91. I did the same for exports from Germany to El Salvador for the years 1901-1905, to Guatemala for 1890-1896, to Honduras for 1906, and to Nicaragua in 1903-1905. Prior to these years indicated, German exports to these countries, except Guatemala, were likely close to zero.
The United Kingdom
The British statistics pose more problems than the German or American FTS for estimating the quantity of machinery exports to Latin American nations.Footnote 34 First, the FTS reports the value of export goods in pounds sterling, but on many occasions does not report quantities exported.
Second, until 1891 Costa Rica, El Salvador, Guatemala, Honduras, and Nicaragua are grouped under the same name “Central America.” The same occurs with Cuba and Puerto Rico while they are Spanish colonies. The statistics do not distinguish between Haiti and the Dominican Republic until 1912. Finally, exports to Bolivia are not registered until 1909 and exports to Paraguay have been registered only since 1920.Footnote 35
Third, for most countries in the region, there is only a figure for total machinery exports, which included neither electrical equipment nor tools. The only countries for which separate information on different types of machinery is reported are Argentina, Brazil, Chile, Mexico, and Uruguay. In the countries where breakdowns are reported, the classification of capital goods into the different categories changes over time with important changes taking place in 1909 and 1920.
The lack of information by category for the early years makes it difficult to be sure that we are working with a homogenous group of goods. For example, until 1919 steam locomotives were included in the machinery group. The quantification of sales of British machinery to Latin America requires that the value of locomotives be subtracted from machinery exports for the period prior to 1920. In those Latin American countries for which the United Kingdom's FTS give information, steam locomotives typically represented 24 percent of the value of machinery exported by the United Kingdom. When the FTS of the United Kingdom does not give breakdowns of export figures by machinery types, I have calculated the locomotive exports to that country as a linear function of the size of the railway network in the country.
I have had to estimate other products in order to reach a final figure for machinery exported by the United Kingdom. Going by the criteria of national accounts established by the United Nations, the desired aggregate of machinery consists of the sum of three categories of goods from the British FTS: machinery (excluding locomotives), implements and tools, and electrical goods and apparatus (other than machinery and telegraph and telephone wire). The British statistics always report data on the first category. Information on tools and implements is incomplete. I have filled in the gaps by calculating an arithmetic average of the ratio of the value of tools and implements to the value of machinery (excluding locomotives) for the countries with information that year and then multiplying it by the value of machinery without locomotives in the countries with missing information. I used the arithmetic average to avoid giving too much weight to more developed countries. In almost all years, there are complete data for 15 countries with most information missing for Bolivia, the Dominican Republic, Honduras, Panama, and Paraguay.
Finally, we need to determine the magnitudes of electric goods exported by the United Kingdom. Here, the quantification is not as firmly founded. British FTS only reported this type of information systematically for seven countries: Argentina, Brazil, Colombia (from 1915), Chile, Mexico, Peru, and Uruguay. Reports for the last three start in 1895. To obtain estimates for the other 13 nations, I calculated year by year the ratio of electric goods to machinery and tools for each of the seven countries where information was reported. I then took a simple average of that ratio instead of a weighted average to avoid giving too much weight to the large countries of Argentina and Brazil. I then multiplied that ratio times the machinery and tools to get estimates for the other 13 nations.
The estimates from the United Kingdom lead to measurement error in the total estimates of machinery imports into each country. The U.K. tools' exports represented 52 percent of the value of machinery exported, calculated as the average of the annual averages of the 15 countries with information, with a coefficient of variation of the percentages of 66 percent. The fragility of the calculation is mitigated to the extent that it affects the estimates for only a few small countries. The estimates for electrical equipment goods leads to less error because they account for only 15.1 percent of the value of machinery and tools exported between 1890 and 1930 by the United Kingdom to the seven nations above with information. However, the relative importance of these goods rose from 10 percent in the prewar period to nearly 25 percent from 1919 to 1930. The greater risk associated with this rise is offset to some extent because the coefficient of variation of the percentages was, on average, 6.3 percent for 1890-1913 and 20.8 percent for 1914-1930.