I. INTRODUCTION
The passivity of stainless steels (SSs) in ambient environments results from a thin oxide overlayer, called passive film, which acts as a barrier to the transport of ions, molecules, and electrons. In certain environments, especially in chloride-containing media, the passive film may locally breakdown leading to initiation of pits. This localized corrosion is the result of a combination of electrochemical and metallurgical factors including changes of alloying composition and the nature and distribution of the nonmetallic inclusions (carbide or sulfur precipitates), which has already been studied in depth.Reference Baroux and Marcus1, Reference Lott and Alkire2–Reference Vignal, Krawiec, Heintz and Oltra4
Despite the extensive literature in the field, the role that local changes in the passive layer structure play in the initiation of pitting corrosion in high-purity industrial SSs has been insufficiently investigated.Reference Boulleret, Pastol, Bigot, Baroux and Gorse5, Reference Gorse, Baroux, Ives, Luo and Rodda6 Recent studies using scanning electrochemical microscopy (SECM) on Ti and Al as well as on 304 SS demonstrate that microscopic defect sites within the passive oxide film can act as efficient shunt pathways for electron transport.Reference Lott and Alkire2, Reference Basame and White7–Reference Yin, Niu, Lu, Guo and Chen12 Local variations in thickness, stoichiometry, or crystallography of the thin oxide film are factors believed to influence the conductivity and the passivity breakdown.Reference Marcus, Maurice and Strehblow13, Reference Strehblow and Marcus14 Moreover, surface conditionsReference Amri, Souier, Malki and Baroux15, Reference Souier, Berthome, Malki and Baroux16 as well as strain hardening Reference Peguet, Malki and Baroux17, Reference Vignal, Mary, Oltra, Marcus and Maurice18 are other factors believed to affect either the passive film structure or localized corrosion.
Point defects on the oxide structure as small as 10 nm are believed to be responsible for initiation of stable pits of corrosion as pointed out by GalveleReference Galvele19 by modeling study. More recently, Martin et al.Reference Martin, Bataillon and Cousty20 have noticed, using in situ atomic force microscopy (AFM) in corrosive media, that some bumps of 5-nm-height are formed during passivation of flat surface 304L SS and lead to local initiation of nanopits. Moreover, some of those nanopits are aligned which could be related to the local strain hardening induced by polishing nanoscratches.
Such submicron defects on the oxide layer are hardly detectable using classical SECM microscopy. Pinhero et al.Reference Pinhero, Lister, Trowbridge and Mizia21 and Souier et al.Reference Souier, Martin, Bataillon and Cousty22 reported that conductive atomic force microscopy (C-AFM) yields a spatial resolution greater than what is obtained by means of SECM, and as such it is a valuable tool to investigate the effects of defect sites within passive film on its local breakdown.
In this work, we report the local changes in electrical properties of the native oxide covering a 304L SS by means of C-AFM. The aim of this study is to look for a correlation between the sites with high electrical conductivity and those sites where pits (electrochemical breakdown of the oxide) are generated in a chloride-containing media. The effect of surface preparation and strain hardening on electrical conductivity of passive film and on corrosion process is investigated. From the conductive probe atomic force microscopy (C-AFM) current maps, the conductivity of the native oxide is observed to depend on the specimen preparation due to the inherent local strain hardening caused during the sample preparation process. Furthermore, the spatial distribution of conductive area is compared to the surface topography of the specimen after pitting corrosion in NaCl solution. These new investigations provide a deeper understanding on the onset of pitting corrosion process on 304L SS involving local strain hardening effect on the local properties of the passive layer.
II. EXPERIMENTAL PROCEDURE
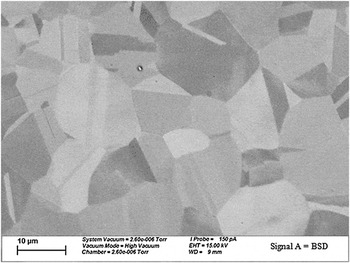
The material under investigation is a polycrystalline austenitic 304L SS with chemical composition (%wt): Cr, 18.68; Ni, 10.14; Mn, 1.72; Mo, 0.35; Cu, 0.15; N, 0.072; C, 0.018; S, 5 ppm; and Fe, balanced. This alloy with a low carbon concentration which prevents the formation of chromium carbide precipitates is considered as a good reference material. Moreover, we point out the absence of sulfide inclusion or carbide precipitates at least within the areas scanned by AFM. This is probably due to the low sulfur and carbon content in SS. Thus, the pits observed by AFM initiate by local breakdown of the passive layer and not due to the existence of inclusions or precipitates. The scanning electron microscope (SEM) images reveal that the austenite grains are equiaxe with an average size of 10 μm (Fig. 1).
Scanning electron microscope images obtained on stainless steels (SSs) after chemical etching revealing the microstructure and the grain size.

An MFP-3D from Asylum Research (Santa Barbara, CA) with a scanner capable of a maximum horizontal scanning of 90 μm and a vertical scanning range up to 15 μm was used. A dedicated module, ORCA,23 consisting of a specially designed cantilever holder that includes a transimpedance amplifier was used for current measurements in a normal atmospheric environment. The gain of the amplifier can be chosen by the user, and the standard values range from 5 × 10⁷ to 5 × 10⁹ V/A. The cantilever holder is used with C-AFM probes to make the measurement.
Both topographies and current measurements have been carried out in contact mode using an n+ silicon tip from Nanosensors24 (CH-2002, Neuchatel, Switzerland) covered with an n-type conductive-doped diamond with a stiffness in the range of 30 N/m. The total measured resistance in contact to platinum surface is <10 kΩ. The typical tip radius of curvature is between 100 and 200 nm. This diamond coating insures both the electric conduction and the mechanical wear resistance of the tip.
Since C-AFM observations require flat surfaces to prevent conductivity changes associated with changes in contact area between the tip and the surface relief, specimens must undergo specific preparation procedures. To check the effect of surface preparation on the C-AFM measurements, three different preparations were used: preparations A, B, and C.
A. Preparation A
The sample was wet grinded with SiC paper successively from 220 up to 4000 grit and then polished using diamond pastes of decreasing grade (3 and 1 μ). The grinding and polishing steps were performed using a rotating polishing disc and rotating specimen holder. In this configuration, the scratches are oriented randomly.
B. Preparation B
This preparation consists of the same preparation A with a final electrochemical polishing in a mixture of monobutylic ether (720 mL) and perchloric acid (80 mL) for 30 min at 10 V. This allows suppressing the scratches and the residual strain within underlying metal induced by grinding and mechanical polishing.
C. Preparation C
This preparation consists of first grinding manually in one specific direction by rotating the SiC 220 paper. After that, the specimen was polished directly with fine 4000 SiC paper and with diamond pastes (3 and 1 μ) to remove enough material from the surface to minimize any trace of scratch but without removing the underlying strain-hardened layer. These steps are also performed automatically by rotating the polishing disc and sample holder. AFM images of grinded specimen with 220 SiC reveal that the scratches are about 10 μm in width and few micrometers deep (data not shown). Moreover, it was reported that the width of the strain-hardening layer on SSs after grinding with similar abrasive paper is 10–15 μm.Reference Pinhero, Lister, Trowbridge and Mizia21
After each preparation, the sample was cleaned for 10 min with distilled Millipore (Billerica, MA) water (18 MΩ·cm), 10 min with ethanol in an ultrasonic bath, and dried using nitrogen gas flow. After surface preparation, samples were kept exposed to air allowing the formation of a native passive layer.
As shown in a previous study,23 the contact area between the tip and the surface specimen calculated in a simple model of contact based on the Hertz law is typically 50 nm2. However, because of the formation of a water meniscus at the tip/surface contact, the smallest area of conductive zones can reach a value of 2000 nm2. This resolution is still good enough to sense the defects on passive film structure as well as the defects induced by mechanical polishing of the surface.
The pitting corrosion test is carried out using in situ AFM with the following setup: the working electrode is the steel sample and the counter electrode is an anodized silver wire, which play also a role of “pseudo” reference electrode. Indeed, during anodization (in chloride-containing media by using galvanostatic test at a constant intensity of 1 mA), a layer of oxide–chloride grows at the surface making the Ag wire potential stable. Thus, the silver wire can be considered as a reference electrode with a characteristic close to the reference electrode Ag/AgCl. Moreover, the potential of this electrode is found to be +120 mV versus the normal hydrogen electrode. All the measured potentials are therefore referenced to the anodized Ag electrode. The electrolyte used is a borate buffer (pH 7.56, [borax] = 0.1 M, [boric acid] = 0.002 M) with a standard 0.5 M NaCl concentration. All the experiments are carried out at room temperature and atmospheric pressure. The potential is controlled using the Autolab interface. To get a good reproducibility of the surface state of the specimens, the samples were cleaned by immersion in solution and polarizing at −400 mV. Then the potential was raised at a rate of 1 mV·s−1 from −400 mV until pit activation occurred.
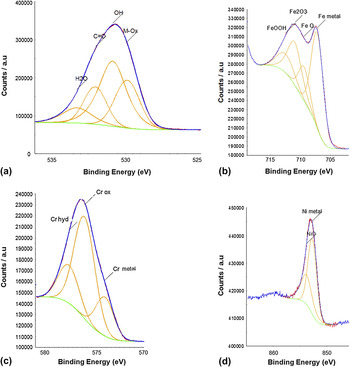
The chemical composition of the passive film formed on the SS surface after mechanical polishing “A” was analyzed using ESCALAB MkII (VG Instrument, Thermo Scientific, Courtaboeuf Cedex, France) x-ray photoelectron spectrometer (XPS). The XPS pattern is shown in Fig. 2. The binding energy of all elements and their compounds are referred to using standard tables published by VG-XPS instrumentation Co., Ltd. (Thermo Scientific, Courtaboeuf Cedex, France). The oxygen peak shows that the passive film contains both oxides and hydroxides [Fig. 2(a)]. The iron peak [Fig. 2(b)] shows that passive film contains iron hydroxides that could be γ-FeOOH (711.6 eV) and α-FeOOH (711.44 eV) and iron oxides that could be Fe2O3 (710.97 eV) and FeO (709.5 eV). The peak of chromium [Fig. 2(c)] shows the presence of chromium oxide Cr2O3 (576.6 eV) and chromium hydroxide Cr(OH)3 (577.2 eV). We point out the presence of nickel oxide NiO (854 eV) in our films [Fig. 2(d)]. These data give a general idea about the macroscopic composition, but it was impossible to perform local XPS measurements by our instrument. Moreover, it is impossible to probe the local changes of the stoichiometry of the passive film unless by using synchrotron radiation. This also shows the interest of our new technique, current sensing AFM (C-AFM), which probes the changes of stoichiometry with submicron resolution.
X-ray photoelectron spectra of the passive film formed on 304L SS: (a) oxygen, (b) iron, (c) chromium, and (d) nickel.

III. RESULTS
First we present typical AFM topographies and C-AFM observations of 304L SS specimens. The influence of the strain hardening due to scratches on the conductivity of the native passive film is then investigated. Some electrochemically polished specimens were studied by AFM to determine the influence of work hardening on pitting corrosion initiation. Specimens prepared under condition “C” were corroded in chloride solution at a potential for which pit activation occurred 15 min.
A. C-AFM images after mechanical and electrochemical polishing
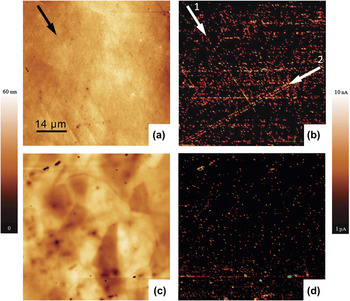
Figures 3(a) and 3(b) show a typical topographic AFM image and the current map simultaneously obtained on mechanically polished specimens following preparation A. The surface topography is smooth with root–mean–square (RMS) of 1 nm for a 60- × 60-μm2 image. We point out the existence of some nanoscratches (of 5-nm deep). Based on their dimension, it is believed that these scratches are induced during the final polishing with diamond paste. Figure 3(b) presents a typical current map taken under 2 V bias. The current distribution is not uniform. The brighter areas correspond to zones with a high density of spots characterized by high current responses due to easier conduction of charges between the tip and the sample through the passive layer. The large dark areas correspond to very low current below 100 fA between the underlying steel and the tip. In these areas, the passive film shows a high electrical resistance (>10 GΩ), which is in good agreement with its protection function. Comparison between the topographic image and the current map reveals a surprising result. The high density of speckles is not related to local corrugation in the specimen surface. Although the conductive line 1 (marked with the arrow “1”) maybe related to slight topography features (nanoscratches), the conductive line 2 (marked with the arrow “2”) do not match any changes in the surface topography. The direction indicated by these alignments could be related to the polishing direction.
Contact mode topographical atomic force microscopy (AFM) images of 304L austenitic steel after (a) mechanical polishing with SiC and diamond paste, (c) after electrochemical polishing, and (b, d) its corresponding current maps, respectively, obtained at +2 V. The arrows show a linear distribution of conductive speckles on a 60- × 60-μm2 area.

To determine the origin of the speckle alignments, some specimens were electrochemically polished after the mechanical polishing “A” to remove the strain-hardened areas associated to the gridding/polishing process.
Figure 3(c) shows the topography image, upon using the electrochemically polished specimen preparation B. The roughness of the surface is higher probably because of the differences in the electrochemical etching process with grain orientation and grain boundaries. The presence of some holes up to 200 nm of apparent depth is detected. The corresponding current map obtained at 1.3 V shown in Fig. 3(d) shows a low density of current speckles about tens of picoamperes, which seem randomly distributed over the surface. By comparing the topographic and current maps at higher magnification, we observed that some of the conductive speckles are arranged along grain boundaries, but others are distributed inside the grains. Some areas with high current (up to 1 nA) are detected within holes, which could be related to an increase in tip–surface contact area within holes and/or higher local conductivity. We point out that no alignment of speckles is detected on this map unlike those obtained on mechanically polished specimens. Besides the chemical and structural changes of the native oxide structure, the electrochemical polishing is known to remove several microns of metal which suppresses the strain-hardened layer. Thus, the conductive lines observed in current maps on mechanically polished specimens (preparation A), therefore, can be related to the existence of strain-hardened areas induced by scratches of the initial mechanical polishing.
It is interesting to note that the electrochemical polishing removes about 1 μ layer from the steel surface. This means that the strain-hardening layer induced by the polishing process “A” is less than 1 μ.
B. C-AFM images on mechanically polished surfaces with high strain hardening
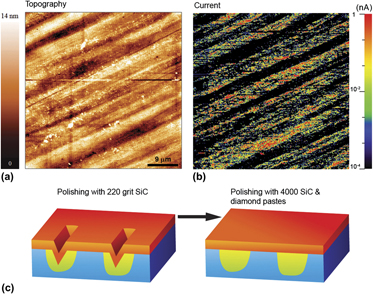
To get deep insight on the effect of hardening in the local conductivity of the passive layer, C-AFM is carried out on mechanically polished specimen with preparation C. The idea is to remove enough material from the surface to suppress any trace of the parallel scratch, without removing the corresponding strain-hardened underlying zones. In this case, we are expecting parallel hardened bands to form over the initially scratched surface. Within the space between two bands, obviously, there is low residual stress.
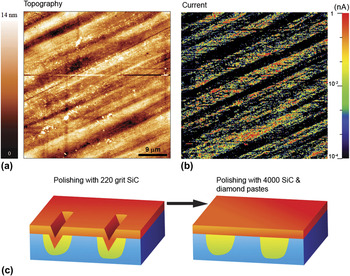
Figure 4 shows a typical topographic AFM image and the current map simultaneously obtained on the same area of specimen after preparation C. The typical topography [Fig. 4(a)] shows a smooth surface without deep scratches, with an RMS roughness of 0.7 nm. However, we point out the existence of some topography band (valley), which is 10- to 20-μm wide and only 3- to 5-nm deep. These valley bands are aligned and are parallel to the direction of the grinding with 220 SiC. We concluded that these bands are the remaining part of the scratches. In contrast, the corresponding current map obtained under 2 V bias shows different zones characterized by huge variations of the measured intensity [Fig. 4(b)]. Furthermore, parallel bands with a high density of current speckles are observed. In these bands, the current intensity of speckles spreads several hundreds of picoamperes up to nanoamperes. In contrast, a low constant current below 1 pA is measured in the region in between these bands. The current in between the bands is in the range of the one measured on specimen after electropolishing. Comparison between the topographic image and the current map reveals that the conductive bands correspond to the topography valley that remains for scratches with 220 SiC paper. Consequently, the high conductive bands are attributed to the strain-hardened zones in the underlying metal, which are formed during the initial polishing with 220 SiC grains [Fig. 4(c)], whereas interband space (with low hardening) exhibits high electrical and homogenous resistance. Then, a strong correlation is obtained between the local strain hardening level (i.e., residual stress) of the underlying metal and the measured electronic conductivity of the oxide overlayer. We also point out that the high-hardened zones present a flat surface while the C-AFM maps show strong variations of their local electrical properties. The current map also reveals that the current intensity measured on the conductive (hardened zone) band is two to three orders of magnitude, which is higher than the one measured within the interband space (low or nonhardened zones). The enhancement of electrical conductivity of passive layer by strain hardening is in good agreement with the other results of Peguet et al.Reference Peguet, Malki and Baroux17 and Vignal et al.Reference Vignal, Mary, Oltra, Marcus and Maurice18 It was demonstrated that during cold rolling or during tensile tests, the macroscopic interfacial impedance of the passive film decreases (enhancement of conductivity) with the strain hardening. In the present study, we show the effect of strain hardening on the electronic properties of the passive layer at the microscopic and submicroscopic scale. This enhancement is explained by local changes in the stoichiometry of the oxide–hydroxide overlayer, which strongly affect its semiconductive properties. To the best knowledge of the authors this result has not been yet reported.
Contact mode AFM image of 304L austenitic steel after mechanical polishing using procedure “C.” (a) Surface topography and (b) its corresponding conductive maps at +2 V. (c) Schematic representation describing the effect of surface preparation “C” on the formation of strain-hardened area induced during the initiation grinding.

C. Characterization of surface after pitting corrosion test
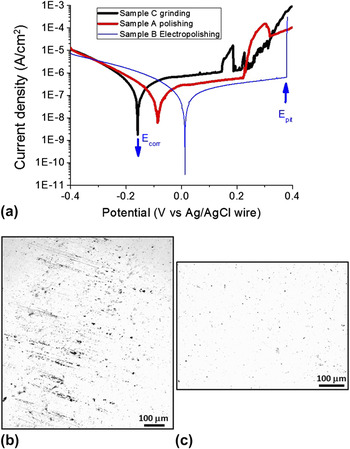
The 304L SS, after mechanical polishing “A,” in these operating conditions exhibits a free corrosion potential (versus Ag/AgCl wire) at −80 mV and a passive range of about 450 mV before pitting around +250 mV as shown in Fig. 5. The current–voltage curve on 304L SS after mechanical polishing “C” and “B” are similar to the one obtained after polishing “A” specimen.
(a) Typical electrochemical pitting polarization curve on SS after polishing procedures “A,” “B,” and “C.” The typical optical micrograph obtained after pitting corrosion on SSs (b) after grinding/polishing (preparation C) and (c) after mechanical polishing (preparation A). In the case of preparation C, the pits are aligned in the direction of initial grinding, whereas they are randomly dispersed after gradual mechanical polishing “A.”

The 304L SS after electrochemical polishing “B” exhibits the highest value of pitting potential which lies between 380 and 450 mV and the lowest current density on the passive state. The polishing specimen “C” exhibits the lowest pitting potential of 150 mV.
One can also observe high fluctuations of the passive current, which indicates instabilities of the passive oxide layer induced by metastable pits. This means that the passive film formed on steel surface after polishing “C” contains high level of defects.
After 15 min at pitting potential, the SS specimens are removed from the electrochemical cell, rinsed in distilled water, and characterized by both optical electron microscope and SEM to get the distribution of pits at mesoscopic scale [Fig. 5(b)]. We point out that most of these pits are aligned along a common direction parallel to the initial mechanical polishing “C” with 220 SiC paper, whereas for the samples “A” and “B,” the pits of corrosion are spread randomly on the surface [Fig. 5(c)]. A question then arises: Do the passive layer zones modified by local strain-hardened metal favor the pitting initiation?
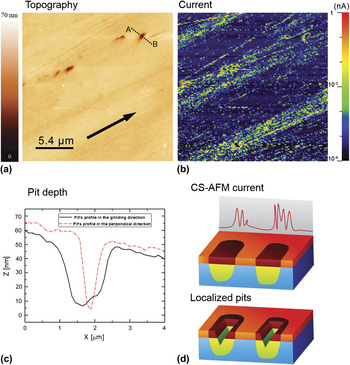
To a better understanding on the effect of strain hardening in the earlier stage of pitting corrosion, a comparison between the C-AFM and AFM maps before and after corrosion test is done. Both topographic AFM images and C-AFM maps of the surface are obtained on the specimen to study the distribution of pits at the submicron scale.
Figure 6(a) shows a typical topographic AFM image on “C” polishing SS specimen after a pitting corrosion test. Some alignments of pits with a typical 30-nm apparent depth appear to be parallel toward a specific direction. The corresponding current map [Fig. 6(b)] shows three conductive bands similar to those obtained before the pitting test. The comparison between the two images of the same area reveals that pits of 50-nm depth [Fig. 6(c)] are located exclusively within these bands. Moreover, most of the pits seem to be elongated in the direction of the initial grinding with 220 SiC paper. This is illustrated in Fig. 6(c), which shows that the pit opening is about 2 μm in the direction of the grinding and is less than 1 μm in the perpendicular direction. This shows the strong effect of the stress distribution in the growth of the pits. Several areas were characterized, and this correlation between the conductive area of the passive layer and the location of corrosion pits is observed throughout the corroded SS surface. We conclude that pits are located on areas where the passive layer presents a high conductivity as shown by the C-AFM maps.
Typical contact mode AFM image of 304L austenitic steel after electrochemical pitting test. (a) Surface relief and (b) its corresponding conductive maps at +2 V. (c) Schematic representation of the correlation between pitting corrosion, strain hardening, and high conductivity of the native oxide. The passive film within the scratches (high hardened areas) exhibits a heterogeneous high conductivity, whereas its conductivity is relatively low and homogenous on less-hardened regions.

Another result from the polarization curves is the shift in corrosion potential toward a more negative value after mechanical polishing “A” and “C”: Ecorr (C) < Ecorr (A) < Ecorr (B). The change in corrosion potential is the result of either change in the kinetics of anodic reaction or the cathodic ones, or both. However, according to our results, the kinetics of the cathodic reaction is the same in the three polishing conditions. Thus, the kinetics of the anodic reaction is increased by increasing the level of strain hardening. Also, we notice that the passive current is highest in the case of polishing “C.” These findings suggest that the electrical and ionic conductivity of the passive film is enhanced by strain hardening, which is in good agreement with the C-AFM data.
IV. DISCUSSION
According to the mechanochemical model developed by Gutman,Reference Gutman25 an increase in dislocation pileup on polycrystalline metals leads to local drops of surface potential. In this model taking into account the fact that surface potential is linked to the corrosion potential, one can infer that corrosion potential over strain-hardened areas is less noble than over the less hardened areas. In the Gutman’s model,Reference Gutman25 the plastic deformation leads to an increase in electron transfer at metal/solution interface, which produces an enhancement of the electrochemical reactions involved in corrosion process. This theory explains well the effect of local strain hardening on corrosion process for metals without passive layer in contact with aggressive solutions. However, this is not the case for materials such as SSs because of the presence of the passive film playing the role of barrier against corrosion initiation. The increase in the local electronic conductivity of the oxide layer evidenced by C-AFM measurements is related not only to the increases of the local surface potential but also to the changes in the local stoichiometry of the oxide passive layer [Fig. 6(d)]. This result has been evidenced in previous study on the changes of electronic properties of passive film of duplex SSs.Reference Pinhero, Lister, Trowbridge and Mizia21 In that sense, over the local hardening area, the passive film is highly doped enhancing the electrical transfer and thus the electrochemical reaction rate. This results are in good agreement with the results of Vignal et al.Reference Vignal, Delrue, Heintz and Peultier26 on duplex SSs. Indeed, by means of local Auger measurements of composition of passive layer, a correlation between the residual stress distribution and the ratio of Cr/Fe on passive layer is evidenced. All these factors are favorable on a selective breakdown of the passive film and promoting the initiation of pits of corrosion. Another reasonable theory could be related to the phase transformation induced by local strain hardening. The austenite could transform into a hard martensite. The pitting corrosion is known to develop easily at the interface of these two phases evolving microgalvanic coupling. Indeed, partial ferromagnetic loops have been evidenced in paramagnetic austenitic steel by Sort et al.Reference Sort, Concustell, Menendez, Surinach, Baro, Farran and Nogues27 using magneto-optical Kerr effect measurements after mechanical polishing. This result indicates that initial processing (cutting and polishing) induces generation of martensite.
Apart from the mechanism behind the enhancement of local electronic conductivity of passive oxide layer induced by strain hardening, the important message of this study is that the strain-hardened areas, induced by sample preparation, act as favorable precursor sites of pitting corrosion. Moreover, a strong correlation is evidenced between the zones of higher electrical conductivity with the localization of generation of pits of corrosion.
V. CONCLUSION
In this work, AFM and C-AFM investigations have been carried out to study both the surface structure and the electric conductivity of the native oxide overlayer on 304L austenitic SS. Although the passive layer presents a flat topography, the associated C-AFM maps reveal an inhomogeneity in the current distribution under a 1 V bias through the overlayer for some specimens. These high-conductivity areas in the passive layer are attributed to the presence of strain-hardened zones in the underlying metal due to the initial mechanical polishing. After corrosion in an electrochemical cell with a chloride solution, ex-situ AFM and C-AFM images reveal that corrosion pits initiate only on the high-conductivity areas of the passive layer. This proves that conductive zones in the passive layer induced by the strain-hardened metallic underlayer are favorable sites for pitting corrosion initiation. This study brings experimental evidences that the stochastic character of localized corrosion initiation observed at the macroscopic scale is deterministic at the submicron scale.