INTRODUCTION
Although pathogen prevalence is often summarized across large spatial scales, local heterogeneity in infection patterns can reveal valuable insights about epidemiological processes. Spatial patterns of infection can be used to identify environmental risk factors, examine parasite ecology, and investigate the role of landscape composition on disease dynamics (Ostfeld et al. Reference Ostfeld, Glass and Keesing2005). Spatial variation in the likelihood of acquiring infections can be caused by a variety of host behaviours and environmental factors. Social behaviour, territoriality and habitat selection can impact contact rates among hosts and the dispersion of fecal material in the environment, which has implications for the epidemiology of pathogens with both direct and fecal–oral transmission routes (Altizer et al. Reference Altizer, Nunn, Thrall, Gittleman, Antonovics, Cunningham, Dobson, Ezenwa, Jones, Pederson, Poss and Pulliam2003). However, the importance of environmental factors is most evident in the case of indirectly transmitted parasites. The relationship between environmental factors and parasite dynamics has been repeatedly demonstrated in a variety of pathogens where successful transmission is dependent on vectors, intermediate hosts or the survival of free-living stages outside the host (Thomson et al. Reference Thomson, Obsomer, Dunne, Connor and Molyneux2000; Ostfeld et al. Reference Ostfeld, Glass and Keesing2005; Pickles et al. Reference Pickles, Thornton, Feldman, Marques and Murray2013). Thus, hypotheses about how pathogens spread through populations can be investigated by quantifying infection patterns against a backdrop of environmental variation at local, regional and global scales.
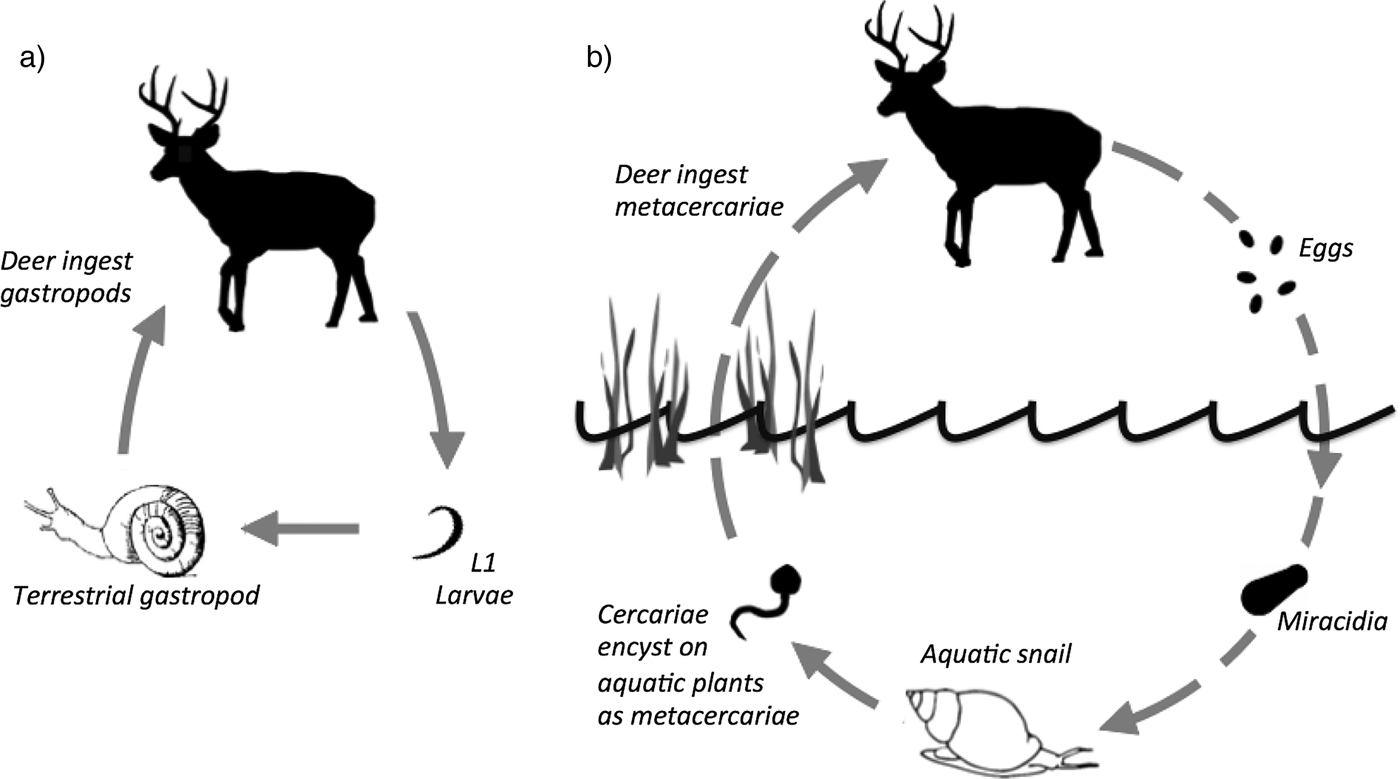
Meningeal worm (Parelaphostrongylus tenuis) and giant liver flukes (Fascioloides magna) are both parasites with complex life cycles that primarily infect ungulates of the family Cervidae (Lankester and Samuel, Reference Lankester, Samuel, Franzmann and Schwartz1998). In North America, the definitive host for both parasites is the white-tailed deer (Odocoileus virginianus), and both require an intermediate gastropod host to complete their life cycles. Parelaphostrongylus tenuis is a protostrongylid nematode that infects a host's nervous tissue in the spinal cord and the venous sinuses and subdural space in the cranium (Lankester and Samuel, Reference Lankester, Samuel, Franzmann and Schwartz1998). First-stage larvae (L1) are passed in the feces of infected deer and are subsequently taken up by terrestrial gastropods. Within the gastropod, the larvae develop into their third-stage (L3), which are infective to deer. Deer become infected by ingesting infected gastropods (Fig. 1A, Lankester and Samuel, Reference Lankester, Samuel, Franzmann and Schwartz1998).
Life cycle of (a) P. tenuis and (b) F. magna.

Deer infected with the trematode F. magna pass fluke eggs in their feces. These eggs hatch in an aquatic environment into free-swimming miracidia that penetrate the intermediate gastropod host: aquatic snails of the family Lymnaeidae. After several stages of development, free-swimming cercariae emerge from the snail and encyst as metacercariae on aquatic vegetation. Deer become infected when feeding on aquatic vegetation (Fig. 1B, Pybus, Reference Pybus, Samuel, Pybus and Kocan2001). Although neither parasite causes apparent morbidity in deer, both can cause mortality in domestic dead-end hosts and have been implicated in population declines of other wild hosts (Foreyt and Todd, Reference Foreyt and Todd1976; Guthery and Beason, Reference Guthery and Beason1979; Whitlaw and Lankester, Reference Whitlaw and Lankester1994; Pybus, Reference Pybus, Samuel, Pybus and Kocan2001). In addition, F. magna is an invasive species of concern in Europe (Pybus, Reference Pybus, Samuel, Pybus and Kocan2001). Despite the wide distribution of P. tenuis and F. magna and their potential negative impacts on dead-end hosts, such as moose (Alces alces), the ecological requirements for transmission are relatively poorly understood.
Parelaphostrongylus tenuis and F. magna can cause morbidity and mortality in moose, and these parasites are a potential contributing factor to declining moose numbers (Aho and Hendrickson, Reference Aho and Hendrickson1989; Murray et al. Reference Murray, Cox, Ballard, Whitlaw, Lenarz, Custer, Barnett and Fuller2006; Lankester, Reference Lankester2010; Wünschmann et al. in press). Moose populations in Minnesota have experienced steep declines over the past two decades. The most recent population estimate for the northeastern Minnesota population was ~4300 moose in 2014, which is only half of the population estimate just 5 years ago (DelGiudice, Reference DelGiudice2014), and nearly 40% of mortality has been health-related (MNDNR, 2011). In northwestern Minnesota, moose populations have also declined precipitously (Murray et al. Reference Murray, Cox, Ballard, Whitlaw, Lenarz, Custer, Barnett and Fuller2006). Up to 30% of mortality during the decline in northwestern Minnesota was attributed to F. magna, and the prevalence of the parasite was nearly 90% (Murray et al. Reference Murray, Cox, Ballard, Whitlaw, Lenarz, Custer, Barnett and Fuller2006).
Although there are no apparent outward symptoms of fluke infection in dead-end hosts such as moose (Lankester and Foreyt, Reference Lankester and Foreyt2011), juvenile flukes migrate extensively within the liver, potentially damaging 50–90% of the tissue (Pybus, Reference Pybus, Samuel, Pybus and Kocan2001). High intensities of F. magna in moose may reduce physical condition and cause death, especially if accompanied by malnutrition (Lankester and Samuel, Reference Lankester, Samuel, Franzmann and Schwartz1998; Murray et al. Reference Murray, Cox, Ballard, Whitlaw, Lenarz, Custer, Barnett and Fuller2006). In deer, fitness effects of severe infections include up to 25% lower body mass in bucks and reduced twinning rates in does (Mulvey and Aho, Reference Mulvey and Aho1993; Mulvey et al. Reference Mulvey, Aho and Rhodes1994). Moose infected with P. tenuis display symptoms including blindness, lack of fear, ataxia and circling due to damage to the central nervous system. Parelaphostrongylus tenuis infections are usually fatal to moose (Lankester and Samuel, Reference Lankester, Samuel, Franzmann and Schwartz1998; Wünschmann et al. in press), but they can also lead indirectly to death due to increased susceptibility to predation or accidents. Approximately 5% of moose mortality in northeastern and northwestern Minnesota has been attributed to P. tenuis (Murray et al. Reference Murray, Cox, Ballard, Whitlaw, Lenarz, Custer, Barnett and Fuller2006; Lenarz, Reference Lenarz, DonCarlos, Kimmel, Lawrence and Lenarz2009).
Deer densities have been increasing at the northern peripheries of their range due to recent changes in climate and land use (Thompson et al. Reference Thompson, Flannigan, Wotton and Suffling1998; Pickles et al. Reference Pickles, Thornton, Feldman, Marques and Murray2013). Parasite-mediated interactions between moose and deer have led to the belief that, at least at the regional scale, moose densities are limited by parasitism when deer are abundant (Whitlaw and Lankester, Reference Whitlaw and Lankester1994; Lankester, Reference Lankester2010). From a management perspective, deer densities are recommended to be <4 deer km−2 in order to minimize P. tenuis transmission risk (MNDNR, 2011). Deer densities have generally been used as an index for infection risk and transmission is assumed to be density dependent. However, evidence for this pattern is conflicting (Lenarz, Reference Lenarz, DonCarlos, Kimmel, Lawrence and Lenarz2009), perhaps because successful transmission is also dependent on favourable environmental conditions for gastropods and free-living parasitic stages of the life cycle (Fig. 1). Thus, deer densities alone may not explain spatial variation in prevalence.
The objective of this research is to use fecal surveys to evaluate ecological factors that correlate with spatial variation in infection risk in deer. While our ultimate goal is to quantify moose infection risk, moose are a dead-end host and eggs and larvae are only rarely, if ever, passed in feces (Lankester et al. Reference Lankester, Peterson and Ogunremi2007; Lankester and Foreyt, Reference Lankester and Foreyt2011). Although this makes non-invasive sampling of moose impossible, moose become infected with these parasites by the same mechanisms as deer. Thus, understanding the ecological conditions producing high rates of infection in deer should translate into quantifying infection risk for negatively impacted hosts, such as moose, and will enhance our understanding of how these complex parasites spread and persist in ecosystems.
MATERIALS AND METHODS
Study area
This research was conducted in northern Minnesota, USA, in Voyageurs National Park (VNP) and lands adjacent to it. VNP (882 km2) is situated along the Minnesota–Ontario border and is surrounded by public and privately-owned forests managed for commercial timber harvest. The area contains many large and small lakes (39% of land area in VNP, Faber-Langendoen et al. Reference Faber-Langendoen, Aaseng, Hop, Lew-Smith and Drake2007), and has a maximum relief of approximately 90 m. The climate is mid-continental with mean monthly temperatures ranging from −15 °C in January to 19 °C in July. Mean annual precipitation is 61 cm with an average of 183 cm of snowfall occurring from early November to early April (Kallemeyn et al. Reference Kallemeyn, Holmberg, Perry and Odde2003).
Soils in VNP are of glacial origin formed above Precambrian rock formations. Soils are dominated by shallow upland forest soils and deep organic soils, with often abrupt transitions between the two (Kallemeyn et al. Reference Kallemeyn, Holmberg, Perry and Odde2003). Vegetation is a mix of southern boreal and Laurentian mixed conifer-hardwood forest (Faber-Langendoen et al. Reference Faber-Langendoen, Aaseng, Hop, Lew-Smith and Drake2007). Forest cover is a mosaic of quaking aspen (Populus tremuloides), paper birch (Betula papyrifera), balsam fir (Abies balsamea), jack pine (Pinus banksiana), red pine (P. resinosa) and white pine (P. strobus). Beaver-created wetlands are abundant (Johnston and Naiman, Reference Johnston and Naiman1990) with other natural bogs and large wetlands also present.
Woodland caribou (Rangifer tarandus) were extirpated from the area around 1900 and moose and white-tailed deer are the only ungulate species remaining (Cole, Reference Cole1987). Winter deer densities in VNP during the study likely ranged between 3 and 6 km−2 (Gogan et al. Reference Gogan, Kozie, Olexa and Duncan1997; VNP unpublished data). Winter deer densities in the Deer Management Units adjacent to VNP ranged from 3·5 to 4·2 km−2 in 2009–2010 (Lenarz, Reference Lenarz2011). Moose numbers have remained relatively stable since the 1990s with a density in the Kabetogama Peninsula ranging from 0·14 to 0·19 moose km−2 (Windels, Reference Windels2014). While moose populations have been declining across northeastern Minnesota, moose have persisted in VNP at low densities despite moderate–high densities of white-tailed deer and high prevalence of P. tenuis. Historically, prevalence of P. tenuis in deer fecal samples in VNP has ranged from 73 to 91% (Rowe, Reference Rowe1978; Gogan et al. Reference Gogan, Kozie, Olexa and Duncan1997).
Deer pellet counts
Between 1989 and 2009, VNP established a network of 92 randomly selected 1-km2 deer survey units in VNP and within a 5 km radius of the park boundary (Gogan et al. Reference Gogan, Kozie, Olexa and Duncan1997; VNP unpublished data). To quantify relative deer densities across the study area for the present study, we selected 29 of these units (24 in the park and 5 outside) that were also accessible by snowshoe or snowmobile to collect fecal pellets (see the subsection Pellet Collection below) and were distributed across as wide a geographic range as logistically possible. We only report on pellet data from these 29 units. Two transect lines were established in each sampling unit, with at least 100 m separation between transect lines. Only one transect was established in sampling units containing >50% water cover (e.g. units located along the shorelines of large lakes). Each transect line was 800 m in length and consisted of four plots (22 × 3·6 m) at 200-m intervals. Within each plot, all groups of deer pellets visible above the previous year's leaf litter were counted as soon as possible after snowmelt. Deer pellet density was calculated as the number of pellet groups observed/total area sampled (m2). If part of the plot could not be counted due to moving water, snow or murky standing water, then the obscured area was estimated to the nearest 10% and deducted from the total area sampled. Deer pellet counts were conducted after most snow had melted between April 23 and May 26, 2009, and between April 12 and May 6, 2010. Survey units were categorized by land ownership (VNP v. State-owned) and location (UTM coordinates of unit centroid) for spatial comparison. Pellet survey data should be interpreted as an index that captures spatial variation in relative deer density.
Pellet collection
We collected white-tailed deer pellets for parasite assays from 29 survey units in March (N = 7 in 2009, n = 22 in 2010), which coincides with the period of peak shedding in late winter/early spring (Lankester and Samuel, Reference Lankester, Samuel, Franzmann and Schwartz1998). Both F. magna eggs and P. tenuis larvae can survive freezing temperatures and remain viable into the growing season (Lankester and Anderson, Reference Lankester and Anderson1968; Shostak et al. 1984; Pybus, Reference Pybus, Samuel, Pybus and Kocan2001). Within each survey unit, 10 pellet groups were selected for sampling, with 5 groups coming from each half of the survey unit. To minimize the likelihood of sampling pellet groups from the same deer within a survey unit, we sampled from pellet groups that differed in size, shape and colour and were at least 20 m apart. We recorded the location of each sampled pellet group with a handheld GPS. We collected ≥10 individual pellets from each pellet group off the snow. Pellets resting on vegetation or bare soil were not sampled and sampling did not take place after significant melting or rain to minimize leaching of larvae out of samples or contamination by free-living soil nematodes. Samples were kept frozen until analysis. One unit was sampled in both 2009 and 2010.
Parasite quantification: P. tenuis
Parelaphostrongylus tenuis larvae were extracted using a modified Baermann technique (Forrester and Lankester, Reference Forrester and Lankester1997). Approximately 20 g of fecal pellets from each sample were weighed, placed in cheesecloth and suspended in pilsner glasses (72 mm diameter at top, 238 mm in height, slightly tapered) with enough water to cover the pellets. After 24 h, the pellets were removed and water was decanted so that only ~50 mL remained, leaving any possible larvae undisturbed at the bottom. The remaining fluid was poured into 50 mL vials and left to settle for an additional 24 h. Supernatant was pipetted off, and the remaining 5–10 mL was combined with 15–20 mL of 10% formalin for fixation until counting. In addition, the same fecal pellets used for the Baermann procedure were oven-dried at 200 °C for 24 h and weighed to determine dry mass. To quantify larva numbers, the sediment was rinsed into Petri dishes with 1 cm2 grids etched on the bottom and examined microscopically. Larvae were systematically counted using a dissecting microscope at 25×. The intensity of infection was reported as larvae/g dried feces. Parelaphostrongylus andersoni and Varestrongylus alpenae, which are morphologically similar to P. tenuis, are not believed to be present in the region (Peterson and Lankester, Reference Peterson and Lankester1991). Varestrongylus alpenae is also larger than P. tenuis.
Parasite quantification: F. magna
Fascioloides magna eggs were extracted using the Flukefinder® apparatus (FlukeFinder, Soda Spring, ID). Approximately 2 g of fecal pellets were homogenized in water and poured into the apparatus. Cold running water was poured into the apparatus until about half full. The apparatus was lightly tapped against the side of the sink to expedite the passing of water through the filters. After the process was repeated four times, the debris and eggs from the secondary filter screen were backwashed into a 50 mL test tube and left to settle for 4 min. The supernatant was poured off in one careful movement, leaving the debris and eggs in the bottom of the test tube. The sediment was re-suspended in water and left to settle for 2 min. The supernatant was then decanted again. The process was repeated until no more debris remained suspended in the water after 2 min. The final solution was poured into 25 mL vials and combined with 10% formalin for fixation until counting. To quantify egg numbers, the supernatant fluid was rinsed into Petri dishes with 1 cm2 grids etched on the bottom and examined microscopically using a dissecting microscope at 25×. Methylene blue dye was added to enhance egg visibility. The intensity of infection was reported as eggs per gram dried feces. Dried fecal mass was determined by calculating the percent water content in the pellets that were oven-dried for the Baermann procedure.
Statistical analysis
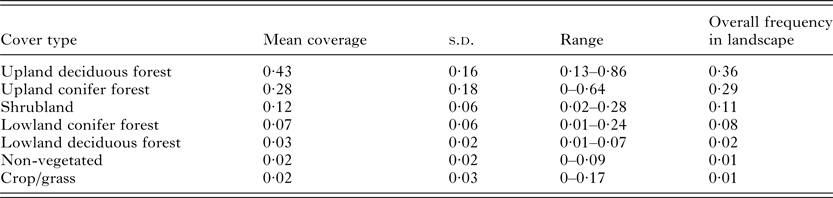
To investigate the extent to which parasite infection patterns were influenced by environmental factors, we assumed that fecal samples were collected within the core home range of the individual deer. Studies of deer in VNP show that they are non-migratory and do not have distinct seasonal home ranges (Cobb et al. Reference Cobb, Gogan, Kozie, Olexa, Lawrence and Route2004). We created a 1·65 km buffer around the sampling point to approximate the range use of the individual deer, which generated a ‘home range’ that was comparable in size to observed home range sizes (~9 km2) for white-tailed deer in VNP (Cobb et al. Reference Cobb, Gogan, Kozie, Olexa, Lawrence and Route2004). Habitat composition for each home range buffer was determined using the United States Geological Survey GAP Land Cover Data Set (MNDNR, 2007). GAP vegetation classifications are based on Landsat satellite imagery with a spatial resolution of 30 m. GAP vegetation data are classified at 4 hierarchical levels. Here, we use Level 2, which includes 10 land cover classifications (accuracy: 78%, MNDNR, 2007). Habitat composition of each buffer was calculated as the proportion coverage of each GAP cover type within the buffer. Lakes (>16 ha in area) are not utilizable habitat for deer, and therefore the area of each buffer was adjusted to exclude lakes. On average, lakes comprised 24 ± 16% (s.d.) of home range buffers (range: 0·1–52%). Only dominant cover types that comprised >5% of the buffer for at least one survey unit were considered in subsequent analyses (Table 1). Dominant cover types included upland deciduous forest, lowland deciduous forest, upland conifer forest, lowland conifer forest, shrubland, non-vegetated and crop/grass. Upland conifer forests contain up to 33% deciduous tree cover (MNDNR, 2007), and habitat within VNP that is defined as upland conifer would be considered mixed conifer-deciduous forest in other land cover data sets (Faber-Langendoen et al. Reference Faber-Langendoen, Aaseng, Hop, Lew-Smith and Drake2007).
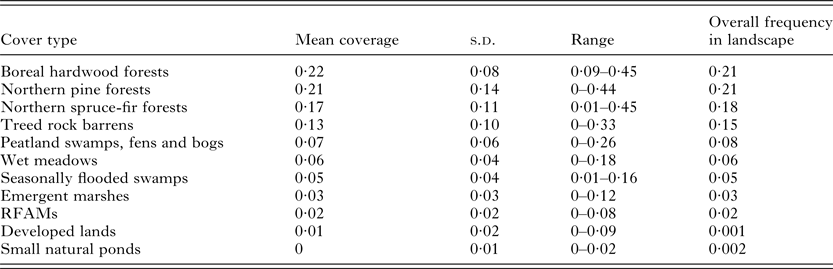
Dominant GAP cover types in home range buffers (>0·05 mean coverage) included in regression models as risk factors for infection

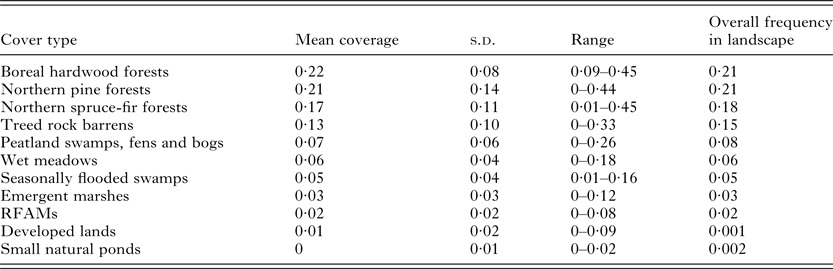
Because F. magna relies on an aquatic gastropod as an intermediate host, we also utilized cover type data from the US Geological Survey-National Park Service Vegetation Mapping Program for the F. magna analysis. Unlike GAP, this cover map was based on interpretation of aerial photography (colour infrared film at a scale of 1:15 840), and classified using the US National Vegetation Classification (USNVC) system (Faber-Langendoen et al. Reference Faber-Langendoen, Aaseng, Hop, Lew-Smith and Drake2007). VNP and a narrow buffer outside the park were classified into 23 ecological subgroups, and had an overall accuracy of 82·4%. Ecological subgroups were defined as vegetation types that occurred together on the landscape, shared similar ecological processes and underlying abiotic factors, and formed an easily identifiable unit on the landscape (Faber-Langendoen et al. Reference Faber-Langendoen, Aaseng, Hop, Lew-Smith and Drake2007). Although two pellet survey units (N = 20 samples) fell outside the bounds of this map and had to be excluded from this dataset, the advantage of using the USNVC layer was that it provided greater resolution on a variety of wetland cover types, allowing for the importance of wetlands in F. magna transmission to be examined more directly. Dominant aquatic cover types included peatland swamps/fens/bogs, wet meadows, seasonally flooded swamps, emergent marshes and rooted-floating aquatic marshes (RFAMs). Dominant terrestrial cover types included boreal hardwood forest, northern pine forest, northern spruce-fir forest, treed rock barrens and developed lands (Table 2).
Additional USNVC cover types considered in regression models for F. magna
We performed generalized linear mixed models (GLMMs, distribution: binomial, N = 295) to investigate risk factors that influenced the likelihood that an individual fecal sample was infected (1: larvae or eggs detected/0: no larvae or eggs detected). Survey unit was included as a random effect. Separate analyses were performed for P. tenuis and F. magna. Covariates included deer pellet density and dominant GAP cover types (Table 1). All covariates were first analysed in univariate regressions. Covariates with regression coefficients with P < 0·2 were included in multivariate regressions. Multivariate models were backward selected from the full model to a model containing only a single covariate. AICc was used to compare all multi- and univariate models and identify models that best fit the data. For F. magna, an additional analysis was performed for the USNVC cover type data (N = 275). Model selection was conducted in a similar manner as the GAP analysis. Intensity data were not used as outcomes for GLMMs because fecal shedding is often not correlated with true intensity for helminth parasites and is impacted by a number of individual factors that were not available in this study, such as age, sex, and body condition (Gillispie, Reference Gillispie2006). Interpretation of intensity data relative to habitat type would be difficult without these individual-level factors. We repeated GLMM analyses using a 5 km buffer rather than a 1·65 km buffer to assess the robustness of results and potential sensitivity to the fact that a fecal sample may not have been located at the centerpoint of a deer's home range. Habitat analyses were performed in ArcMap (v10.1, ESRI, Redlands, CA, USA) and the Geospatial Modelling Environment (GME 0.7.2.1, Spatial Ecology LLC). GLMMs and model selection were performed in R (v3.0.2, R Foundation for Statistical Computing, Vienna, Austria).
RESULTS
Patterns in parasite prevalence and deer density
Overall, P. tenuis larvae were detected in 69% of deer fecal samples, though unit-specific prevalence ranged from 10 to 100%. Prevalence did not appear to change between 2009 and 2010 (z = − 0·51, P = 0·61), although the same units were not sampled in each year. Infection rates were nearly twice as high in VNP (76%, n = 245) than in the surrounding area of Minnesota (40%, n = 50; z = 5·18, P < 0·001), and infection intensity ranged from 0·14 to 1168 larvae/g dried feces (
 $\bar x$
= 64·8 ± 8·2 s.e. larvae per gram dried feces).
Fascioloides magna eggs were detected in 57% of deer fecal samples, and unit-specific prevalence ranged between 10 and 90%. Prevalence of F. magna was lower in 2009 (49%, n = 100) than in 2010 (60%, n = 234, z = − 1·9, P = 0·057). Mean prevalence was slightly higher in VNP (62%, n = 245) than in the surrounding area (44%, n = 50; z = 2·36, P = 0·02). Infection intensity ranged from 0·4 to 193 eggs per gram dried feces (
 $\bar x$
= 40·3 ± 2·9 s.e. eggs per gram dried feces).
Deer pellet density did not vary across years (t = 1·53, P = 0·16), nor did it vary inside v. outside the park (t = 0·88, P = 0·406). Deer pellet density ranged between 0·01 and 0·05 pellet groups m−2 (mean = 0·02 ± 0·002 s.e. pellet groups m−2).
Habitat composition and infection risk
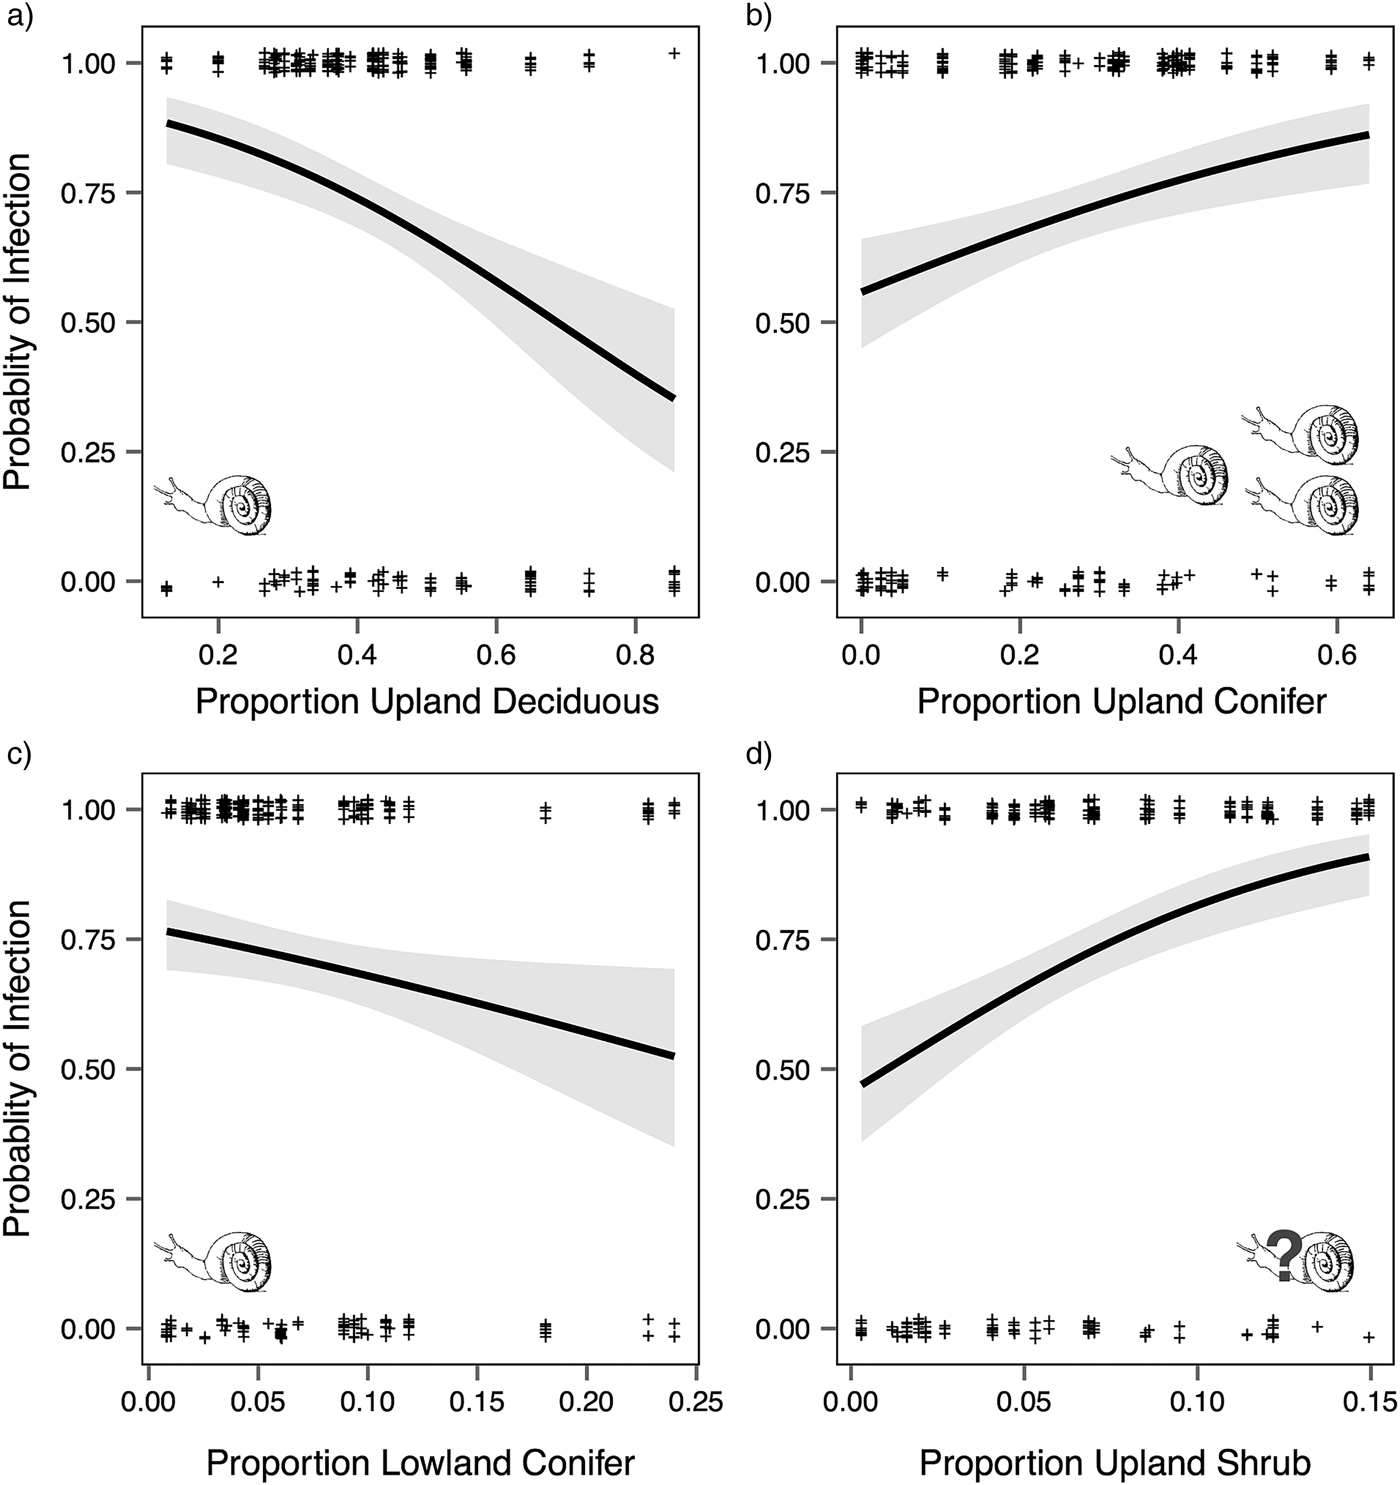
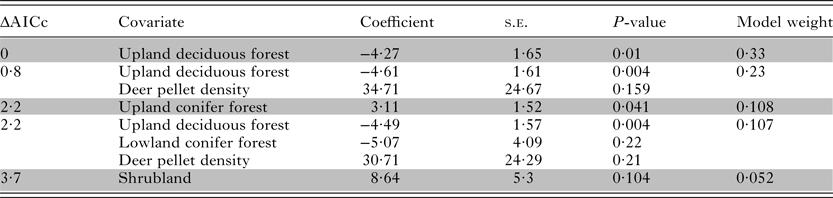
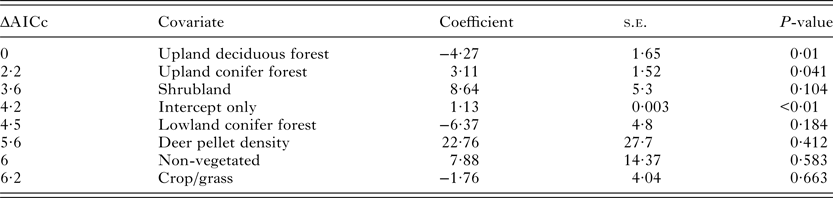
Habitat composition had strong effects on P. tenuis infection risk in deer. Deer were significantly less likely to be infected in areas with greater proportions of upland deciduous forest (β = −4·27, P = 0·01, Table 3, Fig. 2A). This was the single best predictor for P. tenuis infection risk, and the univariate model for this cover type produced the best overall fit for the data (Tables 3 and 4). Although models containing conifer forest did not perform as well as those containing upland deciduous forest (ΔAICc >2·2), higher amounts of upland conifer forest significantly increased infection risk in deer (β = 3·11, P = 0·041, Fig. 2B), whereas lowland conifer forest had a non-significant negative effect on infection risk (β = −5·07, P = 0·22, Fig. 2C). Also, survey units outside the park were characterized by ~24% less upland conifer forest than units within VNP (8 v. 32%, respectively; t = 3·32, P = 0·01). Deer pellet density was slightly positively correlated with infection risk in several models that received >5% of AICc weight, though this factor was never significant and the univariate model that contained deer pellet density performed worse than an intercept-only model.
Relationships between the probability of P. tenuis infection and the proportion of a deer's home range that consisted of (a) upland deciduous forest, (b) upland conifer forest, (c) lowland conifer forest and (d) upland shrub. Shading indicates a 95% confidence interval around the regression line. Pictures of snails indicate relative densities of gastropods by habitat type (upland deciduous: 35 gastropods m-2; lowland conifer: 37 gastropods m-2; upland conifer: 70 gastropods m-2; upland shrub: no data available). VNP gastropod data provided from (Cyr et al. Reference Cyr, Windels, Moen and Warmblood2014). Observed data are indicated with crosses.

Best-fit models for P. tenuis infection risk in deer given proportion coverage of different cover types. Models shown received >5% of AICc weight
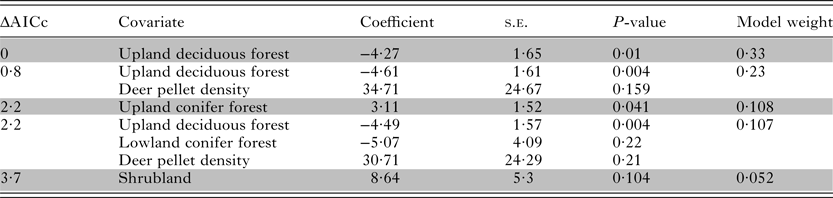
Univariate models of P. tenuis infection risk in deer given proportion coverage of different cover types. Cover types with P < 0·2 were considered in multivariate models

Shrubland also appeared in one of the models receiving >0·05 weight for P. tenuis risk (ΔAICc = 3·7), although shrubland's effect in increasing infection risk was not significant (β = 8·64, P = 0·104). However, when shrubland was subdivided into its GAP Level 3 sub-classifications (upland shrub and lowland shrub), only upland shrub significantly increased infection risk (β = 19·77, P = 0·002, Fig. 2D). A univariate model containing upland shrub outperformed all the GAP2 models and accounted for >60% of model weight if included with the GAP2 models.
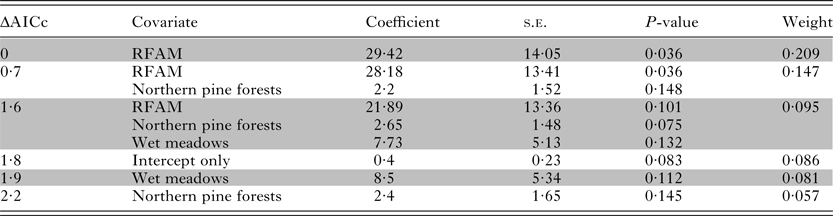
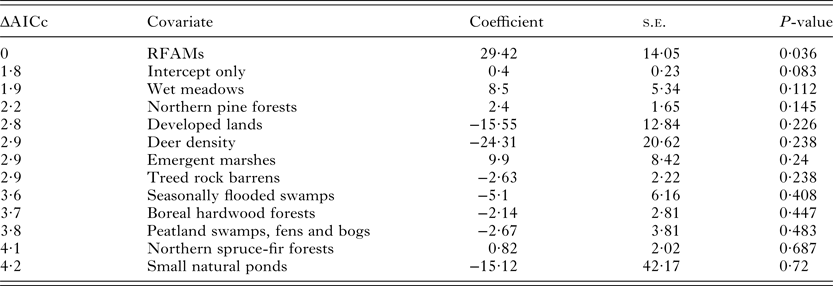
The likelihood of F. magna infection in deer was not significantly affected by any of the dominant cover types in the GAP2 data set. This is probably a consequence of the life cycle of F. magna, which is dependent on aquatic gastropods and aquatic vegetation. Although F. magna exhibited a strong association with lakes (β = 2·65, P = 0·046), lakes were not considered in multivariate models because they were used in calculations of percent coverage for other cover types. In addition, lymnaeid snails are generally only found in shallow waters that represent only a small proportion of a lake’s area (Pybus, Reference Pybus, Samuel, Pybus and Kocan2001). In the USNVC analysis, we found that northern pine forests and wet meadows had a positive effect on infection risk in some of the best multivariate models, though both these factors performed little better than an intercept-only model in univariate regressions (Tables 5 and 6).
Best-fit models for F. magna infection risk in deer given proportion coverage of different cover types. Models shown received >5% of AICc weight

Univariate models of F. magna infection risk in deer given proportion coverage of different cover types. Cover types with P < 0·2 were considered in multivariate models

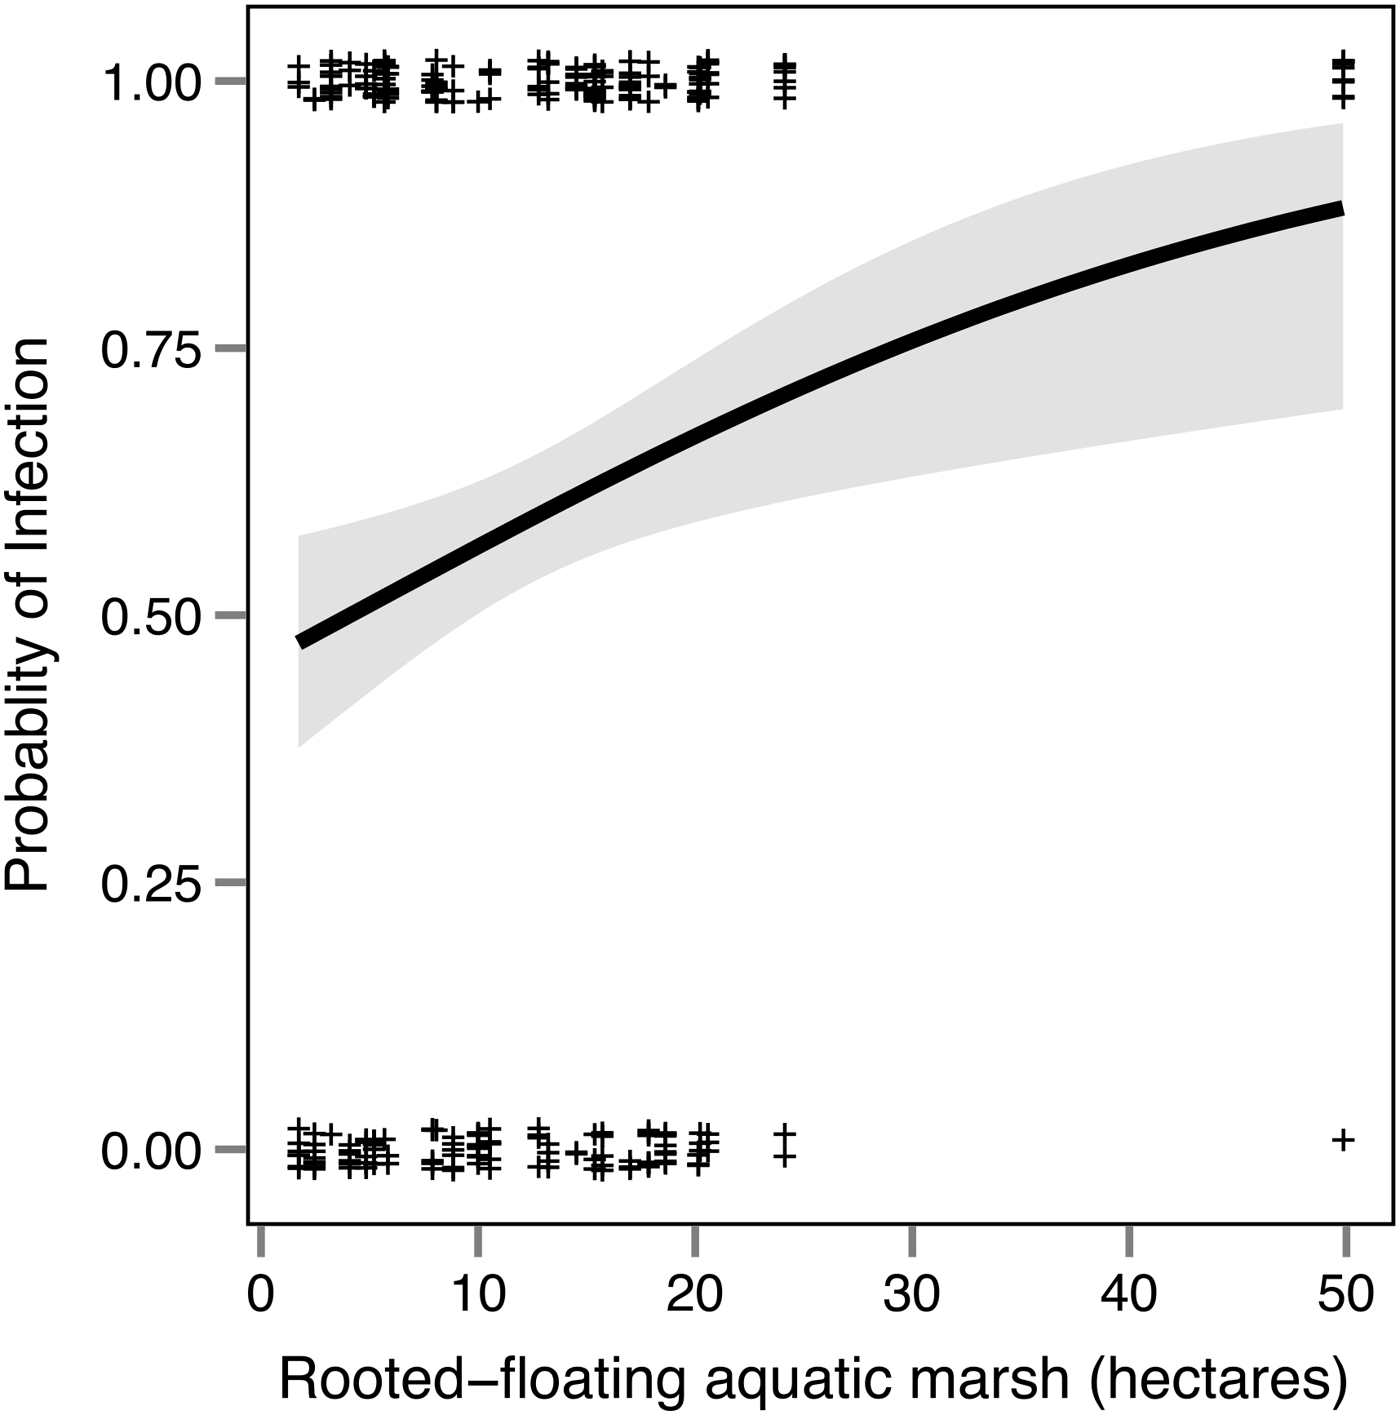
The cover type that had the greatest impact on F. magna infection risk was RFAM (rooted-floating aquatic marsh). Although comprising only a small proportion of the landscape, deer were at significantly higher infection risk in areas characterized by more RFAM (β = 29·42, P = 0·036, Tables 5 and 6, Fig. 3). This positive effect remained equal in magnitude even when we excluded all 10 samples from an outlier survey unit that contained about twice as much RFAM than any other unit, though the effect was no longer significant. If we pool RFAMs together with emergent marshes, which are also permanently flooded with deeper water, we find that marshes in general seem to increase infection risk (β = 13·82, P = 0·038). However, emergent marshes by themselves were not significant (P = 0·24). There was also no correlation between infection risk and a factor that included all permanent and seasonally flooded wetlands pooled together (marshes, wet meadows and seasonally flooded swamps). Thus, our results suggest that RFAMs are the most important type of wetland predicting infection risk in deer, with wet meadows also possibly playing a role.
Relationship between the probability of F. magna infection and the amount of rooted-floating aquatic marsh within an individual's home range. Shading indicates a 95% confidence interval around the regression line. Crosses indicate observed data.

Regression results for both parasites were robust even when the buffer zone was expanded from a 1·65 km (average home range size for VNP deer) to a 5 km radius. This demonstrates that the habitat analyses were not biased by the fact that a fecal sample may not have been located at the centre of a deer's home range.
DISCUSSION
For both P. tenuis and F. magna, deer infection risk was strongly influenced by the habitat and cover types utilized by individual deer. Ecological factors related to cover types likely impacted infection risk by influencing the ability of parasites to successfully complete their life cycles within the environment. Our results highlight the importance of understanding how ecology influences each life stage in order to understand their occurrence in the definitive host. Although relationships between cover types and infection risk are correlative, they yield valuable insights about the environmental conditions required for successful transmission. This, in turn, can fuel hypotheses for future research on the ecology of both parasites. Because moose become infected by the same mechanisms as deer, understanding the environmental conditions that lead to high rates of infection in deer should enhance our ability to predict infection risk in declining moose populations.
Environmental risk factors for P. tenuis infection
In general, spatial patterns of P. tenuis infection were best predicted by aspects of habitat composition. Deer experienced lower infection risk in habitats characterized by greater amounts of upland deciduous forest. Infected deer were more likely to occur in habitats with higher proportions of upland conifer forest and upland shrub. The impact of ecological factors on P. tenuis infection patterns likely arises from microhabitat differences in moisture and humidity, which has consequences for gastropod abundance and parasite survival (Lankester, Reference Lankester2010). During the summer in northeastern Minnesota, thermal environments (i.e. operative temperature) in deciduous forests can be up to 2 °C warmer than conifer or mixed forests (Belovsky, Reference Belovsky1981; McGraw et al. Reference McGraw, Moen and Overland2012; Olson et al. Reference Olson, Windels, Fulton and Moen2014). High levels of crown closure typical of conifer forests likely create cooler thermal environments by more effectively filtering solar radiation (Schwab and Pitt, Reference Schwab and Pitt1991; Demarchi and Bunnell, Reference Demarchi and Bunnell1993; McGraw et al. Reference McGraw, Moen and Overland2012), thus generating conditions more conducive to the survival of gastropods and L1 larvae (Shostak and Samuel, Reference Shostak and Samuel1984; Nankervis et al. Reference Nankervis, Samuel, Schmitt and Sikarskie2000; Lankester, Reference Lankester2010). Even though lowland areas have higher substrate water content (McCann et al. Reference McCann, Moen and WindelsIn review), which should increase gastropod abundance (Prior, Reference Prior1985; Hawkins et al. Reference Hawkins, Lankester, Lautenschlager and Bell1997, Reference Hawkins, Lankester and Nelson1998; Lankester, Reference Lankester2010), infection risk was not positively correlated with lowland conifer forest. Lowland conifer forests in VNP are often dominated by black spruce (Picea mariana), which tend to be associated with acidic soils that may be subprime for gastropods (Jeglum, Reference Jeglum1971; Maze and Johnstone, Reference Maze and Johnstone1986; Graveland and van der Wal, Reference Graveland and van der Wal1996).
The implications of a warmer, drier environment in upland deciduous forests are demonstrated by the fact that this cover type has the lowest observed gastropod densities in VNP (Cyr et al. Reference Cyr, Windels, Moen and Warmblood2014). Hence, the negative correlation between upland deciduous forest and P. tenuis infection risk can be explained by differences in the abundance of intermediate hosts. Gastropod numbers were similarly low in lowland conifer forest, which also had a negative (but non-significant) relationship with infection risk. Upland conifer forests, which were associated with elevated infection risk, exhibited the highest gastropod densities (Cyr et al. Reference Cyr, Windels, Moen and Warmblood2014). Because upland conifer contains up to 33% deciduous tree cover (MNDNR, 2007), upland conifer forests in VNP are similar to the ‘mixed conifer-deciduous forests’ defined in other studies as highly suitable gastropod habitat (Kearney and Gilbert, Reference Kearney and Gilbert1978; Nankervis et al. Reference Nankervis, Samuel, Schmitt and Sikarskie2000; Cyr et al. Reference Cyr, Windels, Moen and Warmblood2014). Upland shrub may also have higher gastropod densities, particularly in late autumn (Cyr and Moen, unpublished data), which is the peak transmission season during which most infected gastropods would contain L3 larvae (Lankester and Peterson, Reference Lankester and Peterson1996; Peterson et al. Reference Peterson, Lankester and Riggs1996). In addition, the understory and ground cover are more dense in upland shrub than in mature deciduous forests, and this likely provides better habitat for gastropods, especially at deer foraging heights (Maze and Johnstone, Reference Maze and Johnstone1986). However, more research is needed to explain the role of upland shrub habitat in the ecology of P. tenuis.
Alternatively, differences in infection risk among habitats could be related to deer density if deer densities were greater in high-risk cover types. However, relative deer pellet densities were, if anything, higher in upland deciduous forest. Thus, cover type effects on infection risk can be largely explained by differences in gastropod abundances, which are primarily influenced by microhabitat differences in moisture and temperature. Conditions favoring gastropods should similarly enhance the survival of L1 larvae (Lankester, Reference Lankester2010).
Although correlative, research from VNP (this study and Cyr et al. Reference Cyr, Windels, Moen and Warmblood2014) is the first to demonstrate relationships between habitat, gastropod abundances and infection patterns in deer within a single ecosystem. One caveat is that the survey units used to quantify gastropod abundances across habitat types in VNP were not the same units used for pellet surveys, thus the link between gastropod abundances and infection patterns is inferred rather than explicitly tested. Variations in gastropod abundance by habitat have frequently been reported (Lankester and Anderson, Reference Lankester and Anderson1968; Kearney and Gilbert, Reference Kearney and Gilbert1978; Raskevitz et al. Reference Raskevitz, Kocan and Shaw1991), but have never been linked to patterns in P. tenuis infection in deer. Population-level prevalence has been linked to coarse, habitat-level attributes at a regional level (Wasel et al. Reference Wasel, Samuel and Crichton2003; Maskey, Reference Maskey2008). However, these studies summarized habitat variables at the Deer Management Unit level, and thus did not capture variation in habitat composition and infection risk present at the scale of individual deer home ranges. The availability of data on both gastropods and deer infection within VNP, combined with fine-scale spatial analysis, allowed for a unique view of the ecology of P. tenuis infection dynamics. In addition, we were able to build on previous work highlighting the role of forests in transmission (Wasel et al. Reference Wasel, Samuel and Crichton2003; Maskey, Reference Maskey2008), and demonstrate that specific forest types are more suitable for creating transmission opportunities.
It is possible that the lower prevalence observed outside of VNP (40%) compared to within the park (76%) could be explained by differences in forest composition and structure resulting from forest management practices. Commercial timber harvest has not occurred within VNP since the late 1960s/early 1970s. Thus, forests within VNP are dominated by closed-canopy deciduous and mixed-conifer stands that are at least 60–80 years old. Such closed-canopy forests may create more favourable environments for gastropods (Nankervis et al. Reference Nankervis, Samuel, Schmitt and Sikarskie2000). Areas outside the park are primarily managed for pulpwood production, which tends to create more early successional habitats dominated by upland deciduous species such as aspen and birch (Kurmis et al. Reference Kurmis, Webb and Merriam1986). To that effect, survey units outside the park were characterized by ~25% less upland conifer (high-risk) forest and ~21% more upland deciduous (low-risk) forest than units within VNP. Active forest management also creates favourable conditions for white-tailed deer (Diefenbach and Shea, Reference Diefenbach, Shea and Hewitt2011), though relative deer densities did not differ inside v. outside the park during our study. Thus, we suggest that forest management may impact P. tenuis infection dynamics through effects on forest type and canopy closure, which both impact P. tenuis transmission opportunities by modifying thermal microenvironments, gastropod abundance and/or L1 larvae survival. The relationship between forest management and P. tenuis infection dynamics warrants future investigation, especially as a potential strategy to minimize transmission between deer and declining moose populations.
Environmental risk factors for F. magna infection
Deer infection risk for F. magna was primarily affected by the availability of wet habitats, such as marshes and wet meadows. Other studies also highlight the importance of wetter areas in producing higher prevalence within deer (Mulvey et al. Reference Mulvey, Aho, Lydeard, Leberg and Smith1991) or high densities of aquatic intermediate hosts (Pybus, Reference Pybus, Samuel, Pybus and Kocan2001). However, we were able to identify specific types of wetlands, such as RFAMs and wet meadows, that were correlated with infection risk. The pattern could be related to three factors: the distribution of intermediate host snails, the seasonal abundance of aquatic plants palatable to deer and/or the permanence of water within wetlands.
We suggest that the importance of RFAMs was not due to the distribution of intermediate hosts because lymnaeid snails were likely present in the majority of shallow aquatic habitats in VNP (Laursen et al. Reference Laursen, Averback and Conboy1989; Dunkel et al. Reference Dunkel, Rognlie, Johnson and Knapp1996). Lymnaeids are found in a variety of habitats with slow moving water, pH 6–8·2, muddy sediments and vegetation (Laursen et al. Reference Laursen, Averback and Conboy1989; Dunkel et al. Reference Dunkel, Rognlie, Johnson and Knapp1996; Pybus, Reference Pybus, Samuel, Pybus and Kocan2001). Although low pH may explain why bogs and peatlands were not correlated with infection risk for deer (Jeglum, Reference Jeglum1971), lymnaeid snails were likely abundant in most shallow aquatic habitats with relatively neutral pH (e.g. RFAMs, seasonally flooded swamps and emergent marshes). Field confirmations of lymnaeid snail distributions within northern Minnesota are needed to better understand the availability of intermediate hosts across habitat types.
The composition of aquatic vegetation communities could explain the positive correlation between infection risk and RFAMs if deer foraging preferences increase the likelihood of exposure in certain habitats. In general, deer forage on aquatic vegetation in 70–90% of visits to aquatic habitats (Hennings, Reference Hennings1977 and references therein), and RFAMs are characterized by four submerged aquatic plants palatable to deer (Potamogeton ssp., Nuphar lutea ssp. variegatum, Brasenia schreberi and Nymphaea odorata, Skinner and Telfer 1974, Hennings Reference Hennings1977, Fraser et al. Reference Fraser, Chavez and Paloheimo1984). However, deer also feed on a number of emergent aquatic plants not solely found in RFAMs (i.e. Equisetum fluviatile, Carex ssp., Sparganium ssp., and others), though feeding on emergent aquatic plants occurs predominantly in mid-May (Hennings, Reference Hennings1977). In late June to mid-July, deer switch to feeding on submergent plants commonly found in RFAMs. This time period would coincide with the current year's F. magna metacercariae production, at which point the parasite is infective to deer. F. magna requires ~75 days at a minimum to develop from egg to metacercariae (Swales, Reference Swales1935; Pybus, Reference Pybus, Samuel, Pybus and Kocan2001 and references therein). If eggs begin development in late April or early May after ice melts, then the current year's metacercariae formation would begin in late June or early July, coinciding with the timeframe that deer begin feeding on submerged plants found in RFAMs. Neither aquatic feeding by deer nor exact time frames for metacercariae production in the field are well understood.
Alternatively, wetlands that do not remain permanently flooded may be unsuitable habitat for F. magna. By definition, only RFAMs are permanently flooded, though some wet meadows, emergent marshes and seasonally flooded swamps may retain water permanently with depths <0·5 m (Faber-Langendoen et al. Reference Faber-Langendoen, Aaseng, Hop, Lew-Smith and Drake2007). These wetlands may be more subject to periodic drawdowns of water. Fluctuations in water levels could potentially disrupt F. magna's life cycle given that both the miracidia and cercariae life stages are free-swimming (Pybus, Reference Pybus, Samuel, Pybus and Kocan2001). In addition, even small fluctuations in water levels may expose encysted metacercariae to air given that most tend to encyst within 3 cm of the water's surface (Swales, Reference Swales1935). Exposure to direct sunlight for 8 h results in metacercariae death in a related trematode, Fasciola hepatica (Suhardono et al. Reference Suhardono, Roberts and Copeman2006). In addition, desiccation reduces viability of metacercariae. Even in high humidity, only <15% of F. hepatica metacercariae remain viable after 5 weeks in 20 °C air (Suhardono et al. Reference Suhardono, Roberts and Copeman2006). Thus, environmental conditions in intermittently flooded wetlands may limit the availability of snails, prevent embryonation and hatching of eggs, reduce survival of metacercariae, and overall, disrupt the life cycle of F. magna (Swales, Reference Swales1935; Pybus, Reference Pybus, Samuel, Pybus and Kocan2001; Suhardono et al. Reference Suhardono, Roberts and Copeman2006). For these reasons, permanently flooded wetlands, such as RFAMs, may be more ideal of the transmission of F. magna to deer. However, more research will be necessary to distinguish between the effects of water levels, deer foraging preferences and snail distributions.
Infection risk to moose
Moose are a dead-end host for both meningeal worm and liver flukes, and these parasites are a significant cause of mortality either through direct mortality or via interactions with other factors, such as predation or heat stress (Aho and Hendrickson, Reference Aho and Hendrickson1989; Murray et al. Reference Murray, Cox, Ballard, Whitlaw, Lenarz, Custer, Barnett and Fuller2006; Lankester, Reference Lankester2010; Wünschmann et al. in press). In addition, the impact of P. tenuis on moose populations may increase in the coming decades because its range is expected to expand northward into boreal forests in Canada as a result of climate change (Pickles et al. Reference Pickles, Thornton, Feldman, Marques and Murray2013).
Moose are most likely to acquire both parasites in mid-summer to autumn, after sufficient time has passed during the growing season for the parasites to complete their life cycle (Lankester and Samuel, Reference Lankester, Samuel, Franzmann and Schwartz1998). In the summer, moose in Minnesota spend the majority of their time in mixed conifer-deciduous (i.e., upland conifer) forests (Lenarz et al. Reference Lenarz, Wright, Schrage and Edwards2011; Cyr et al. Reference Cyr, Windels, Moen and Warmblood2014), indicating that there are substantial opportunities for moose to be infected by P. tenuis in these high-risk areas. In contrast, VNP moose spend ~10% of time in low-risk lowland conifer forests, though use may increase in warmer weather (Cyr et al. Reference Cyr, Windels, Moen and Warmblood2014; McCann et al. Reference McCann, Moen and Windelsin review). For F. magna, moose and deer share the same seasonal preferences for aquatic plants characteristic of RFAMs, suggesting that both moose and deer experience similar spatial and temporal F. magna infection risk correlated with RFAMs (Fraser et al. Reference Fraser, Thompson and Arthur1982).
Historically, deer density has been used as an indicator of moose infection risk. Only a few studies have confirmed a positive correlation between deer density and prevalence, whereas other studies fail to find this relationship (reviewed in Pybus, Reference Pybus, Samuel, Pybus and Kocan2001; Lenarz, Reference Lenarz, DonCarlos, Kimmel, Lawrence and Lenarz2009; Lankester, Reference Lankester2010). We did not find deer pellet density to be a significant predictor of deer infection risk for either parasite. However, most studies showing a link between deer density and infection were much more regional in scale (P. tenuis:Wasel et al. Reference Wasel, Samuel and Crichton2003; Maskey, Reference Maskey2008; F. magna: Peterson et al. Reference Peterson, Lankester, Kie and Bowyer2013). Our measure of relative deer pellet densities reflected both absolute density and, importantly, habitat selection by individual deer. Hence, our measure of deer density may encompass very different aspects of deer biology than density indices that are calculated at a broader spatial scale.
Despite conflicting evidence about links between deer density and moose infection risk (Lenarz, Reference Lenarz, DonCarlos, Kimmel, Lawrence and Lenarz2009), the Minnesota Moose Management Plan (MNDNR, 2011) proposes that deer densities should be maintained below 4 deer km−2 in order to minimize P. tenuis transmission risk to moose (Aho and Hendrickson, Reference Aho and Hendrickson1989, 2011; Whitlaw and Lankester, Reference Whitlaw and Lankester1994). Conflicting evidence likely emerges because the role of the environment in the parasite’s ecology is largely overlooked in favour of using deer density as the primary indicator of risk. However, it may be that deer density is only important in areas where the environment is appropriate for the survival of gastropods and free-living L1 larvae, and hence, transmission. Indeed, Maskey (Reference Maskey2008) found that deer density and moose population growth were negatively correlated only in regions of North Dakota where environmental and climatic variables were suitable for P. tenuis transmission. Our results support the idea that ecological variables outweigh density dependent factors in the transmission dynamics of these parasites, which suggests that parasite control strategies should focus on habitat characteristics as well as deer density. In addition, we demonstrate that utilizing infection data at a high spatial resolution can yield valuable insights about the environmental conditions required for successful transmission. These insights enhance our understanding of the ecology of P. tenuis and F. magna, and can be used to generate testable hypotheses about the mechanisms by which the environment influences complex parasite life cycles.
ACKNOWLEDGEMENTS
The authors thank T. Harris for useful suggestions and comments on statistical analysis and drafts of this manuscript. The authors also thank C. Eckman, B. Henning, D. Morris, and D. Ruiz for field assistance.
FINANCIAL SUPPORT
This research was funded by Minnesota's Clean Water, Land, and Legacy Amendment, Voyageurs National Park, and Minnesota's Environmental and Natural Resources Trust Fund.