Introduction
The family Dipterocarpaceae consists of 16 genera and nearly 600 species, mostly found in South and South-East Asia where they are the leading species group on 85% of forested land (Appanah & Turnbull Reference Appanah and Turnbull1998). Dipterocarps exhibit supra-annual mass-flowering events that occur in irregular intervals of 2–10 y, normally involving many dipterocarp and other related species (Ashton et al. Reference Ashton, Givnish and Appanah1988). This phenomenon is exclusive to ever-wet climate regions of South-East Asia and most pronounced in West Malesia. Floristically similar forests in South Asia and parts of Thailand, where dry and wet seasons are distinct, do not exhibit mass-flowering (Ashton Reference Ashton1988, Kurten et al. Reference Kurten, Bunyavejchewin and Davies2018). Mast-fruiting is thought to be a predator satiation strategy (Archibald et al. Reference Archibald, McAdam, Boutin, Fletcher and Humphries2012), which is supported by empirical data (Curran & Leighton Reference Curran and Leighton2000, Naito et al. Reference Naito, Kanzaki, Numata, Obayashi, Konuma, Nishimura, Ohta, Tsumura, Okuda, Lee and Muhammad2008, Sun et al. Reference Sun, Chen, Hubbell, Wright and Noor2007). However, it has been proposed that several rather than a single factor have shaped the evolution of mass-flowering, including pollination success and high outcrossing rates (Ghazoul et al. Reference Ghazoul, Liston and Boyle1998, Kelly & Sork Reference Kelly and Sork2002, Maycock et al. Reference Maycock, Thewlis, Ghazoul, Nilus and Burslem2005, Pesendorfer et al. Reference Pesendorfer, Koenig, Pearse, Knops and Funk2016, Sakai Reference Sakai2002).
The mechanism that precipitates mass-flowering is still subject to debate. Ashton et al. (Reference Ashton, Givnish and Appanah1988) proposed that inter-annual climate anomalies would be candidates for a trigger mechanism, and they were the first to suggest that a drop in minimum night-time temperature may be a plausible trigger based on their data from the Malay Peninsula, supported by subsequent studies (Numata et al. Reference Numata, Yasuda, Okuda, Kachi and Noor2003, Yasuda et al. Reference Yasuda, Matsumoto, Osada, Ichikawa, Kachi, Tani, Okuda, Furukawa, Nik and Manokaran1999). However, others found no associations with low-temperature events, instead pinpointing lack of rainfall as a plausible trigger (Brearley et al. Reference Brearley, Proctor, Suriantata, Dalrymple and Voysey2007, Sakai et al. Reference Sakai, Harrison, Momose, Kuraji, Nagamasu, Yasunari, Chong and Nakashizuka2006).
Both low minimum temperatures and lack of rainfall are correlated with the El Niño Southern Oscillation (ENSO), which brings dry air into Malesia, creating drought conditions and cloudless skies causing night-time temperatures to drop. The ENSO index has been shown to correlate reasonably well with mass-flowering events (Appanah Reference Appanah1993, Ashton et al. Reference Ashton, Givnish and Appanah1988, Cannon et al. Reference Cannon, Curran, Marshall and Leighton2007, Curran et al. Reference Curran, Caniago, Paoli, Astianti, Kusneti, Leighton, Nirarita and Haeruman1999, Wich & Van Schaik Reference Wich and van Schaik2000). The positive association of mass-flowering with El Niño events is not consistent throughout the region, however. Yasuda et al. (Reference Yasuda, Matsumoto, Osada, Ichikawa, Kachi, Tani, Okuda, Furukawa, Nik and Manokaran1999) and Numata et al. (Reference Numata, Yasuda, Okuda, Kachi and Noor2003) observed mass-flowering events during the opposite La Niña anomalies, while others found no association (Hamann Reference Hamann2004, Numata et al. Reference Numata, Yasuda, Okuda, Kachi and Noor2003). The strongest associations with El Niño are observed in eastern Malesia weakening westward (Wich & Van Schaik Reference Wich and van Schaik2000). In summary, there is significant spatial and temporal variability in dipterocarp mass-flowering across South-East Asia.
To better explain regional differences in patterns of mass-flowering, we test the hypothesis that climate variables may act as trigger in a cumulative way, rather than as a direct-trigger mechanism. The proposed mechanism tested in this study is conceptually similar to temperature accumulation in spring that triggers leaf-out in temperate deciduous trees when a heat-sum threshold is exceeded (Rathcke & Lacey Reference Rathcke and Lacey1985). A plausible cumulative-trigger mechanism in dipterocarps could be based on tracking a variable resource, such as light, which can be a limiting factor for photosynthate production (Ashton et al. Reference Ashton, Givnish and Appanah1988, Ichie et al. Reference Ichie, Kenta, Nakagawa, Sato and Nakashizuka2005, Newbery et al. Reference Newbery, Chuyong and Zimmermann2006, Wich & Van Schaik Reference Wich and van Schaik2000). Here, we re-examine potential environmental cues of mass-flowering in different regions of South-East Asia and compare a classical direct-environmental-trigger model with an alternative cumulative-trigger model of mass-flowering. Note that we do not propose that resource availability is the primary driver or evolutionary cause of mass-flowering. Rather, we test whether a cumulative model that tracks a variable resource can serve as a trigger mechanism that has other primary evolutionary benefits
Materials and methods
Phenology data
We compiled flowering or fruiting data from published literature at 11 study sites in South-East Asia (Figure 1, Table 1). The data sources include observations from five long-term ecological plots and flowering records from six general geographic areas in Peninsular Malaysia, Borneo and northern Sumatra. Few of these records were available for individual species, and we therefore perform our analysis at the community level, focusing on dipterocarps only. We included studies that involve at least 10 y of data and at least three mass-flowering events. The average length of the 11 time series we compiled was 29 y, excluding flowering data prior to 1950 to ensure high quality of climate data, which relies on a sufficiently dense network of weather stations.
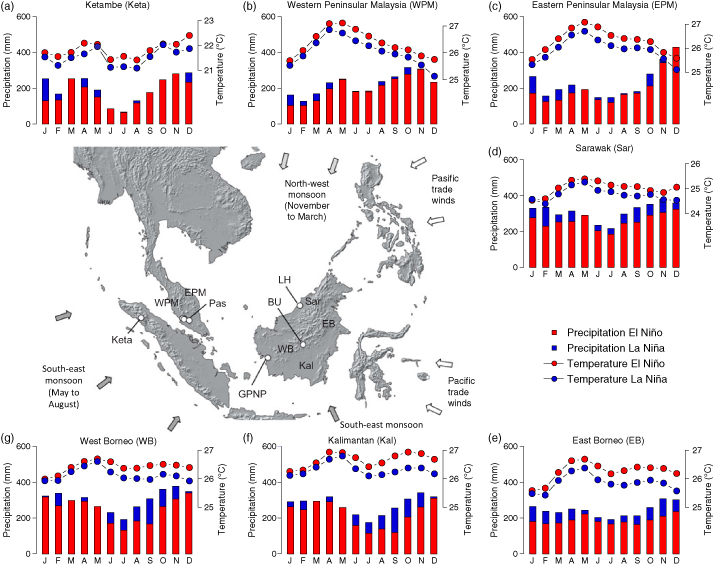
Effects of El Niño and La Niña on regional climate in South-East Asia. The map shows long-term ecological monitoring plots and regions corresponding to data sources. Climate diagrams are for the 1950–2002 period with El Niño years in 1953, 1965, 1969, 1972, 1977, 1982–83, 1987, 1991-1994, 1997, 2002 and La Niña years in 1950, 1955–56, 1962, 1964, 1971, 1973–75, 1988–89, 1996, 1999, 2000. The climate diagrams show monthly average precipitation and temperature during El Niño (red) and La Niña (blue) for the following sites and regions clockwise: Ketambe (a), Western Peninsular Malaysia (b), Eastern Peninsular Malaysia (c), Sarawak (d), East Borneo (e), Kalimantan (f), West Borneo (g).

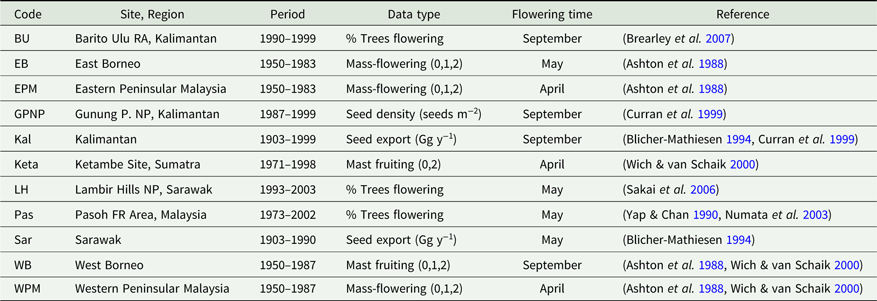
Dipterocarp flowering and fruiting. These data are for the long-term ecological monitoring plots in Peninsular Malaysia (Pas), central Kalimantan (BU), West Kalimantan (GPNP), Sarawak (LH), North Sumatra (Keta) and regions (Kal, Sar, WPM, EPM, WB, EB) in South-East Asia describing time period, data type, primary flowering times (although flowering may occur in April and September) and references of data origin. For sites with seed data and September flowering times (GPNP, Kal, WB), flowering was assumed to occur a year prior. Mass-flowering (0,1,2) or mast fruiting (0,1,2) indicates presence or absence and intensity of flowering/fruiting events with 0 indicating absence, 1 indicating presence of minor flowering/fruiting event and 2 indicating presence of a major flowering/fruiting event

The flowering data were reported in different units, including the mass of seed exported for various Shorea species used for food products, cosmetics and lubricants (Blicher-Mathiesen Reference Blicher-Mathiesen1994). Other regional data are reported as minor, major, or no flowering for each year. Data from long-term ecological plots were recorded either as per cent of dipterocarp trees or species flowering each year. For our analysis, we converted all data to a binary response variable, focusing on major flowering events (top quartile of all observations for a specific site where flowering was measured quantitatively). When data were reported as major/minor, we accepted those classifications converting major events to one and minor or no flowering to zero (Appendix 1).
Climate data
We use two sources of climate data for analysis, daily weather station data and monthly interpolated climate grids. Monthly variables for study sites and regions were extracted from the CRU 2.1 database (Mitchell & Jones Reference Mitchell and Jones2005). We used precipitation (mm), cloud cover (%), and minimum temperature (°C) as putative predictors. Daily minimum night-time temperature was directly obtained from a global weather station database (NCDC 2013). For the long-term ecological plots, the following weather stations were used: Gunung Palung: USAF ID 966150, 965810 (the second station used to fill missing data); Barito Ulu: USAF ID 966550; Pasoh: USAF ID 486470; Lambir Hills: USAF ID 964490; and Ketambe: USAF ID 960350. For regional data, we used averages of all stations located within the region and that covered at least 60% of the data period (number of stations in parentheses): East Borneo (6), West Borneo (7), East Peninsular Malaysia (6), West Peninsular Malaysia (9), Kalimantan (5), Sarawak (6).
Beside climate variables as predictors for flowering events, we also use El Niño indices. These indices may be measured with greater accuracy than the resulting climate patterns, and/or they may stand as proxies for climate variables that we do not measure. We use two indices, the Southern Oscillation Index (SOI), and the El Niño Region 3 anomaly index (NINO3) (Climate Prediction Center 2012). SOI is computed using a standardized monthly sea-level air pressure difference between Tahiti and Darwin (Bureau of Meteorology 2013). Values below −8 signify an El Niño phase and values above +8 signify a La Niña phase. The NINO3 index is calculated using the average monthly sea surface temperatures of the eastern equatorial Pacific region enclosed by the latitudes 5°N to 5°S and the longitudes 150°W to 90°W (Trenberth Reference Trenberth1997). The periods where the anomalies for the running average over a period of 5 mo exceed +0.5°C are defined as an El Niño phase and an anomaly below −0.5°C is interpreted as La Niña phase (Trenberth Reference Trenberth1997). We should note that all putative predictor variables for the direct-environmental-trigger or cumulative-resource-tracking model have moderate to high collinearity and should be considered proxies for unknown climate factors that serve as biological triggers or resources.
Direct-environmental-trigger model
We assume a logistic rather than a linear relationship between the environmental-trigger and the probability of a flowering event. The s-shaped relationship implies that a low trigger value is very unlikely to precipitate a flowering event, followed by a short transition of intermediate values to a high probability of a flowering at high trigger values (or vice versa for some candidate variables). Thus, our environmental-trigger model conforms to the function: y = 1/(1+e− (a+bx)), where y is the probability of flowering, x is the environmental predictor variable, the parameter a represents the intercept with y, and the parameter b represents the steepness of the transition from low to high probabilities.
Because the flowering data are recorded annually, and climate data are given as monthly or daily records, some temporal alignments are required. For seed records, we assume that flowering occurred 3 mo prior (based on observations by Brearley et al. Reference Brearley, Proctor, Suriantata, Dalrymple and Voysey2007, Hamann Reference Hamann2004, Sakai et al. Reference Sakai, Harrison, Momose, Kuraji, Nagamasu, Yasunari, Chong and Nakashizuka2006). If flowering-time data were not reported, flowering was assumed to occur in one of two periods with peak times around May in northern and eastern sites and in September in southern Borneo sites (Table 1). To capture the putative cue of flowering, we analyse climate data for the 9 mo preceding the peak of flowering period at each site in each year. This ensures that even for early flowering species relative to the peak flowering period, we would capture a climate cue up to 6 mo prior to the flowering event, and a flowering cue is not likely to occur more than 6 mo prior to flowering induction (Ashton et al. Reference Ashton, Givnish and Appanah1988, Brearley et al. Reference Brearley, Proctor, Suriantata, Dalrymple and Voysey2007). Daily data were screened for extreme minimum temperature events (lowest night time temperatures), and monthly data were screened for minimums in monthly averages for precipitation, cloud cover and minimum temperature. As an alternate predictor, means rather than minima of monthly average precipitation, cloud cover and minimum temperature data in the period leading up to the flowering event were also tested. We also used means and minima of the Pacific Ocean surface temperature proxies SOI and NINO3 in the cue model for the 9-mo period preceding flowering.
The quality of the predictive models were evaluated using the Area Under the receiver operating characteristic Curve (AUC) using the ROCR package (Sing et al. Reference Sing, Sander, Beerenwinkel and Lengauer2005) for the R programming environment. Receiver operating characteristics evaluate true positives (where flowering predictions correspond to observed mass-flowering events) versus false positives (Fawcett Reference Fawcett2006). The true positive rate is plotted over the false positive rate, with any model-generated probability between 0 and 1 tested as potential threshold to predict a flowering event. The AUC value is subsequently obtained by integrating the Area Under the Curve. An AUC value of 1 implies a perfect model fit, an AUC value of 0.5 is a random predictor, and an AUC below 0.5 implies a model with more false positives than expected by random chance, i.e. a negative association.
Cumulative-trigger model
In this model we test if climate variables may act as triggers in a cumulative way, rather than as environmental variables directly exceeding a threshold. While we do not propose that the resource status of a plant is the primary driver and reason for mass-flowering, cumulative resource tracking could be a plausible trigger mechanism of mass-flowering that has other primary benefits. Candidate predictors for the cumulative-trigger model were climate proxies for resources that show strong inter-annual variation, specifically light for the production of photosynthate, a plausible limiting resource (Ashton et al. Reference Ashton, Givnish and Appanah1988, Newbery et al. Reference Newbery, Chuyong and Zimmermann2006, Wich & Van Schaik Reference Wich and van Schaik2000). We included cloud cover, precipitation, NINO3 index values and SOI index values (representing El Niño periods). In South-East Asia where rainfall rarely falls below 50 mm mo−1 and on average 150 mm, water is not a limiting resource and the precipitation variable is used here as a proxy for high irradiance when precipitation is low.
We converted the variables to a standardized unit, where the average resource availability was represented by a value of one, with a standard deviation of one. Precipitation, SOI and cloud cover negatively correlate with high levels of irradiance (during dry conditions, El Niño events, and clear skies, respectively) and therefore the inverse of these values was used. The NINO3 index was not inverted as high values represent El Niño events. Monthly resources are added up to a preset flowering threshold, which precipitates a flowering event and resets resources to zero. The model was implemented in the R programming environment with the following algorithm:
 $${\rm{for }} \ \left( {{\rm{i \ in \ 1\!\!:\!nrow}}\left( x \right)} \right)\;\{ r\left[ {i + 1} \right]\; \leftarrow \;{\rm{ifelse(}}r\left[ i \right] \lt ft,\;(x\left[ {i + 1} \right] + r\left[ i \right]),{\rm{ }}\left( {x\left[ {i + 1} \right]} \right))\}
where, x is a vector of monthly resource availability as explained above, r is a vector of the resource accumulated over time, ft is the flowering threshold, and i represents a monthly counter. The flowering threshold ft was calculated as the sum of the resource proxy variable divided by the number of flowering events for each mass-flowering time series. (We confirmed that a cumulative model starting with the first observed flowering event and reset at equal intervals based on the average flowering threshold had no predictive value (AUC = 0.5 ± 0.06) across all sites and variables).
We also developed a second model that makes predictions of the next mass-flowering event including knowledge of when the previous mass-flowering event occurred. This version differed from the algorithm above as it resets the resource to zero when an actual mass-flowering event was observed, regardless of whether the modelled flowering threshold was reached:
 $${\rm{for }}\ \left( {{\rm{i \ in\ 1\!\!:\!nrow}}\left( x \right)} \right)\ {\rm{ }}\{ r\left[ {{\rm{i + 1}}} \right] \leftarrow {\rm{ifelse}}\left( {f\left[ {\rm{i}} \right]{\rm{ = = 0{\hbox ,}\ }} {\left( {r\left[ {{\rm{i + 1}}} \right] + r\left[ {\rm{i}} \right]} \right){\hbox,}\ {\rm{ }}\left( {x\left[ {{\rm{i + 1}}} \right]} \right)} \right)\} $$
where f is a vector of observed mass-flowering events placed in the months of peak flowering according to Table 1.
For model evaluation, we are assuming the same logistic relationship between the value of the cumulative resource counter and the probability of flowering as was used in the trigger model above. The reasoning is similar: we assume that a minimal cumulative value implies a very low flowering probability followed by a rapid s-shaped transition to high flowering probabilities once a certain threshold is exceeded.
Results
Regional climatology and flowering
To visualize regional variation in the effects of El Niño on climate drivers, we plotted climate diagrams for all regions and sites for which we have flowering data (Figure 1). El Niño and La Niña seem to impact the seasonal monsoons in South-East Asia. Those effects vary regionally, and we can distinguish different influences on the north-east- and south-west-facing study sites. In the regions facing the southern Pacific (Figure 1, bottom row: WB, EB, Kal), the divergence between El Niño and La Niña is largest during the second half of the year, with warmer temperatures and less precipitation during the El Niño phase, because of hot air masses being driven into the region during the summer monsoon. In contrast, the north- and east-facing regions (Figure 1, top row: Keta, WPM, EPM, Sar) see the strongest influences of El Niño phases during the north-west monsoon from January to April, when weakened trade winds originating in the South China Sea and the Bay of Bengal, cause reduced precipitation.
These differences in regional effects of El Niño were mirrored in the time of the year when dipterocarps flower in different regions (Table 1). In the south-west-facing regions and study sites (Table 1, WB, Kal, BU and GPNP), flowering is clustered around September, which coincided with the time of the year of El Niño-driven low precipitation anomalies. In the east- and north-facing regions and study sites, flowering occurred around April or May (Table 1, Keta, WPM, EPM, Pas, Sar, LH), which coincided with the time of the year when the El Niño effects are strongest in those regions as well. In summary, regional flowering times were synchronized with where and when El Niño effects are regionally strongest. This association of seasonal flowering times with the regional differences in the strength of the El Niño effect suggested that El Niño related climate phenomena may be a key factor for flowering induction of dipterocarps in South-East Asia.
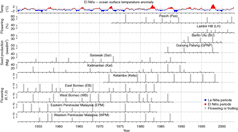
While the seasonal association of flowering with El Niño is readily apparent, the association of interannual flowering events with El Niño were less obvious when visualizing the data for reproductive events (Figure 2). In the monitoring site on the first line (Pas), flowering did not correspond to El Niño periods (in red), where all but one of the mass-flowering events occurred during the normal or the La Niña periods. In fact, mass-flowering throughout the northern and eastern monitoring sites and regions were weakly associated with El Niño periods. Nevertheless, major flowering events observed across the entire study region occurred in 1957–1958, 1968, 1976, 1981–1982, 1997–1998, with three out of five large events falling on or after El Niño years. Large flowering events across South-East Asia occur every 5–12 y, but additional large and small regional events that are not synchronized with other locations are very common.
El Niño Southern Oscillation and dipterocarp flowering events. The raw data and source references are provided in Appendix 1.

Climate as cue versus a proxy for resource availability
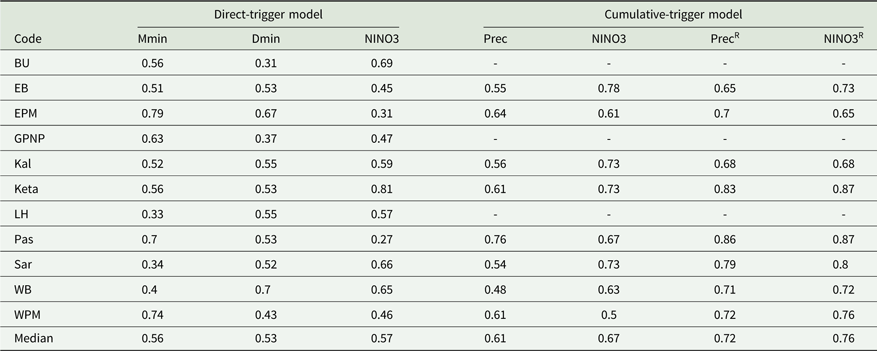
The cumulative-trigger model provided a more robust statistical association with mass-flowering events than the direct-environmental-trigger model (Table 2). The minimum temperature and NINO3 predictor variables for the direct-trigger model yielded only slightly better predictions than expected by random chance (regional median AUCs between 0.53 and 0.57). The alternate El Niño index (SOI) yielded the same AUC value as the NINO3 index. Further, the best predictor variable varied for different regions of the study area. For the Peninsular Malaysian sites (Pas, EPM, WPM), a drop in monthly minimum temperature yielded respectable AUC values between 0.7 and 0.8. For Borneo (BU, Sar, Kal, WB), and Sumatra (Keta), the El Niño index yielded high AUC values between 0.6 and 0.8, while monthly minimum temperature regularly yielded AUC values below 0.5.
AUC values for the direct-environmental-trigger model and the cumulative-trigger model of mass-flowering of dipterocarps. Predictor variables are the coldest monthly minimum temperature (Mmin), coldest daily minimum temperature (Dmin), and El Niño index (NINO3) and precipitation (Prec). The model version with reset (R) of the resource to zero after an observed flowering event indicates the potential predictive accuracy for management applications. AUC values are based on the average probability of flowering for the 9 mo preceding flowering peak reported in Table 1. Refer to Table 1 for the explanation of sites and regions

The predictive ability of the cumulative-trigger model, tracking a resource variable, was somewhat better than the direct-environmental-trigger model overall, with median AUC values of 0.61 for precipitation and 0.67 for the NINO3 index. Cloud cover AUCs were similar to precipitation and SOI was similar to NINO3 as a predictor for resources (not shown). Sites and regions representing Borneo and Sumatra (Kal, EB, WB, Sar, Keta) yielded the highest AUC values for the El Niño index as predictor. The Peninsular Malaysian sites (Pas, EPM, WPM) show better results for precipitation as a proxy for resources. When the date of previous flowering was included in the model, representing information that should be used for predicting future flowering events in practical applications, the model accuracy was improved to a median of 0.76, with some regional predictions approaching high reliability. A comparison of the AUCs using a Student’s t-test concluded that there was a significant improvement on the cumulative models, excluding and including information on previous flowering, over the direct-trigger model (P = 0.04 and P = 0.02 respectively).
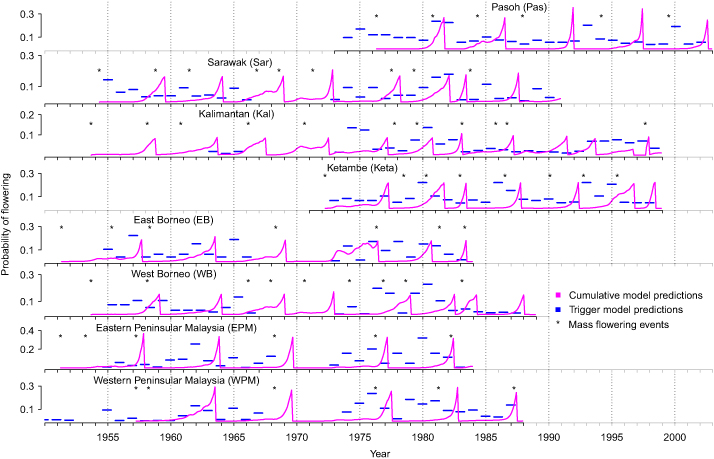
To visually compare the cumulative versus the direct-trigger model predictions, we plotted monthly probabilities of flowering based on a resource accumulation mechanism that uses the NINO3 index as a proxy for resource availability and daily minimum temperature for the direct-trigger model (Figure 3). The flowering probabilities estimated by the direct-trigger model are indicated by horizontal bars (only one value is calculated based on the lowest daily temperature value in the preceding 6–9-mo period). Stars indicate the observed flowering events. For the cumulative tracking model, probabilities increase as the resource counter value increases over time, and the model resets itself when a maximum resource threshold is reached. While exact true positive predictions are only moderately frequent, predictions of flowering events are often just slightly off (± 1 y). This is illustrated in Figure 4, tallying the proportion of correct predictions for the exact year (a) and a 3-y window of ± 1 y around the exact prediction (b).
Direct-environmental-trigger (trigger) and cumulative-trigger (cumulative) model predictions of dipterocarp mass-flowering. For illustrating the cumulative model, we plot monthly probabilities of flowering based on a resource accumulation mechanism that uses the NINO3 index as a proxy for resource availability. For illustrating the direct-trigger model, we plot yearly probabilities based on daily minimum temperature preceding the flowering event (only one value is calculated based on the lowest daily temperature value in the preceding 9-mo period).

The proportion of correct predictions for the exact year (a) and for a 3-y window of ± 1 y around the exact prediction (b) for the cumulative-trigger (Cumulative) and the direct-environmental-trigger (Trigger) models. The proportion of correct predictions is based on modelled probability of flowering shown in Figure 3.

Discussion
The most rigorous evaluation of the cumulative-resource-tracking model (exact prediction, no reset by known flowering events) has slightly higher statistical accuracies than the direct-environmental-trigger model of mass-flowering. A resource reset to zero for known flowering events, and allowing for a window of ± 1 y around the exact prediction substantially improves the statistics in favour of the alternative hypothesis of a cumulative-trigger model that tracks resource availability, while the direct-environmental-trigger model is only slightly improved. In addition to the statistical evaluation, additional observations also point to a cumulative resource tracker as a plausible mechanism for triggering dipterocarp mass-flowering in South-East Asia.
First, it is widely documented that minor flowering events precede mass-flowering in dipterocarps (Brearley et al. Reference Brearley, Proctor, Suriantata, Dalrymple and Voysey2007, Curran et al. Reference Curran, Caniago, Paoli, Astianti, Kusneti, Leighton, Nirarita and Haeruman1999, Hamann Reference Hamann2004, Sakai et al. Reference Sakai, Harrison, Momose, Kuraji, Nagamasu, Yasunari, Chong and Nakashizuka2006), which usually do not lead to fruit development because of low pollen density (Maycock et al. Reference Maycock, Thewlis, Ghazoul, Nilus and Burslem2005). This phenomenon is more easily explained by cumulative tracking, rather than a single environmental cue driving flowering induction. Early flowering could plausibly be caused by some trees reaching the flowering threshold somewhat earlier than the main population in a cumulative-trigger model. A direct-environmental-trigger model does not offer an explanation for the frequent observations of minor flowering events preceding mass-flowering.
Second, a key observation that emerged in our analysis is that seasonal flowering times in dipterocarps are determined by how the north-west and south-east monsoons mediate El Niño phases. Notably, the climate seasonality is similar throughout the study area with minimal precipitation in July and the highest temperatures around May. Yet, flowering times of dipterocarps do not show regional correspondence to this moderate seasonality. Rather, they are associated with the time of the year that regionally shows the largest anomalies during El Niño phases. El Niño phases reverse the Pacific trade winds, creating a failure in the south-east monsoon from May to August in South-East Asia (Fan et al. Reference Fan, Mann and Ammann2009), while La Niña intensifies the monsoon. We interpret this observation as favouring a cumulative model over the direct-trigger hypothesis. The inter-annual variance in variables that we tested as proxies rather than absolute values of climate variables appear to be a key factor for flowering induction of dipterocarps. Large inter-annual anomalies would also trigger flowering in trees that have a slightly different individual resource status, thereby playing a key role in synchronizing flowering in a species population.
Third, a cumulative-trigger model could potentially be useful in explaining interspecies masting during pulses of high resource availability, where most forest species, not just dipterocarps, are able to reach flowering thresholds and flower in synchrony. Even if flowering thresholds vary significantly among species, a large enough resource pulse would be able to synchronize different species of dipterocarps as well as other species, resulting in a phenomenon known as a general flowering event in dipterocarp forests of South-East Asia.
Fourth, a cumulative-trigger model could also offer a plausible evolutionary path toward mass-flowering that is not apparent for a direct-environmental trigger model. Seasonal flowering is an evolutionary stable strategy, not easily invaded by an alternative (mutant) mass-flowering strategy without the initial advantage of predator satiation. However, resource availability for fruit and seed production could offer an intermediate evolutionary advantage (e.g. documented by Isagi et al. Reference Isagi, Sugimura, Sumida and Ito1997). Dipterocarps have large energy-intensive seeds. If resources are not available to produce a viable seed crop, it might be an evolutionary advantage to accumulate photosynthate resources for a longer period before flowering occurs. Once a certain amount of trees follow an inter-annual flowering pattern, other evolutionary advantages (predator satiation, pollination and outcrossing success) could become the driving forces of natural selection towards longer flowering intervals.
Even though masting species benefit from predator satiation and pollination success in the aseasonal tropics, there is evidence that flowering induction in dipterocarps evolved in the seasonal tropics with annually recurring dry seasons. Flowering and fruit development during the dry season has the advantage that more vulnerable seedlings can establish during the subsequent wet season without drought stress (Kurten et al. Reference Kurten, Bunyavejchewin and Davies2018). A cumulative-trigger mechanism, as examined in this study, could rely on a biological mechanism already in place to track annually recurring dry and wet periods in seasonal environments. Evolving different flowering thresholds under aseasonal conditions may have intermediate benefits and allow the subsequent evolution of synchronized mass-flowering with varying species-specific intervals, driven by new selective factors, such as predator satiation and pollination success. Ultimately, a combination of factors is likely to control mass-flowering patterns in dipterocarps and other species. Models that include additional factors could yield better predictions, and additional factors could include a combinations of general environmental conditions such as temperature and precipitation expressed in moving averages for a time period preceding flowering or environmental extremes that may act as trigger events (Brearley et al. Reference Brearley, Proctor, Suriantata, Dalrymple and Voysey2007, Sakai et al. Reference Sakai, Harrison, Momose, Kuraji, Nagamasu, Yasunari, Chong and Nakashizuka2006). The models could also incorporate local information if available, such as the timing and intensity of previous masting events, as well as soil and hydrology data to better estimate resource availability.
Lastly, understanding and predicting mass-flowering in South-East Asian dipterocarps has important practical applications. Dipterocarps produce recalcitrant short-lived seeds that pose difficult logistical challenges for reforestation and conservation of dipterocarp resources (Appanah & Turnbull Reference Appanah and Turnbull1998, Kettle et al. Reference Kettle, Ghazoul, Ashton, Cannon, Chong, Diway, Faridah, Harrison, Hector, Hollingsworth, Koh, Khoo, Kitayama, Kartawinata, Marshall, Maycock, Nanami, Paoli, Potts, Sheil, Tan, Tomoaki, Webb, Yamakura and Burslem2010). A recent major general flowering event in Borneo, the first in 12 y, went unutilized for lack of time to mobilize resources for seed collection (Kettle et al. Reference Kettle, Ghazoul, Ashton, Cannon, Chong, Diway, Faridah, Harrison, Hector, Hollingsworth, Koh, Khoo, Kitayama, Kartawinata, Marshall, Maycock, Nanami, Paoli, Potts, Sheil, Tan, Tomoaki, Webb, Yamakura and Burslem2010). Better predictive models of mass-flowering events are therefore needed to improve forest resource management. In this paper, we propose a model that relies on relatively easy to obtain predictor variables (climate variables and a record of previous mass flowering events to determine flowering thresholds). We should note, however, that our cumulative tracking model did not regularly yield levels of predictive accuracy that would be required for local management. This is not unexpected, because our data, compiled from the published literature, relies on averages across multiple species and different record types of flowering events.
If the probability of the next flowering event could consistently be estimated with reasonably high precision (AUC > 0.8) for individual regions, forestry operations and seed collections for conservation purposes could be planned accordingly. Future research could apply our proposed cumulative-trigger model to species-specific flowering data and corresponding local weather station data, which could yield more accurate predictive models. Further, models that use continuous rather than categorical flowering or fruiting data could yield closer relationships between climate variables and flowering intensity (Monks et al. Reference Monks, Monks and Tanentzap2016). Another possible modification to a cumulative model could take into account that resources may not be depleted completely after fruiting events (Monks et al. Reference Monks, Monks and Tanentzap2016), setting the resource allocation to reproduction proportional to the amount of stored resources, or proportional to the observed flowering intensity if such data are available.
Financial support
Funding for this study was provided by the Canadian Natural Sciences and Engineering Research Council (NSERC) Discovery Grant RGPIN-330527-07 through the Government of Canada and the Alberta Ingenuity Grant #200500661 through the Government of Alberta.
Appendix 1
Flowering and fruiting data from dipterocarp forests in several long-term ecological monitoring plots and regions in South-East Asia. Several site and regional data came from a few sources and were combined for the analysis. Other sites close in proximity were also combined. Sites 1 through 5 were combined to form Pasoh Forest Reserve Area by averaging the flowering data by years. We did the same for the regions: Kalimantan (region 10–11) and West Borneo (region 14–15). The data description and reference for each site and region is as follows: (1) Gombak Forest Reserve (Pas), Selangor, Malaysia. % of 16 species of Shorea trees flowering (Yap & Chan Reference Yap, Chan, Bawa and Hadey1990, Fig. 3.3). (2) Ampang Forest Reserve (Pas), Selangor, Malaysia. % of 16 species of Shorea trees flowering (Yap & Chan Reference Yap, Chan, Bawa and Hadey1990, Fig. 3.3). (3) Kepong Forest Research Site (Pas), Selangor, Malaysia. % of 16 species of Shorea trees flowering (Yap & Chan Reference Yap, Chan, Bawa and Hadey1990, Fig. 3.3). (4) Pasoh Forest Reserve (Pas), Negri Sembilan, Malaysia. % of 16 species of Shorea trees flowering (Yap & Chan Reference Yap, Chan, Bawa and Hadey1990, Fig. 3.3). (5) Pasoh Forest Reserve (Pas), Negri Sembilan, Malaysia. % of community-wide dipterocarp trees flowering (Numata et al. Reference Numata, Yasuda, Okuda, Kachi and Noor2003, Table 1). (6) Ketambe site in the Gunung Leuser National Park (Keta), northern Sumatra, Indonesia. Community-wide masting based on fruit fall on trial (no, major) converted to a scale of 0–2 for no and major events (Wich & Van Schaik Reference Wich and van Schaik2000, Table 2). (7) Barito Ulu Research Area (BU), central Kalimantan, Indonesia. % of trees of 22 dipterocarps species flowering (Brearley et al. Reference Brearley, Proctor, Suriantata, Dalrymple and Voysey2007, Fig. 4a). (8) Lambir Hills National Park (LH), Sarawak, Malaysia. % of 40 species of dipterocarp trees flowering (Sakai et al. Reference Sakai, Harrison, Momose, Kuraji, Nagamasu, Yasunari, Chong and Nakashizuka2006, Fig. 1a). (9) Gunung Palung National Park (GPNP), Kalimantan, Indonesia, seed-fall density (seeds m−2) (Curran et al. Reference Curran, Caniago, Paoli, Astianti, Kusneti, Leighton, Nirarita and Haeruman1999, Fig. 1a). (10) Kalimantan (Kal), Borneo, Indonesia, seed export (Gg y−1) of trees from the Shorea species (Curran et al. Reference Curran, Caniago, Paoli, Astianti, Kusneti, Leighton, Nirarita and Haeruman1999, Fig. 1a). (11) Kalimantan (Kal), Borneo, Indonesia, seed export (Gg y−1) of 18 species of Shorea (Blicher-Mathiesen Reference Blicher-Mathiesen1994, table 4). (12) Sarawak (Sar), Borneo, Malaysia, seed export (Gg y−1) of 18 species of Shorea (Blicher-Mathiesen Reference Blicher-Mathiesen1994, table 4). (13) West Peninsular Malaysia (WPM), community-wide mass-flowering recorded by the forestry departments (no, minor, major flowering) converted to a scale of 0–2 for no, minor and major events (Ashton et al. Reference Ashton, Givnish and Appanah1988, table 4; Wich & Van Schaik Reference Wich and van Schaik2000, Table 2). (14) West Borneo (WB), community-wide mast fruiting based on seed export data (no, minor, major masting) converted to a scale of 0–2 for no, minor and major events, adjusted to reflect flowering a year prior (Ashton et al. Reference Ashton, Givnish and Appanah1988, table 4). (15) West Borneo (WB), community-wide mast fruiting based on seed export data (no, minor, major masting) converted to a scale of 0–2 for no, minor and major events, adjusted to reflect flowering times a year prior (Wich & Van Schaik Reference Wich and van Schaik2000, Table 2). (16) East Peninsular Malaysia (EPM), community-wide mass-flowering recorded by the forestry departments (no, minor, major flowering) converted to a scale of 0–2 for no, minor and major events (Ashton et al. Reference Ashton, Givnish and Appanah1988, table 4). (17) East Borneo (EB), community-wide mass-flowering recorded by the forestry departments (no, minor, major flowering) converted to a scale of 0–2 for no, minor and major events (Ashton et al. Reference Ashton, Givnish and Appanah1988, table 4).