


%20--%3e%3c!DOCTYPE%20svg%20PUBLIC%20'-//W3C//DTD%20SVG%201.0//EN'%20'http://www.w3.org/TR/2001/REC-SVG-20010904/DTD/svg10.dtd'%3e%3csvg%20version='1.0'%20id='Layer_1'%20xmlns='http://www.w3.org/2000/svg'%20xmlns:xlink='http://www.w3.org/1999/xlink'%20x='0px'%20y='0px'%20width='64px'%20height='64px'%20viewBox='5.5%20-3.5%2064%2064'%20enable-background='new%205.5%20-3.5%2064%2064'%20xml:space='preserve'%3e%3cg%3e%3ccircle%20fill='%23FFFFFF'%20fill-opacity='0'%20cx='37.785'%20cy='28.501'%20r='28.836'/%3e%3cpath%20fill='%23595959'%20d='M37.441-3.5c8.951,0,16.572,3.125,22.857,9.372c3.008,3.009,5.295,6.448,6.857,10.314%20c1.561,3.867,2.344,7.971,2.344,12.314c0,4.381-0.773,8.486-2.314,12.313c-1.543,3.828-3.82,7.21-6.828,10.143%20c-3.123,3.085-6.666,5.448-10.629,7.086c-3.961,1.638-8.057,2.457-12.285,2.457s-8.276-0.808-12.143-2.429%20c-3.866-1.618-7.333-3.961-10.4-7.027c-3.067-3.066-5.4-6.524-7-10.372S5.5,32.767,5.5,28.5c0-4.229,0.809-8.295,2.428-12.2%20c1.619-3.905,3.972-7.4,7.057-10.486C21.08-0.394,28.565-3.5,37.441-3.5z%20M37.557,2.272c-7.314,0-13.467,2.553-18.458,7.657%20c-2.515,2.553-4.448,5.419-5.8,8.6c-1.354,3.181-2.029,6.505-2.029,9.972c0,3.429,0.675,6.734,2.029,9.913%20c1.353,3.183,3.285,6.021,5.8,8.516c2.514,2.496,5.351,4.399,8.515,5.715c3.161,1.314,6.476,1.971,9.943,1.971%20c3.428,0,6.75-0.665,9.973-1.999c3.219-1.335,6.121-3.257,8.713-5.771c4.99-4.876,7.484-10.99,7.484-18.344%20c0-3.543-0.648-6.895-1.943-10.057c-1.293-3.162-3.18-5.98-5.654-8.458C50.984,4.844,44.795,2.272,37.557,2.272z%20M37.156,23.187%20l-4.287,2.229c-0.458-0.951-1.019-1.619-1.685-2c-0.667-0.38-1.286-0.571-1.858-0.571c-2.856,0-4.286,1.885-4.286,5.657%20c0,1.714,0.362,3.084,1.085,4.113c0.724,1.029,1.791,1.544,3.201,1.544c1.867,0,3.181-0.915,3.944-2.743l3.942,2%20c-0.838,1.563-2,2.791-3.486,3.686c-1.484,0.896-3.123,1.343-4.914,1.343c-2.857,0-5.163-0.875-6.915-2.629%20c-1.752-1.752-2.628-4.19-2.628-7.313c0-3.048,0.886-5.466,2.657-7.257c1.771-1.79,4.009-2.686,6.715-2.686%20C32.604,18.558,35.441,20.101,37.156,23.187z%20M55.613,23.187l-4.229,2.229c-0.457-0.951-1.02-1.619-1.686-2%20c-0.668-0.38-1.307-0.571-1.914-0.571c-2.857,0-4.287,1.885-4.287,5.657c0,1.714,0.363,3.084,1.086,4.113%20c0.723,1.029,1.789,1.544,3.201,1.544c1.865,0,3.18-0.915,3.941-2.743l4,2c-0.875,1.563-2.057,2.791-3.541,3.686%20c-1.486,0.896-3.105,1.343-4.857,1.343c-2.896,0-5.209-0.875-6.941-2.629c-1.736-1.752-2.602-4.19-2.602-7.313%20c0-3.048,0.885-5.466,2.658-7.257c1.77-1.79,4.008-2.686,6.713-2.686C51.117,18.558,53.938,20.101,55.613,23.187z'/%3e%3c/g%3e%3c/svg%3e)
%20--%3e%3c!DOCTYPE%20svg%20PUBLIC%20'-//W3C//DTD%20SVG%201.0//EN'%20'http://www.w3.org/TR/2001/REC-SVG-20010904/DTD/svg10.dtd'%3e%3csvg%20version='1.0'%20id='Layer_1'%20xmlns='http://www.w3.org/2000/svg'%20xmlns:xlink='http://www.w3.org/1999/xlink'%20x='0px'%20y='0px'%20width='64px'%20height='64px'%20viewBox='5.5%20-3.5%2064%2064'%20enable-background='new%205.5%20-3.5%2064%2064'%20xml:space='preserve'%3e%3cg%3e%3ccircle%20fill='%23FFFFFF'%20fill-opacity='0'%20cx='37.637'%20cy='28.806'%20r='28.276'/%3e%3cg%3e%3cpath%20fill='%23595959'%20d='M37.443-3.5c8.988,0,16.57,3.085,22.742,9.257C66.393,11.967,69.5,19.548,69.5,28.5c0,8.991-3.049,16.476-9.145,22.456%20C53.879,57.319,46.242,60.5,37.443,60.5c-8.649,0-16.153-3.144-22.514-9.43C8.644,44.784,5.5,37.262,5.5,28.5%20c0-8.761,3.144-16.342,9.429-22.742C21.101-0.415,28.604-3.5,37.443-3.5z%20M37.557,2.272c-7.276,0-13.428,2.553-18.457,7.657%20c-5.22,5.334-7.829,11.525-7.829,18.572c0,7.086,2.59,13.22,7.77,18.398c5.181,5.182,11.352,7.771,18.514,7.771%20c7.123,0,13.334-2.607,18.629-7.828c5.029-4.838,7.543-10.952,7.543-18.343c0-7.276-2.553-13.465-7.656-18.571%20C50.967,4.824,44.795,2.272,37.557,2.272z%20M46.129,20.557v13.085h-3.656v15.542h-9.944V33.643h-3.656V20.557%20c0-0.572,0.2-1.057,0.599-1.457c0.401-0.399,0.887-0.6,1.457-0.6h13.144c0.533,0,1.01,0.2,1.428,0.6%20C45.918,19.5,46.129,19.986,46.129,20.557z%20M33.042,12.329c0-3.008,1.485-4.514,4.458-4.514s4.457,1.504,4.457,4.514%20c0,2.971-1.486,4.457-4.457,4.457S33.042,15.3,33.042,12.329z'/%3e%3c/g%3e%3c/g%3e%3c/svg%3e)
%20--%3e%3c!DOCTYPE%20svg%20PUBLIC%20'-//W3C//DTD%20SVG%201.0//EN'%20'http://www.w3.org/TR/2001/REC-SVG-20010904/DTD/svg10.dtd'%3e%3csvg%20version='1.0'%20id='Layer_1'%20xmlns='http://www.w3.org/2000/svg'%20xmlns:xlink='http://www.w3.org/1999/xlink'%20x='0px'%20y='0px'%20width='64px'%20height='64px'%20viewBox='5.5%20-3.5%2064%2064'%20enable-background='new%205.5%20-3.5%2064%2064'%20xml:space='preserve'%3e%3cg%3e%3ccircle%20fill='%23FFFFFF'%20fill-opacity='0'%20cx='36.924'%20cy='28.403'%20r='28.895'/%3e%3cpath%20fill='%23595959'%20d='M37.442-3.5c8.99,0,16.571,3.085,22.743,9.256C66.393,11.928,69.5,19.509,69.5,28.5c0,8.992-3.048,16.476-9.145,22.458%20C53.88,57.32,46.241,60.5,37.442,60.5c-8.686,0-16.19-3.162-22.513-9.485C8.644,44.728,5.5,37.225,5.5,28.5%20c0-8.762,3.144-16.343,9.429-22.743C21.1-0.414,28.604-3.5,37.442-3.5z%20M12.7,19.872c-0.952,2.628-1.429,5.505-1.429,8.629%20c0,7.086,2.59,13.22,7.77,18.4c5.219,5.144,11.391,7.715,18.514,7.715c7.201,0,13.409-2.608,18.63-7.829%20c1.867-1.79,3.332-3.657,4.398-5.602l-12.056-5.371c-0.421,2.02-1.439,3.667-3.057,4.942c-1.622,1.276-3.535,2.011-5.744,2.2%20v4.915h-3.714v-4.915c-3.543-0.036-6.782-1.312-9.714-3.827l4.4-4.457c2.094,1.942,4.476,2.913,7.143,2.913%20c1.104,0,2.048-0.246,2.83-0.743c0.78-0.494,1.172-1.312,1.172-2.457c0-0.801-0.287-1.448-0.858-1.943l-3.085-1.315l-3.771-1.715%20l-5.086-2.229L12.7,19.872z%20M37.557,2.214c-7.276,0-13.428,2.571-18.457,7.714c-1.258,1.258-2.439,2.686-3.543,4.287L27.786,19.7%20c0.533-1.676,1.542-3.019,3.029-4.028c1.484-1.009,3.218-1.571,5.2-1.686V9.071h3.715v4.915c2.934,0.153,5.6,1.143,8,2.971%20l-4.172,4.286c-1.793-1.257-3.619-1.885-5.486-1.885c-0.991,0-1.876,0.191-2.656,0.571c-0.781,0.381-1.172,1.029-1.172,1.943%20c0,0.267,0.095,0.533,0.285,0.8l4.057,1.83l2.8,1.257l5.144,2.285l16.397,7.314c0.535-2.248,0.801-4.533,0.801-6.857%20c0-7.353-2.552-13.543-7.656-18.573C51.005,4.785,44.831,2.214,37.557,2.214z'/%3e%3c/g%3e%3c/svg%3e)
%20--%3e%3c!DOCTYPE%20svg%20PUBLIC%20'-//W3C//DTD%20SVG%201.0//EN'%20'http://www.w3.org/TR/2001/REC-SVG-20010904/DTD/svg10.dtd'%3e%3csvg%20version='1.0'%20id='Layer_1'%20xmlns='http://www.w3.org/2000/svg'%20xmlns:xlink='http://www.w3.org/1999/xlink'%20x='0px'%20y='0px'%20width='64px'%20height='64px'%20viewBox='5.5%20-3.5%2064%2064'%20enable-background='new%205.5%20-3.5%2064%2064'%20xml:space='preserve'%3e%3cg%3e%3ccircle%20fill='%23FFFFFF'%20fill-opacity='0'%20cx='36.944'%20cy='28.631'%20r='29.105'/%3e%3cg%3e%3cpath%20fill='%23595959'%20d='M37.443-3.5c8.951,0,16.531,3.105,22.742,9.315C66.393,11.987,69.5,19.548,69.5,28.5c0,8.954-3.049,16.457-9.145,22.514%20C53.918,57.338,46.279,60.5,37.443,60.5c-8.649,0-16.153-3.143-22.514-9.429C8.644,44.786,5.5,37.264,5.5,28.501%20c0-8.723,3.144-16.285,9.429-22.685C21.138-0.395,28.643-3.5,37.443-3.5z%20M37.557,2.272c-7.276,0-13.428,2.572-18.457,7.715%20c-5.22,5.296-7.829,11.467-7.829,18.513c0,7.125,2.59,13.257,7.77,18.4c5.181,5.182,11.352,7.771,18.514,7.771%20c7.123,0,13.334-2.609,18.629-7.828c5.029-4.876,7.543-10.99,7.543-18.343c0-7.313-2.553-13.485-7.656-18.513%20C51.004,4.842,44.832,2.272,37.557,2.272z%20M23.271,23.985c0.609-3.924,2.189-6.962,4.742-9.114%20c2.552-2.152,5.656-3.228,9.314-3.228c5.027,0,9.029,1.62,12,4.856c2.971,3.238,4.457,7.391,4.457,12.457%20c0,4.915-1.543,9-4.627,12.256c-3.088,3.256-7.086,4.886-12.002,4.886c-3.619,0-6.743-1.085-9.371-3.257%20c-2.629-2.172-4.209-5.257-4.743-9.257H31.1c0.19,3.886,2.533,5.829,7.029,5.829c2.246,0,4.057-0.972,5.428-2.914%20c1.373-1.942,2.059-4.534,2.059-7.771c0-3.391-0.629-5.971-1.885-7.743c-1.258-1.771-3.066-2.657-5.43-2.657%20c-4.268,0-6.667,1.885-7.2,5.656h2.343l-6.342,6.343l-6.343-6.343L23.271,23.985L23.271,23.985z'/%3e%3c/g%3e%3c/g%3e%3c/svg%3e)
Introduction
Staphylococcus aureus (SA) bacteremia is the most common cause of hospital-onset bloodstream infection (26%), has a case-fatality rate of 15%–30%, and is associated with an estimated 300,000 deaths per year. Reference Naber1,Reference Tong, Fowler, Skalla and Holland2 Efforts to prevent hospital-onset SA bacteremia include hand hygiene, dressing changes, and sterile technique practiced on all patients. Reference Garner3 Focused and high cost interventions include decolonization/skin sterilization. Reference Sakr, Jaschinski and Wittebole4–Reference Hadley, Immerman, Hutzler, Slover and Bosco6 Effective prevention of hospital-onset SA will require a sensitive and specific tool to identify high-risk persons for decolonization/skin sterilization.
SA is a common skin colonizer; 10%–20% of the general population are persistent carriers and up to 50% are intermittent carriers. Reference Lowy7 Staphylococcus aureus is able to upregulate virulence factors under stress (such as exposure to host immune responses or antibiotics) which increases bacterial adhesion to nares, skin, or device surfaces and enhance its ability to cause disease. Reference Naber1 Instrumentation of the skin during phlebotomy, injection drug administration, or invasive procedures creates opportunities for SA to evade host defenses and cause bloodstream infections. Reference Mccabe, Treadwell and De Maria8
Decolonization/skin sterilization have been proposed to reduce the burden of high-risk pathogens including SA. The definition of decolonization and skin sterilization often overlap and can include topical agents to eliminate nasal pathogens (eg, Mupirocin, retapamulin, etc.) or antiseptic body washes (chlorhexidine or dilute bleach) to eliminate skin pathogens. Reference Sharara, Maragakis and Cosgrove9 Decolonization/skin sterilization using intranasal mupirocin, oral chlorhexidine rinsing, chlorhexidine bathing, Reference Sakr, Jaschinski and Wittebole4 or a combination of these interventions Reference Buehlmann, Frei, Fenner, Dangel, Fluckiger and Widmer5,Reference Hadley, Immerman, Hutzler, Slover and Bosco6 are effective in reducing risk of postsurgical skin and soft tissue infection among orthopedic patients, Reference Chen, Wessel and Rao10 reducing SA bacteremia in patients admitted to the ICU, Reference Edgeworth11 and reducing SA bacteremia among geriatric patients in long-term care facilities. Reference Mody, Kauffman, McNeil, Galecki and Bradley12 Universal decolonization/skin sterilization are resource intensive, may not be feasible for all hospitalized patients, and have not been associated with reduction in bloodstream infection rates in ICU settings. Reference Huang, Septimus and Kleinman13 In addition, universal decolonization/skin sterilization may facilitate antimicrobial resistance. Reference Murthy, De Angelis, Pittet, Schrenzel, Uckay and Harbarth14,Reference Robotham, Graves and Cookson15 Targeted decolonization/skin sterilization may be effective but tools are needed to identify hospitalized patients at high-risk for SA bacteremia.
Though length of stay is often anecdotally considered a risk factor for hospital-onset all-cause and SA bacteremia, the contribution of length of stay has rarely been quantified. In a study of 500 hospitalized non-pregnant adults, Jaimes et al determined that length of stay ≥10 days doubled the risk of all-cause hospital-onset bacteremia. Reference Jaimes, Arango and Ruiz16 In a study of 1,148 hospitalized patients, Wang et al determined that a length of stay of ≥16 days tripled the risk of hospital-onset SA bacteremia. Reference Wang, Chen, Chen and Liu17 This supports the evaluation of length of stay in a tool for identifying those at high risk of hospital-onset SA bacteremia.
Several tools based on algorithms predicting SA bacteremia have been reported. These tools have targeted different at-risk patient groups including ICU patients, Reference Edgeworth11 hospitalized patients ≥65 years old, and patients with central lines. Reference Gao, Albu and Stijnen18 To date, there has not been a study to identify those at high risk of hospital-onset SA bacteremia among all patients admitted through the emergency room (ER).
A nested case-control study was done to identify patients at increased risk of hospital-onset SA based on length of stay and objective data available upon admission from the ER.
Methods
A case of hospital-onset SA was defined as SA growth in a blood culture taken at least 48 hours after hospital admission of a person ≥18 years old who presented initially to an ER. 19 A query of electronic medical records (EMRs) identified all patients who met the case definition. Cases were included if the blood culture was collected between January 1, 2011 through August 31, 2020 at Mount Sinai Hospital. Mount Sinai Hospital is a large, inner city, tertiary care site that also serves as a primary care center for many communities throughout the five boroughs of New York City. Cases’ charts were individually reviewed to exclude persons who presented with SA bacteremia or had SA pneumonia. An EMR query then identified all persons ≥18 years, hospitalized for at least 48 hours, and were admitted after presenting to the ER to identify possible controls without SA bacteremia. For each case, up to 12 persons matched on birth year, race/ethnicity, sex, and month and year of admission were included as controls.
Characteristics identified in the ER prior to admission were considered potential predictors of hospital-onset SA bacteremia. These potential predictors were extracted from the EMR by a query for both cases and controls. Potential predictors were objective characteristics that are typically obtained from patients requiring ER evaluation. Vital signs were coded to reflect their relationship to normal values: body mass index (BMI) (BMI ≤ 18.5 = underweight, BMI ≥ 25 = overweight, BMI ≥ 30 = obese), systolic blood pressure (SBP) (SBP < 90 mmHg = low, SBP > 130 mmHg = high), diastolic blood pressure (DBP) (DBP < 60 mmHg = low, DBP > 90 mmHg = high), pulse (pulse < 60 = low, pulse ≥ 120 = high), respiration rate (RR) (RR > 20 = high), temperature (temp) (temp ≤ 950 F = low), temp ≥ 100.40 F = high). Lab results were also coded to reflect their relationship to normal values: hematocrit (HCT) (HCT < 34% =low, HCT > 47% = high), hemoglobin (HGB) (HGB < 11.7 g/dl = low, HGB > 15.0 g/dl = high), platelets (PLT) (PLT < 150 x 103/ul = low, PLT > 450 x 103/ul = high), white blood cells (WBC) (WBC < 4.5 x 10³/ul = low, WBC > 11 x 103/ul = high), alanine aminotransferase (ALT) (ALT > 45 u/L = high), aspartate aminotransferase (AST) (AST > 35 u/L = high), blood urea nitrogen (BUN) (BUN > 23 mg/dl = high), Calcium (Ca) (Ca < 8.5 mg/dl = low, Ca > 10.5 mg/dl = high), bicarbonate (CO2) (CO2 < 22 mEq/L = low, CO2 > 30 mEq/L = high), chloride (Cl) (Cl > 108 mEq/L = high), creatinine (Cr) (Cr > 1.1 mg/dl = high), glucose (glucose < 60 mg/dl = low, glucose > 100 mg/dl = high), potassium (K)(K < 3.5 mEq/l = low, K > 5.2 mEq/dl = high), sodium (Na) (Na < 135 mEq/L = low, Na > 145 mEq/dl = high), total bilirubin (BILI)(BILI > 1.2 md/dl = high), and total protein (total protein < 6 g/dl = low, total protein > 8.3 g/dl = high).
Statistical analysis
Several assumptions were made in this analysis. It was assumed that the risk of SA bacteremia would increase as the amount of time in the hospital increased and there would be an identifiable cutoff point which identified persons at increased risk of SA bacteremia with good specificity but imperfect sensitivity. It was also assumed that patient characteristics could be used to identify those at high risk of SA bacteremia prior to the cutoff point.
To determine if the assumption that the risk of SA bacteremia increases with increased hospital stay, logistic regression models with infection as the outcome and length of hospital stay as the exposure were done. Length of hospital stay for cases was the date of positive SA blood culture minus date of admission (for example, a patient admitted for a total of 21 days who has a positive SA blood culture on day 14 would have a length of stay of 14 days). Length of hospital stay for controls was date of discharge minus date of admission.
To identify a cutoff day with high sensitivity and high specificity for SA bacteremia, receiver operating characteristic (ROC) curves were drawn, and additional logistic regression models were created.
To identify the patient characteristics associated with an increased risk of SA bacteremia, Cox proportional hazards analysis was used to test all the potential predictors outlined above. Because many variables had missing values, ten imputed datasets were created using all potential predictors in the imputed data model. Each individual data set was analyzed using Cox proportional hazards models to identify those variables independently associated with SA bacteremia. Characteristics found in all or most of the ten models were identified as being associated with SA bacteremia. To get an unbiased estimate for the characteristics associated with SA bacteremia, a final Cox proportional hazards model was determined by generating 250 imputed datasets again using all potential predictors in the imputed data model and integrating the results of all 250 datasets.
Based on the determination of a cutoff day and the final Cox proportional hazards model, a tool to identify those at risk of SA bacteremia was proposed. The performance of the tool on the original data set is presented.
The study was approved by the Icahn School of Medicine Program for the Protection of Human Subjects (#20-00238) which adheres to the Declaration of Helsinki. SAS version 9.4 software (SAS Institute Inc.: Cary, NC, USA) was used for all analyses. A P value of ≤ .05 was considered significant.
Results
There were 375 case-patients with SA bacteremia identified. Patients were matched to between one to 12 controls (Supplemental Table 1) with a total of 2,248 controls included in the study. Because the number of controls per case varied, there were overall differences in age and race distributions (Table 1). The median age of cases was 66.5 (Interquartile range (IQR 54.5, 76.7) and of controls was 67.6 (IQR 57.7, 77.1). Forty three percent of cases were female and 42% of controls were female. Chief complaints were similarly distributed in cases and controls (Table 1).
Characteristics of cases and controls

Ref = reference group; ND = Not defined.
*Characteristics used for matching cases and controls. Because cases had different numbers of controls, these variables have similar but not exactly the same distributions.
†Chief complaint is presented here but is not included in further analyses.
The percent of missing potential predictors varied from 0% to 12% in cases and 0% to 14% in controls (Table 1). In univariable Cox proportional hazards analysis, cases were more likely than controls to have high AST (P = .003), high alkaline phosphatase (P = .004), low calcium (P = .01), high calcium (P = .03), high CO2 (P = .03), high creatinine (P = .006), high potassium (P = .02), low sodium (P = .03), and high protein (P < .001).
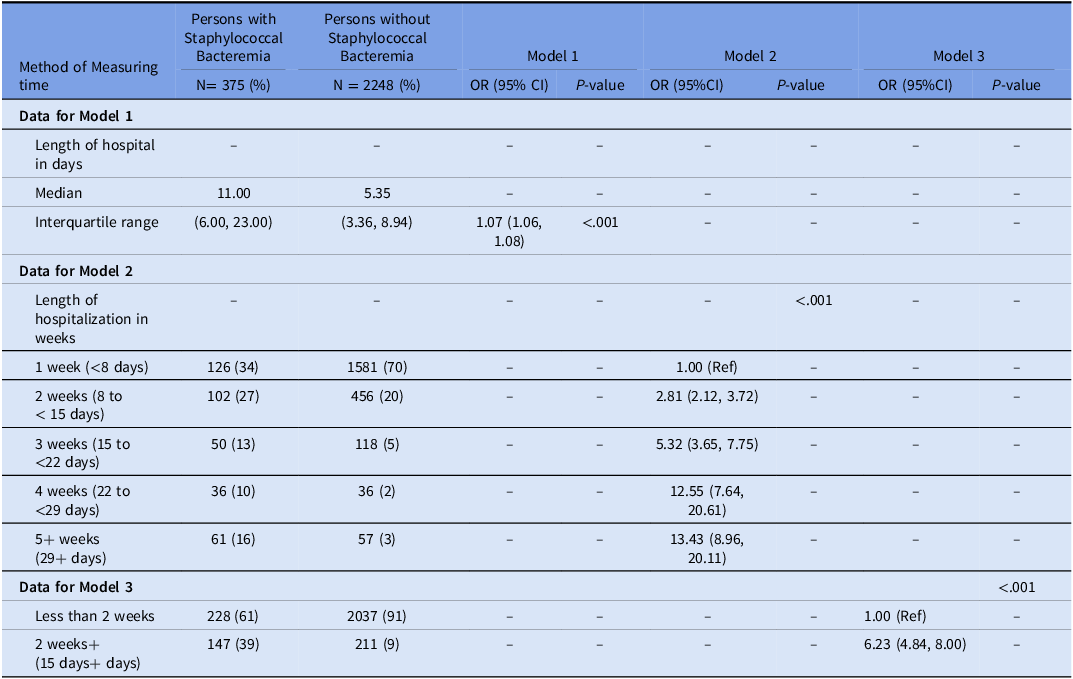
Length of stay was longer for the persons with SA bacteremia compared to those without (median (IQR), 11.00 (6.00, 23,00) vs. 5.35 (3.36, 8.94), respectively, P < .001, Wilcoxon rank-sum) (Figures 1 and 2). By 15 days of hospital stay, 91% of controls were discharged from the hospital [(2,248–211)/2,248] whereas only 61% of cases had been discharged [(375–147)/375] (Table 2).
Histogram of the length of stay before discharge (Controls) and the length of stay until diagnosis of staphylococcal bacteremia (Cases), Mount Sinai Hospital, Jul 1, 2011 to August 31, 2020.

Kaplan-Meier survival curve cases and controls.

Three models with case (staphylococcal bacteremia) or control (no staphylococcal bacteremia) as the outcome using 3 different ways of measuring time

In logistic regression, length of stay measured in days was associated with SA bacteremia. For each additional day in the hospital, the risk of SA bacteremia increased by 7% (Table 2, Model 1). In logistic regression, length of stay measured in weeks was associated with an increased risk of infection each week and plateaued at about week 4 (Table 2, Model 2). In logistic regression, 15 or more days of hospital stay was associated with an increased risk of SA bacteremia (HR = 6.23, 95% CI (4.84, 8.00), P < .001).
A ROC curve illustrating the performance of length of stay in identifying risk of SA bacteremia did not find a clear point which maximized sensitivity and specificity (Figure 3). Day 15 represents a sensitivity of 39% and a specificity of 91%.
After imputing ten datasets from the original data set and conducting manual and computer-assisted forward, backward, and stepwise regression to identify characteristics associated with SA bacteremia; high AST, high creatinine, and high CO2 were significantly associated with SA bacteremia in ten datasets and high total protein was significantly associated with SA bacteremia in nine datasets. A final model used 250 imputed datasets and found that SA bacteremia was associated with high AST (HR = 1.92, 95% CI (1.30, 2.83), P = .001), high creatinine (HR = 1.91, 95% CI (1.28, 2.85), P = .002), high CO2 (HR = 2.07, 95% CI (1.17, 3.64), P = .01), and high protein (HR = 2.14, 95% CI (0.99, 4.66), P = .05) (Table 3). The increased risk of SA bacteremia due to each of these variables is similar; the hazard ratio for all four variables is close to two.
Final model with 250 imputations combined

Screening performance of analytic strategies using high AST, high creatinine, high CO2, and high total protein on admission with ≥15-day length of stay is presented in Table 4. Hospital stay ≥15 days identified persons who later developed SA bacteremia with sensitivity 39% and specificity 91%. The low sensitivity of hospital stay ≥15 days improved by the addition of any two of high AST, high creatinine, high CO2, or high protein on admission labs to sensitivity between 57% and 64% with a decrease in specificity to between 65% and 78%.
Screening performance of different strategies on the original data set

The analysis was repeated including only patients discharged prior to January 1, 2020, to evaluate for the potential impact of COVID-19 and tool performance was unchanged (Supplementary Table 2).
The performance of a prediction tool which includes hospital stay ≥15 days OR elevated laboratory tests of at least two of the following: AST, creatinine, CO2, or total protein is presented in Kaplan-Meyer Curves (Figures 4 and 5). Figure 4 uses the original data set obtained from patients at MSH and assumes lab values are normal when they are missing. Under these circumstances, 27% of all patients (711/2,623) would be identified as high risk for SA bacteremia and 57% (215/375) of persons with SA bacteremia would be correctly identified. Figure 5 uses the original data set obtained from patients at MSH and assumes lab values are abnormal when they are missing. Under these circumstances, 39% (1,025/2,623) would be identified as high risk for SA bacteremia and 64% (239/375) of persons with SA bacteremia would be correctly identified.
Receiver operating characteristic curve illustrating the performance of time to infection (cases) or hospital discharge (controls) in identifying risk of staphylococcal bacteremia.

Kaplan-Meier Survival Curve comparing those identified as high risk of Staphylococcus aureus bacteremia compared to those identified as having lower risk of Staphylococcus aureus bacteremia (with missing values assumed to be normal values)†.
† Patients were identified as high risk for Staphylococcus aureus bacteremia if on admission they were in still in the hospital at 15 days OR had two or more of the following on labs drawn close to the time of admission in the Emergency Room (high aspartate aminotransferase (AST), high creatinine, high carbon dioxide, and high protein).

Kaplan-Meier Survival Curve comparing those identified as high risk of Staphylococcus aureus bacteremia compared to those identified as having lower risk of Staphylococcus aureus bacteremia (with missing values assumed to be abnormal values)†.
† Patients were identified as high risk for Staphylococcus aureus bacteremia if on admission they were in still in the hospital at 15 days OR had two or more of the following on labs drawn close to the time of admission in the Emergency Room (high aspartate aminotransferase (AST), high creatinine, high carbon dioxide, and high protein).

Discussion
Based solely upon objective data available at presentation to the ER the tool of ≥15-day length of stay OR elevated laboratory tests of at least two of the following: AST, creatinine, CO2, or total protein, identifies subsequent hospital-onset SA bacteremia with sensitivity 57%–64% and specificity 65%–78%.
The identified risk factors of high AST, high creatinine, high CO2, and high total protein, have biologic plausibility. High AST is associated with hepatic dysfunction. Hepatic dysfunction is associated with immunologic dysfunction which may increase the risk of infection. Reference Kasper, Fauci, Hauser, Longo, Jameson and Loscalzo20 Additionally, patients with hepatic dysfunction may be edematous leading to more challenging phlebotomy which may lead to repeated attempts at sample collection and increased risk of bacteremia. Reference Kasper, Fauci, Hauser, Longo, Jameson and Loscalzo20 High creatinine is associated with renal failure. Acute renal failure may require new central venous access for hemodialysis while chronic renal failure is associated with repeated central venous access, both of which increase the risk of bacteremia. Reference Suzuki, Satoh, Nakamura, Horita, Seki and Moriya21 High CO2 is associated with heart, liver, or kidney dysfunction and may serve as a proxy for end organ damage and severe illness. Finally, high total protein is often associated with hematologic malignancy or other inflammatory states, including HIV infections, which are associated with immune dysfunction and may increase the risk of bacteremia. Reference Kasper, Fauci, Hauser, Longo, Jameson and Loscalzo20
This tool is unique in that it identifies those at increased risk of hospital-onset SA bacteremia among all patients admitted through the ER using data typically acquired in the ER. A tool developed by Edgeworth predicts an increased risk of MRSA bacteremia among all patients admitted to the ICU based on data acquired at the time of admission to the ICU. Reference Edgeworth11 A tool developed by Kaye et al predicts an increased risk of all-cause hospital-onset bacteremia among hospitalized adults age ≥65 based on data acquired throughout the hospital stay. Reference Kaye, Marchaim and Chen22 A tool developed by Gao et al predicts an increased risk of CLABSI among hospitalized patients using data acquired at the time of central line insertion. Reference Gao, Albu and Putter23 In addition to Gao et al, many other researchers have developed tools to predict an increased risk of CLABSI among hospitalized patients using data collected during hospitalization. Reference Gao, Albu and Tuand24 The tool presented here is applicable to all adults admitted via the ER which has wider applicability.
This study has several strengths. The tool developed in this study is based on objective data which reduces bias. The variables selected for this study: vital signs, complete metabolic panel, and complete blood counts were selected because these measures are part of routine clinical care in the ER. Reference Kristensen, Iversen and Gerds25 In addition, this tool does not use difficult to obtain data; an accurate medical history may provide characteristics which lead to improved sensitivity and specificity, but medical history is not consistently available for all patients presenting to the ER. The results of the vital signs, metabolic panel, and complete blood counts were re-coded as “low,” “normal,” and “high” to maximize flexibility; individual hospitals need not use a standard assay for these tests. The use of “low,” “normal,” and “high” also decreases the potential outsize influence of outliers in the analysis. This study was conducted in a diverse population which may enhance its generalizability. Finally, this study employed a nested case-control design providing certainty that risk factors preceded development of hospital-onset SA bacteremia.
This study has several limitations. Data collected to develop this tool was from a single urban, tertiary care center and therefore may not be generalizable. The data used to develop this algorithm was collected during routine clinical care and some data is missing. The clinical choice of whom to test and whom not to test may have led to bias in our results. To address the missing data, 250 imputation data sets were employed to decrease this bias. Cases and controls were matched on year of birth, month of admission, race/ethnicity, and sex, and, therefore, any association between these variables and the risk of hospital-onset SA bacteremia cannot be determined. This tool has yet to be validated.
Hospital-onset SA bacteremia is a serious disease. Any efforts to decrease the incidence of hospital-onset SA bacteremia may reduce morbidity and mortality. The sensitivity and specificity of the proposed tool are not perfect. A highly sensitive tool would be ideal but high specificity is needed for appropriate allocation of limited resources. The presented tool identifies persons at high risk of hospital-onset SA bacteremia if they have ≥15-day length of stay OR elevated laboratory tests of at least two of the following: AST, creatinine, CO2, or total protein, with 57% to 64% sensitivity and 65% to 78% specificity.
Supplementary material
The supplementary material for this article can be found at https://doi.org/10.1017/ash.2026.10355.
Financial support
This project was supported by the Empire Clinical Research Investigator Program (ECRIP) administered by the New York State Department of Health.
Competing interests
All authors report no conflicts of interest relevant to this article.




 Open access

