

Introduction
Migraine headaches are common, with a one-year prevalence in the general USA population of 17.2 per cent in females and 6.0 per cent in males.Reference Lipton, Scher, Kolodner, Liberman, Steiner and Stewart1 The prevalence of migraine is often enhanced in patients with vertigo disorders, including disorders as disparate as benign paroxysmal positional vertigo (BPPV) and Ménière's disease.Reference Minor2, Reference Uneri3 This has been interpreted to indicate causation. For example, the enhanced prevalence of migraine in BPPV patients has been attributed to direct damage to the utricle by migrainous vasospasm.Reference Ishiyama, Jacobson and Baloh4
Migraineurs have been shown to be hypersensitive to sensory stimuli compared to non-migraineurs, during and outside of acute migraine attacks.Reference Main, Dowson and Gross5 Migraineurs are also more likely than non-migraineurs to experience motion sicknessReference Vitkovic, Paine and Rance6 and to have visually enhanced vestibulo-ocular reflexes.Reference Neuhauser, Leopold, Von Brevern, Arnold and Lempert7, Reference Arriaga, Chen, Hillman, Kunschner and Arriaga8 The hypersensitivity to sensory stimuli, increased incidence of vegetative symptoms and predisposition for motion sickness suggest that migraineurs may experience vertigo more intensely than non-migraineurs. If migraineurs are more sensitive to stimuli that induce vertigo, then the increased incidence of vertigo diagnoses seen in prior studiesReference Minor2, Reference Uneri3, Reference Lipton, Bigal, Diamond, Freitag, Reed and Steward9 may be due to an increased tendency to seek care because the symptoms are more intrusive than in non-migraineurs. Increased migraineur sensitivity to vestibular stimuli could thus confound associations between vertiginous diseases and migraine headaches. One measure of sensitivity to vestibular stimuli is labyrinthine reactivity obtained via caloric testing using videonystagmography.Reference Jongkees10, Reference Baloh and Furman11
We hypothesised that the labyrinthine reactivity of migraineurs would be significantly greater than that of non-migraineurs. We also hypothesised that patients who do not fully meet the International Headache Society migraineur criteria would have labyrinthine reactivity somewhere between that of migraineurs and non-migraineurs.
Materials and methods
A retrospective case–control study was performed at an academic tertiary referral centre. This centre sees about 400 new patients for complete neuro-otological evaluations annually, of whom approximately 30 per cent report migraine or headache. The diagnosis of migraine is based upon International Headache Society criteria.12 This study was approved by the Colorado Multiple Institutional Review Board (the principal investigator was C A Foster; protocol number 12-0393). A total of 550 cases were identified, 406 (74 per cent) of whom were female and 144 (26 per cent) male.
Subject data were gathered from the existing videonystagmography patient database and matched to electronic patient medical records. Patient data collected between January 2000 and December 2011 were used for this study. Inclusion criteria included a complete set of four bithermal caloric responses recorded and evaluated in the neuro-otology clinic.
Bithermal caloric responses were recorded using the Synapsys Ulmer videonystagmography system (Marseille, France). (The University of Colorado videonystagmography protocol can be obtained from the Balance Laboratory at the University of Colorado Hospital Otolaryngology Clinic.) As bilateral vestibulopathy is found in only 0.6–1 per cent of all patients undergoing videonystagmography testing,Reference Vibert, Liard and Hasler13 the summed responses from the best responding ear of each patient were collected. Each patient's medical chart was then reviewed.
Exclusion criteria included patients with Ménière's disease, a prior history of seizure, panic disorder, head trauma, multiple sclerosis, developmental delay or congenital hearing loss. These conditions have been shown to change caloric responsesReference Grenman14–Reference Schürks and Diener17 or have the theoretical potential to affect caloric data. Patients who underwent videonystagmography testing but who had insufficient past medical history to determine classification on chart review were excluded.
Patients were placed into one of three subject groups, based on International Headache Society criteria:12 (1) a migraine group (n = 300, 234 (78 per cent) females; mean age = 49.0 years); (2) a possible migraine group, which comprised patients who met some but not sufficient International Headache Society criteria for the diagnosis of migraine (n = 35, 28 (80 per cent) females; mean age = 39.5 years); and (3) a non-migraine group (n = 215, 144 (67 per cent) females; mean age = 51.9 years).
The mean, standard deviation and 95 per cent confidence interval values for the summed caloric responses in the best responding ear were calculated separately for each group. The means of all three groups were compared with a one-way analysis of variance (ANOVA) using SPSS® statistical software. A type II sum of squares ANOVA was used to compare data because of the small number of subjects in the possible migraine group.Reference Langsrud18 Additionally, post hoc t-tests were performed to determine statistically significant differences between individual groups.
Using a two-tailed student's t-test, the means of each group were also compared to the mean caloric responses in the best responding ear of normal subjects reported in a prior study (n = 25, 14 (56 per cent) females; mean age = 24.1 years).Reference Henricksson19 Again using a two-tailed student's t-test, the means of each group were additionally compared to mean caloric responses from the best responding ear of audiology students who underwent videonystagmography testing as a routine part of their training at the University of Colorado (n = 33).
Results
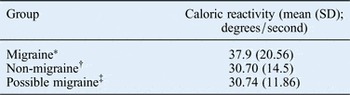
The averaged caloric responses for the best responding ear for all three subject groups are given in Table I. The mean caloric responses of all the subject groups in this study were well within the range considered normal during videonystagmography testing. A comparison of the three subject groups' values performed with a type II sum of squares ANOVA revealed a significant difference (p < 0.001).
Mean caloric reactivity values for all study groups

*n = 300; †n = 215; ‡n = 35. SD = standard deviation
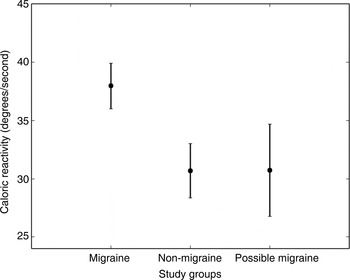
Post hoc t-tests were performed to assess differences between individual groups. The difference in caloric responses between the migraine group and non-migraine group was statistically significant (p < 0.001), as was the difference between the migraine group and the possible migraine group (p < 0.05). However, no significant difference was found between the non-migraine group and possible migraine group (p = 0.988) (Figure 1). Ten of the 300 patients in the migraine group (3.3 per cent) demonstrated hyperactive responses (summed responses of 80 degrees per second or more). No hyperactive responses were found in the possible migraine group or the non-migraine group.
Mean caloric reactivity values of all study groups, with 95 per cent confidence intervals.

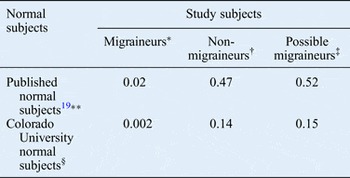
The mean caloric responses of the possible migraineurs and non-migraineurs were not significantly different from those found in the best responding ear of normal subjects from a prior studyReference Henricksson19 (p = 0.52 and p = 0.47, respectively), nor were they significantly different from the mean caloric responses of audiology students at the University of Colorado (p = 0.15 and p = 0.14, respectively) (Table II).
Comparison of mean caloric reactivity between normal subjects and study subjects

Data represent p-values. *n = 300; mean caloric reactivity of 37.9 degrees per second. †n = 215; mean caloric reactivity of 30.7 degrees per second. ‡n = 35; mean caloric reactivity of 30.7 degrees per second. **n = 25; mean caloric reactivity of 30.1 degrees per second. §n = 33; mean caloric reactivity of 26.8 degrees per second.
Discussion
Although mean caloric responses were within normal limits, migraineurs in this study had caloric responses that were significantly higher than: people with no history of headache, those who met some but not all International Headache Society criteria for migraine diagnosis and normal subjects.
Migraine has been described as a cortical hypersensitivity disorder.Reference Coppola, Pierelli and Schoenen20 This includes hyper-responsivity with impaired habituation to repeated sensory stimuli, and a lower threshold for discomfort brought on by optical, auditory, nociceptive and somatosensory stimuli.Reference de Tommaso, Ambrosini, Brighina, Coppola, Perrotta and Pierelli21 Caloric hypersensitivity (responses to one irrigation of more than 40 degrees per second) was identified in 10 per cent of migraine patients in one study.Reference Nafie, Friedman and Hamid22 Increased emesis during caloric testing has also been reported.Reference Büttner, Helmchen and Brandt23 Our study confirms that migraineurs respond more strongly than non-migraineurs to caloric irrigation. Caloric hypersensitivity was found in 3.3 per cent of our migraine group and was absent in non-migraineurs.
These findings suggest a possible confounding relationship between vertiginous diseases and migraine. Nystagmus velocity corresponds to the perceived velocity of rotation;Reference Büttner, Helmchen and Brandt23 hence, enhanced responses to caloric irrigation imply faster onset of vertigo in migraineurs. The presence of enhanced emetic responses during caloric testing in migraineurs demonstrates that this effect is unpleasant. In the presence of a vestibular disorder, migraineurs could be expected to feel vertigo at an earlier stage of disease or with a lesser severity of vestibular dysfunction. This may cause migraineurs to seek medical care earlier, to return more frequently during the follow-up period and to report more severe symptoms than non-migraineurs. As migraine is very common, this effect has the potential to artefactually increase the prevalence of migraine in vestibular disorders in general.
The apparent increased prevalence of migraine in many vestibular disorders has been attributed to causation related to, for example, BPPV.Reference Ishiyama, Jacobson and Baloh4 If we are correct, some if not all of the increased prevalence of migraine in patients who suffer BPPV may be attributable to an enhanced sensitivity to vertigo. In order to show that migraine is causal in a given vestibular disorder, the impact of this enhanced sensitivity to vestibular stimuli must be considered.
In this study, we found that the difference between the caloric responses of the non-migraineurs and possible migraineurs was not statistically significant. This could be a result of the small number of subjects in the possible migraine group, or difficulty in the proper classification of possible migraine patients on chart review.
• Vertigo prevalence is elevated in migraineurs
• Increased vertigo complaints in migraineurs have been interpreted to indicate that migraine is causative in vertigo disorders
• Migraineurs are more sensitive than controls to all sensory stimuli, during and outside of migraine attacks
• In this study, migraineurs experienced vestibular stimuli more intensely than non-migraineurs, which might explain the link between migraine and vestibular disorders
Our study validates the use of the International Headache Society criteria for the diagnosis of migraine, because only the migraine group showed a distinctly different pattern of caloric responses. Patients with vertigo are able to compensate over time to control their symptoms; however, it is unclear whether migraineurs need more time for this compensation to occur. Future studies of the time course of compensation and the effectiveness of various physical therapy regimens for vertigo in migraineurs and non-migraineurs would be clinically useful for patient education and clinical management of these two different groups.
Acknowledgements
The authors thank Kathleen Zaccoro and Eric Harris for their assistance with videonystagmography data acquisition.