

Introduction
Overwhelming evidence obtained from studies in human links development under sub-optimal intrauterine conditions with increased risk of cardiovascular disease.Reference Barker1 Common sub-optimal intrauterine conditions include impaired fetal nutrition and oxygenation. Consequently, many studies have now accumulated to report that nutrientReference Fowden, Giussani and Forhead2–Reference Martin-Gronert and Ozanne4 and oxygenReference Fowden, Giussani and Forhead2, Reference Thompson5–Reference Giussani, Camm and Niu9 restriction during development promotes intrauterine growth restriction (IUGR) and programmes cardiovascular dysfunction in the adult offspring.
Several studies, including our own, have used exposure of the pregnant rodent to a prolonged period of hypoxia during gestation and have studied adverse effects on fetal growth and on the cardiovascular system of the offspring at adulthood. These studies have reported that prenatal chronic hypoxia with or without IUGR programmes in the adult offspring impaired cardiac performance with increased susceptibility to cardiac ischaemia/reperfusion injuryReference Hauton and Ousley6–Reference Li, Xiao and Estrella10 and pronounced endothelial dysfunction in peripheral resistance circulations.Reference Rueda-Clausen, Morton and Davidge8, Reference Giussani, Camm and Niu9, Reference Morton, Rueda-Clausen and Davidge11 However, because maternal exposure to hypoxia can lead to a significant decrease in maternal food intake,Reference de Grauw, Myers and Scott12, Reference Camm, Hansell and Kane13 the extent to which any adverse effects on the offspring are due to fetal undernutrition and/or underoxygenation remain unclear.
More than 140 million people live at altitudes higher than 3000 m, providing the largest single human group at risk for fetal exposure to hypoxia.Reference Moore, Charles and Julian14 Studies of highland populations have reported fetal growth restriction and adverse cardiovascular alterations in offspring of high altitude (HA) relative to those of sea level (SL) pregnancies.Reference Lichty, Ting, Bruns and Dyer15–Reference Huicho and Niermeyer23 However, because most of HA populations are also impoverished, the relative contributions of fetal hypoxia and of malnutrition in slowing fetal growth and programming cardiovascular dysfunction, again, remain uncertain.
The chick embryo provides a useful model to investigate the direct effects on fetal growth and on programming of cardiovascular dysfunction of developmental hypoxia independent of additional effects on the nutrition of the mother and/or on the maternal or placental physiology and/or on lactation.Reference Ruijtenbeek, De Mey and Blanco24–Reference Tintu, Rouwet and Verlohren26 By combining HA exposure with the chick embryo model, we have previously been able to isolate the direct effects of HA hypoxia on fetal growthReference Giussani, Salinas, Villena and Blanco27 and on fetal cardiovascular development.Reference Salinas, Blanco and Villena28 Incubation of fertilized eggs from SL hens at HA promoted growth restriction, cardiomegaly and cardiac and aortic wall thickening in the chick embryo by the end of the incubation period.Reference Giussani, Salinas, Villena and Blanco27, Reference Salinas, Blanco and Villena28 These effects of HA incubation could be prevented by incubating eggs from HA hens at SL or by incubating eggs from SL hens at HA with oxygen supplementation.Reference Giussani, Salinas, Villena and Blanco27, Reference Salinas, Blanco and Villena28 In the present study, we have combined HA exposure with the chick embryo model, to isolate the effects of HA hypoxia during embryonic development and postnatal life on cardiovascular function measured in vivo at adulthood. Because in this model the hypoxic environmental condition persists before and after hatching, the study also permits the investigation of the effects of a ‘double insult’ in triggering cardiovascular dysfunction. As it is established that differences in sex affect developmental origins of cardiovascular disease,Reference Gilbert and Nijland29 this study investigated both male and female adult chickens.
Methods
All procedures were approved by the local ethics committee of the Bolivian Institute for High Altitude Biology (Consejo Técnico, IBBA, Universidad Mayor de San Andrés, La Paz, Bolivia) and were performed under the UK Animals (Scientific Procedures) Act 1986.
Animals
The study was conducted in Bolivia, in the HA city of La Paz (HA, 3600 m, 494 mmHg, PO2 100 mmHg) and the SL city of Santa Cruz (SL, 420 m, 760 mmHg, PO2 160 mmHg). Eighteen (nine males and nine females) Black Leghorn chicken embryos were incubated, hatched and raised at SL and 14 (seven males and seven females) Black Leghorn chicken embryos were incubated, hatched and raised at HA. At 6 months, which in this species represents early adulthood, the animals were subjected to general anaesthesia (10 mg/kg Xylazine 2%, Millpledge Pharmaceuticals, United Kingdom and 15 mg/kg Ketamine, Ketaset, Fort Dodge Animal Health, Iowa, USA, i.m.) and the femoral artery and vein were isolated via a hind limb medial incision. Polyvinyl catheters (i.d. 0.58 mm; o.d. 0.96 mm; Critchly Electrical Products, NSW, Australia) were placed in the descending aorta and inferior vena cava. The catheters were filled with heparinized saline (100 i.u. heparin in 0.9% NaCl), plugged with a brass pin and tunnelled subcutaneously to exit between the origin of the wings at the back of the chicken. After surgery, the animals were returned to a recovery room and then to floor pens. At least 5 days of post-operative recovery were allowed before the beginning of any experiment. Catheters were maintained patent by daily flushing with heparinized saline. At this time, an arterial blood sample was taken to monitor well-being.
Experimental protocol
On the day of experiments, the chicken was placed in a sling inside a dark wooden box with appropriate ventilation. The catheters were extended. The arterial catheter was connected to a pressure transducer (COBE; Argon Division, Maxxim Medical, Athens, Texas, USA) at the level of the base of the heart. Mean (MAP), systolic (SAP) and diastolic arterial pressure (DAP) and heart rate (HR) were recorded continuously via a data acquisition system (MPAQ – Maastricht Programmable AcQuisition system, Maastricht Instruments, The Netherlands, 500 Hz sample rate).
During basal recording, before the start of any experiment, 0.5 ml of arterial blood was taken to determine pHa, PaO2 and PaCO2 (ABL 500, Radiometer, Copenhagen, Denmark, measurements corrected to 37°C), percentage saturation of haemoglobin (SaO2) and haematocrit (Ht; OSM3, Radiometer, Copenhagen, Denmark).
The chicken was then subjected to a protocol consisting of a 10-min period of baseline (B), a 10-min intravenous infusion (I) and 10-min period of recovery (R). The infusion consisted of either phenylephrine (50 μg/kg per min) or sodium nitroprusside (20 μg/kg per min) in separate experiments. The experiments were performed on the same day with at least 2 h between them to allow the cardiovascular variables to return to basal values. The phenylephrine experiment always preceded the infusion of nitroprusside.
At the end of the experiments, the chicken was humanely killed with an overdose of anaesthetic (100 mg/kg, Thiopental injection BP, Link Pharmaceuticals Ltd, UK, i.v.). Post mortem, the chicken was weighed and several body measurements were taken.
Data and statistical analyses
Baseline values for MAP, HR, pulse interval (PI; HR/60,000) and the rate pressure product [RPP; (HR × SAP)/1000] were calculated. In brief, the calculation of the baroreflex gain required two steps. The first step was the calculation of the slope of the HR–blood pressure relationship and the maximum and minimum values for HR for each animal. This was achieved by plotting the minute-by-minute HR and blood pressure responses during the beginning of the infusion period from baseline to plateau. Only the period from baseline to plateau is used to avoid confounding by resetting of the baroreflex. Arterial blood pressure and HR responses to the drugs were fitted to sigmoidal curves as follows: HR = HRmin +((HRmax − HRmin)/(1 + 10(Mid-point-MAP) × Gain coefficient). The value for gain represents the gain coefficient of the Hill slope that describes the steepness of the curve. The second step was to calculate the baroreflex sensitivity according to McDowall and DampneyReference McDowall and Dampney30 applying the values for gain, maximum and minimum HR to the following equation: Baroreflex Gain =((HRmax − HRmin) × Gain coefficient)/4. This was done for each individual animal and thereafter the mean ± s.e.m. of the baroreflex gain for each group was calculated.
All data are expressed as mean ± s.e.m. Comparisons between groups were assessed statistically using two-way ANOVA with the Student–Newman–Keuls post-hoc test, with altitude and sex as factors (Prism 5, GraphPad Software, Inc.). For all comparisons, statistical significance was accepted when P < 0.05.
Results
Arterial blood gas status
There were no differences in basal arterial pH and pCO2 between groups. However, HA chickens had lower arterial pO2, SaO2 and increased Ht compared with SL chickens (Fig. 1). There was no effect of sex on arterial blood gas status either at SL or at HA. Therefore, these data were grouped at each altitude (Fig. 1).
Arterial blood gas status in sea level (SL) and high altitude (HA) adult chickens. Values are the mean ± s.e.m. for pH (a), pO2 (b), pCO2 (c), O2 haemoglobin saturation (d, SaO2) and haematocrit (e, Ht) in nine males and nine female chickens incubated, hatched and raised at SL (□) and in seven male and seven female chickens incubated, hatched and raised at HA (▪). There was no effect of sex on arterial blood gas status either at SL or at HA. Therefore, these data were grouped at each altitude. Significant differences (P < 0.05) are: *SL v. HA (Two-way ANOVA + Student–Newman–Keuls post-hoc test).

In vivo basal cardiovascular function
Values for SAP, DAP and MAP during basal conditions were significantly lower in HA compared with SL chickens, and these differences were independent of the sex of the animal (Fig. 2a–2c). In contrast, basal HR was significantly higher and basal PI significantly lower in female than in male chickens at SL. Although basal HR and PI were significantly altered in HA males compared with SL males, there was no effect of altitude on basal HR or PI in female chickens (Fig. 2d and 2e). The RPP, an index of myocardial workload and oxygen consumption,Reference Gobel, Norstrom, Nelson, Jorgensen and Wang31 was significantly elevated during basal conditions in female chickens compared with male chickens at SL. Although HA had no effect of RPP in males, values for RPP in HA females were significantly lower compared with SL females (Fig. 2f).
Basal cardiovascular function in sea level (SL) and high altitude (HA) adult chickens. Values are the mean ± s.e.m. for systolic arterial pressure (a, SAP), diastolic arterial pressure (b, DAP), mean arterial pressure (c, MAP), heart rate (d, HR), pulse interval (e, PI) and the rate-pressure product (f, RPP) in nine males and nine female chickens incubated, hatched and raised at SL (white solid and white hatched bars) and in seven male and seven female chickens incubated, hatched and raised at HA (black solid and black hatched bars). Significant differences (P < 0.05) are: †male v. female, same altitude (hypoxia independent of sex) or *SL v. HA, for same sex (sex independent of hypoxia). There was no interaction between hypoxia and sex (Two-way ANOVA + Student–Newman–Keuls post-hoc test).
In vivo baroreflex function
Independent of sex and altitude, all animals responded with reciprocal changes in HR to increases and decreases in arterial blood pressure induced by the administration of phenylephrine and sodium nitroprusside, respectively. Although values representing the cardiac baroreflex gain were significantly depressed in HA males compared with SL males, baroreflex gain was markedly increased in HA females compared with SL females (Fig. 3).
Baroreflex function in sea level (SL) and high altitude (HA) adult chickens. Values are the mean ± s.e.m. for cardiac baroreflex function curves (a) and the gain of the cardiac baroreflex (b) in nine males and nine female chickens incubated, hatched and raised at SL and in seven male and seven female chickens incubated, hatched and raised at HA. Groups are sea level males (white circles, white bars), HA males (black circles, black bars), SL females (white squares, white hatched bars) and HA females (black squares, black hatched bars) chickens. Significant differences (P < 0.05) are: †male v. female, same altitude (hypoxia independent of sex) or *SL v. HA, for same sex (sex independent of hypoxia). There was no interaction between hypoxia and sex (Two-way ANOVA + Student–Newman–Keuls post-hoc test). The calculation of the baroreflex gain required two steps. The first step was the calculation of the slope of the heart rate (HR)–blood pressure relationship and the maximum and minimum values for HR for each animal. This was achieved by plotting the minute-by-minute HR and blood pressure responses during the beginning of the infusion period from baseline to plateau. Only the period from baseline to plateau is used to avoid confounding by resetting of the baroreflex. Arterial blood pressure and HR responses to the drugs were fitted to sigmoidal curves as follows: HR = HRmin + ((HRmax − HRmin)/(1 + 10(Mid-point-MAP) × Gain coefficient). The value for gain represents the gain coefficient of the Hill slope that describes the steepness of the curve. The second step was to calculate the baroreflex sensitivity according to McDowall and DampneyReference McDowall and Dampney30 applying the values for gain, maximum and minimum HR to the following equation: Baroreflex Gain = ((HRmax − HRmin) × Gain coefficient)/4, The three points with s.e.m. on the curve represent the summary measures of the analysis: the gain and maximum and minimum HR values.
Biometry
Body weight was significantly lower in females than in males either at SL or HA. Body length [crown–rump length (CRL)] and other longitudinal measurements also tended to be shorter in females than in males at either SL or HA; however, only tibial and meta-tarsal length reached significant differences in SL animals (Table 1). Values for ponderal index were higher in male and female chickens at HA; however, the mean calculation was not significantly different from SL. The head length:CRL ratio was significantly elevated in HA compared with SL male but not female chickens (Table 1). The same trend was observed for the head diameter:body weight ratio, but the difference in males did not reach significance.
Body weight and dimensions in SL and HA adult chickens
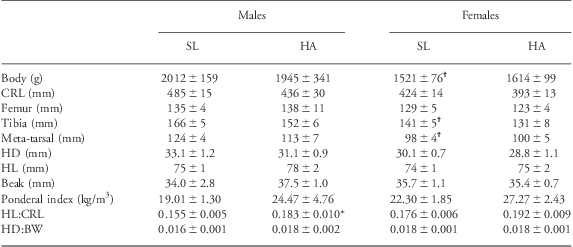
SL, sea level; HA, high altitude; CRL, crown–rump length; HD, head diameter; HL, head length; BW, body weight.
Values are mean ± s.e.m. for BW, CRL, femur, tibia and meta-tarsal lengths, HD, HL, beak length, ponderal index, the ratio of HL:CRL and of HD:BW in nine males and nine female chickens incubated, hatched and raised at SL and in seven male and seven female chickens incubated, hatched and raised at HA. Significant differences (P < 0.05) are: †male v. female, same altitude or *SL v. HA (Two-way ANOVA + Student–Newman–Keuls post-hoc test).
Discussion
By combining the chick embryo model with incubation at HA, we have previously isolated the effects of developmental hypoxia on fetal growth and on fetal cardiac and aortic wall remodelling.Reference Giussani, Salinas, Villena and Blanco27, Reference Salinas, Blanco and Villena28 Here, we isolate the effects of developmental hypoxia on cardiovascular function at adulthood measured in conscious chickens in vivo, and show that development at HA lowers basal arterial blood pressure and alters baroreflex sensitivity in a sex-dependent manner at adulthood.
Several experimental models of adverse intrauterine conditions, including maternal protein deprivation,Reference Langley and Jackson32–Reference Watkins, Wilkins and Cunningham38 maternal overnutritionReference Langley-Evans, Clamp, Grimble and Jackson39–Reference Elahi, Cagampang and Anthony43 and excess glucocorticoid exposureReference Dodic, Abouantoun, O'Connor, Wintour and Moritz44–Reference Roghair, Wemmie and Volk47 have been reported to programme an increase in basal arterial blood pressure at adulthood. By contrast, there is little information on the effects of developmental hypoxia on the regulation of arterial blood pressure at adulthood, measured in vivo, particularly in the absence of anaesthesia. This is surprising as fetal hypoxia is the most common challenge in complicated pregnancy, such as during preeclampsiaReference Soleymanlou, Jurisica and Nevo48 and placental insufficiency.Reference Baschat49 The present study shows that developmental hypoxia is associated with a fall, rather than an increase, in mean, systolic and diastolic basal arterial blood pressure in adult conscious chickens and that this effect is independent of the sex of the animal. Given that hypotension occurred in the absence of bradycardia during basal conditions, an effect on lowering peripheral vascular resistance of development at HA is favoured. A lack of a programmed hypertensive effect in adult chickens of isobaric hypoxia in ovo has also been reported by Ruijtenbeek et al.Reference Ruijtenbeek, Kessels and Janssen50 Similar findings have been reported in chickReference Lindgren, Crossley, Villamor and Altimiras51 and alligatorReference Crossley and Altimiras52 embryos incubated under chronic isobaric hypoxia, yielding basal hypotension without basal bradycardia, even before hatching. Coney and MarshallReference Coney and Marshall53 reported that adult rats of chronically hypoxic pregnancies had significantly elevated resting femoral blood flow compared with adult rats of normoxic pregnancies, supporting a programmed fall in peripheral vascular resistance contributing to the programmed hypotensive effects of developmental hypoxia. Further, Herrera et al.Reference Herrera, Pulgar and Riquelme54 reported that HA chronic hypoxia during gestation yielded newborn lambs with significantly lower systemic vascular resistance than lowland newborn lambs, although basal systemic arterial blood pressure was not different. The mechanism via which developmental hypoxia may promote a fall in peripheral vascular resistance and a fall in resting blood pressure at adulthood is unclear. However, there is an established relationship between increased plasma Ht, blood viscosity and shear stress-induced increases in nitric oxide (NO) bioavailability.Reference Martini, Carpentier, Negrete, Frangos and Intaglietta55 Interestingly, moderate elevations in blood viscosity by increasing Ht by 10% from baseline could produce reductions in basal blood pressure by 10 mmHg, an effect that could be abolished by treatment with the NO synthase blocker l-N omega-nitro-l-arginine methyl ester (l-NAME) or in NO synthase-deficient mice.Reference Martini, Carpentier and Chávez Negrete56 In the present study, chickens at HA had significantly lower arterial PO2 and haemoglobin oxygen saturation and a persistent increase in Ht of ca. 8%.
Investigation of the effects of adverse intrauterine conditions on baroreflex function in the offspring is scarce relative to reported programmed changes in basal arterial blood pressure. Within the few studies available, it is known that maternal undernutrition can increase the set point and blunt baroreflex responses in the adult offspringReference Pladys, Lahaie and Cambonie57–Reference Gopalakrishnan, Gardner and Rhind59 and that embryonic and fetal exposure to excess glucocorticoids can increase the set point and decrease the sensitivity of the baroreflex in fetal, newborn and adult life.Reference Dodic, Abouantoun, O'Connor, Wintour and Moritz44, Reference Shaltout, Rose and Figueroa46, Reference Fletcher, McGarrigle, Edwards, Fowden and Giussani60–Reference Roghair, Segar and Volk62 By contrast, as with effects on basal arterial blood pressure, there is less information on the effects of developmental hypoxia on baroreflex function. One study has reported that chronic hypoxic pregnancy decreases baroreflex sensitivity in the late-gestation ovine fetusReference Pulgar, Hong and Jessup63 and Peyronnet et al.Reference Peyronnet, Dalmaz and Ehrström64 predicted but did not measure alterations in baroreflex function in rat adult offspring of chronically hypoxic pregnancies.
Gilbert and Nijland,Reference Gilbert and Nijland65 in an elegant and useful review, brought to attention the growing body of evidence reporting sex differences in the developmental programming of alterations in arterial blood pressure and its regulation. Again, most of this evidence comes from studies involving alterations in maternal nutritionReference Fowden, Giussani and Forhead2, Reference Roghair, Segar and Volk62, Reference do Carmo Pinho Franco, Nigro and Fortes66 or from models of maternal stress and glucocorticoid excessReference Roghair, Segar and Volk62, Reference Igosheva, Taylor, Poston and Glover67 than from models of prenatal hypoxia. The weight of the evidence has generally, but not exclusively, suggested that female offspring are less sensitive in manifestation of cardiovascular disease caused by prenatal stimuli.Reference Gilbert and Nijland65 Accordingly, Davidge and colleagues have reported that peripheral vascular function and cardiac hypertrophy is more profoundly affected in male than in female rat offspring of hypoxic pregnancies, particularly as they age.Reference Hemmings, Williams and Davidge68–Reference Morton, Rueda-Clausen and Davidge70 Similarly, prenatal hypoxia caused an increase in heart susceptibility to ischaemia reperfusion injury in male but not in female adult rat offspring.Reference Xue and Zhang71 To our knowledge, only one study has reported sexually dimorphic effects in programming changes in baroreflex function induced by maternal malnutrition or fetal glucocorticoid exposure.Reference Roghair, Segar and Volk62 Certainly, there have been no reports on sex-dependent programming of baroreflex dysfunction by developmental hypoxia. In the present study, we show that while the effects of developmental hypoxia on resting arterial blood pressure at adulthood were sex independent, development at HA had reciprocal effects on the gain of the baroreflex in adult male and female chickens. Baroreflex gain was decreased in adult males, but it was increased in adult females at HA relative to SL controls. A decrease in baroreflex gain may render the male less able to respond to alterations in blood pressure homoeostasis. Further, the rate-pressure product, an index of myocardial workload and oxygen consumption,Reference Gobel, Norstrom, Nelson, Jorgensen and Wang31 although unchanged in males by altitude, was decreased in highland relative to lowland females. Finally, the head:CRL ratio, an index of blood flow redistribution, although unchanged in females by altitude, was increased in highland relative to lowland males. Collectively, therefore, the present data also suggest a greater resilience of the female offspring to development under conditions of HA hypoxia, again adding to the increasing body of evidence showing greater susceptibility to programmed cardiovascular dysfunction in male than female offspring. It is important to acknowledge that there are important differences in sexual differentiation in avian and mammalian species. For instance, in the chicken, males rather than females are homogametic and sex determination is cell autonomous. Therefore, translation of the sexually dimorphic results between species should be considered cautiously.
It has been suggested that it is the mismatch between the pre- and postnatal environment that renders the offspring susceptible to developing disease at adulthood.Reference Gluckman and Hanson72 In the present study, the environmental condition of hypoxia occurs in ovo and persists after hatching. In this context, it is of interest that significant alterations in blood pressure homoeostasis were evident in male and female adult chickens despite matching of the incubation and post-hatching environments. Cardiovascular dysfunction may therefore have developed in response to a double insult; one occurring before and one after hatching. The partial contributions of incubation v. post-hatching HA hypoxia in triggering cardiovascular dysfunction at adulthood await investigation by study of adult offspring raised at SL following HA incubation, and by study of adult offspring raised at HA following SL incubation. However, evidence of similar alterations in blood pressure homoeostasis than those reported here at adulthood in the chronically hypoxic chick embryo even before hatchingReference Lindgren, Crossley, Villamor and Altimiras51 supports a primary effect triggered during the incubation period rather than after hatching.
In conclusion, by combining the chick embryo model with incubation at HA, we have isolated the effects of developmental hypoxia on cardiovascular function at adulthood measured in conscious chickens in vivo, and show that development at HA promotes blood pressure dysregulation, altering baroreflex sensitivity in a sex-dependent manner at adulthood.
Acknowledgements
This work was supported by The British Heart Foundation, The Royal Society and the U-Apoya Program, Universidad de Chile. Emilio A. Herrera is a fellow of Beca Presidente de la Republica (CONICYT) from the Chilean Government. Dino A. Giussani is a Royal Society Wolfson Research Merit Award holder.



