I. INTRODUCTION
Nitrogen oxide emitted into the atmosphere is the main substance to cause acid rain when the fuel oil product was used, and it will lead to environmental pollution and threat human health.Reference van Amsterdam, Hollander, Snelder, Fischer, van Loveren, Vos, Opperhuizen and Steerenberg1 So it is very important to deeply remove nitrogen components from fuel oil. Generally, basic and nonbasic nitrogen are included in fuel oil, furthermore, indole and its derivatives are the primary nonbasic nitrogen. Recently, many denitrification technologies such as hydrodenitrogenation,Reference Xiang, Chai, Liu and Liu2 biological denitrification,Reference Cheng, Kumar and Lin3 microwave denitrification,Reference Ma, Jin, Jin, Yao, Zhang, Dong and Shi4 and combination denitrificationReference Kimura, Nakamura and Watanabe5 have been applied to disposing nitrogen from fuel oil and made some achievements. However, these methods mentioned above are effective to remove the basic nitrogen compounds and less reliable to wipe off nonbasic nitrogen. Therefore, the key is how to remove nonbasic nitrogen effectively, and the stability of fuel oil will be maintained. Indole as typical nonbasic nitrogen has been paid more attention.
Molecular imprinting technique (MIT) is a simple and efficient method to prepare polymers with specific recognition sites for the certain target molecule.Reference Mahmoud, Chang, Al-Ghamdi and Al-Marzouki6–Reference Gao, Liu and Li8 Many outstanding advantagesReference Puoci, Lemma, Cirillo, Curcio, Parisi, Spizzirri and Picci9 of molecularly imprinted polymer (MIP) are shown, so it has been a promising candidate for chromatographic analysis,Reference Andersson10 solid-phase extraction,Reference He, Long, Pan, Li and Liu11 antibody mimics,Reference Ye and Mosbach12 biomimetic catalysis,Reference Say, Erdem, Ersoz, Turk and Denizli13 sensors,Reference Li, Jiang, Li and Chen14–Reference Wu, Feng, Tan and Hu17 drug development,Reference Shi, Wu, Qu, Li and Zhang18 and other applications. Since the surface MIP has a high binding capacity and a fast mass transfer, it has been used to overcome some drawbacks such as poor accessibility of the binding sites, low binding capacity and so on.Reference Gao, Lu, Chen and Guo19–Reference Gao, Wang, An and Liu21
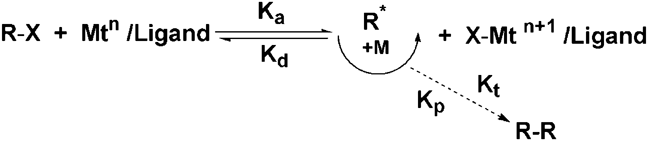
Nowadays, the MIP prepared by free radical polymerization (FRP) has been reported by many works.Reference Theis, Davis, Stenzel and Barner-Kowollik22 The controlled “living” radical polymerization (CRP) techniques create a whole new dimension in the synthesis of polymeric system which is unable to propagate and self-terminate chain reaction.Reference Braunecker and Matyjaszewski23–Reference Kowalczuk-Bleja, Trzebicka, Komber, Voit and Dworak25 Therefore, the extent of CRP relies on setting up a dynamic equilibrium between active and dormant species. The probability of bimolecular termination reaction is minimized, and the radical polymerization behaves as a living system.Reference París, Mosquera and de la Fuente26,Reference Mendonça, Serra, Silva, Simões and Coelho27 As one of the most efficient and powerful methods in CRP techniques, atom transfer radical polymerization (ATRP) with characteristics of predictable molecular weights, mild polymerization conditions, remarkable tolerance of functional groups, and very diverse polymeric materials has attracted more considerable attention.Reference Pietrasik and Tsarevsky28 The ATRP has been applied in surface imprinting technology by grafting polymer on the supporter surface. Because the microspheres will process reactive halogen groups on its surface, and it ensures that the cross-linked polymer was grafted to the substrate by covalent bond.Reference Li, Pan, Dai, Dai, Xu, Wei, Hang, Li and Liu29 The mechanism of ATRP is simply described in Fig. 1.Reference Dai, Pan, Xu, Li, Zhou, Zhang and Yan30–Reference Siegwart, Oh and Matyjaszewski32
Schematic illustration of ATRP.

In our work, we combined the surface MIT and atom transfer radical emulsion polymerization (ATREP) to prepare indole-MIP for selective adsorption of indole from fuel oil. It is important to note that the SiO2 modified by MPS (MPS-SiO2) was selected as a supporter, and indole as template, 4-vinylpyridine (4VP) as functional monomer, ethylene glycol dimethacrylate (EGDMA) as cross-linker, copolymer monomer. The kinetics, isotherms, and thermodynamic analysis have been performed to study the adsorption mechanism of indole onto indole-MIP. The structure and morphology of indole-MIP were characterized by nitrogen adsorption, infrared spectrum, scanning electron microscopy (SEM), and thermogravimetric analysis (TGA).
II. EXPERIMENTAL
A. Materials and instrument
4-vinylpyridine (4VP, 99.5%), indole (98.5%), 3-methylindole (98%), quinoline (99%), benzothiophene (BT, 99%), ethylene glycol dimethacrylate (EGDMA, 98%), n-octane (AR) were supplied by Sigma-Aldrich Chemical Company (St. Louis, MO). Tetradecane (99.9%), toluene (AR), and acetone (AR) were obtained from Nanjing Union Silicon chemical (Nanjing, China). CuCl (AR), N,N,N′,N″,N″-pentamethyl diethylenetriamine (PMDETA, 98%), γ-methacryloxypropyltrimethoxysilane (MPS, 97%), ethyl-2-bromoisobutyrate (EBiB), methanol (MeOH, AR), ammonia (AR), ethanol (AR), and acetic acid (AcOH, AR) were received from the Sinopharm Chemical Reagent (Shanghai, China). Polysorbate-(60) (Tween 60) and tetraethyl orthosilicate were purchased from Aladdin Reagent Co., Ltd. (Shanghai, China).
Flowsorb II 2300 manufactured by Micromeritics Instrument Corporation, Norcross, GA. NICOLET NEXUS 470 Fourier transform infrared spectrometry (FTIR) was obtained from Thermoelectric (Thermo Nicolet Corporation, Madison, WI). S-4800 field emission SEM was purchased from Hitachi (Tokyo, Japan). STA449C TGA was purchased from Netstal (Bayerische, Germany). AVANCE II 400 MHz H1-nuclear magnetic resonance (H1-NMR) was obtained from Bruker (Switzerland). Agilent 7890A gas chromatography containing a flame ionization detector was manufactured from Agilent (Santa Clara, CA).
B. Synthesis of Indole-MIP and nonimprinted polymer by ATREP
1. Preparation of SiO2 particles
The SiO2 particles were obtained at 45 °C in the mixture with molar concentrations of tetraethyl orthosilicate, ammonia, and deionized water of 0.3 mol/L, 2.5 mol/L, and 15 mol/L, respectively. The tetraethyl orthosilicate was dropwise added into the mixture of ethanol, deionized water, and ammonia. The resulting substance was filtered, washed, and dried before use.
2. Synthesis of modified SiO2 particles
The obtained SiO2 and 6 mL of MPS were dispersed in 50 mL of dry toluene in a sealed flask. Under nitrogen environment, the reaction condition was conducted at 114 °C with continuous stirring for 24 h. The products were filtered and washed with toluene, acetone, and ethanol in sequence and then dried in a vacuum at 60 °C. The SiO2 modified by MPS (SiO2@MPS) was achieved.
3. Synthesis of indole-MIP and NIP
The indole-MIP was prepared by ATREP according to the following procedures: at first, SiO2@MPS (1 g), indole (0.5 mmol), 4VP (2 mmol), EGDMA (6 mmol) were added into a 50 mL of round-bottom flask with water (30 mL) and Tween 60 (0.45 g). The mixture was processed by ultrasonic dispersion for 20 min and then deoxygenated with nitrogen for 15 min. The prepolymerization was carried out at room temperature with continuous magnetic stirring in nitrogen environment for 6 h. After that, PMDETA (0.1 mmol), CuCl (0.1 mmol) purified by acetic acid, and EBiB (0.15 mmol) were quickly transferred into the reaction system under the protection of nitrogen. The flask containing the mixture was immersed in a constant temperature oil bath at 60 °C with continuous stirring for 24 h. The obtained products were filtered and successively washed with ethanol and acetone to remove the unreacted substances. Finally, the indole template was removed from indole-MIP by a mixing methanol/acetic acid solvent (9:1, v/v) for 72 h. The indole-MIP on the SiO2 particle surface by ATREP was synthesized successfully and dried in a vacuum at 60 °C.
The corresponding nonimprinted polymer (NIP) was prepared as a blank using the same methods under the identical conditions but indole template was omitted in the polymerization process.
C. Characterizations of indole-MIP and NIP
The Flowsorb II 2300 was used to measure the specific area (m2/g), the pore volume (cm3/g ), and pore diameter (Å). The FTIR was used to obtain infrared spectrogram with KBr as tableting between 4000 cm−1 and 400 cm−1. The SEM was used to observe the morphological characteristics and structures of polymers. TGA was used to measure the components and thermal stability, the sample was heated under nitrogen atmosphere from room temperature to 1000 °C with a heating rate of 10 °C. The H1-NMR was used to obtain the spectrum of interaction between functional monomer and template molecule, and deuterated acetone was selected as the solvent.
D. Performance test of indole-MIP
The Agilent 7890A gas chromatography [equipped with a flame ionization detector (GC-FID)] was used to detect the residuary concentration of indole to obtain the rebinding capacity of indole onto indole-MIP in adsorption tests.
1. Test of adsorption kinetics
To investigate the adsorption equilibrium and the adsorption rate of indole-MIP toward indole, three group parallel tests have been carried out in simulate oil (n-octane as a solvent, indole as a solute) with the initial concentration of 300 mg/L at different temperatures (298, 308, and 318 K), respectively. Specific operation was as follows: first, 10 mg of indole-MIP was added into centrifuge tubes with 5 mL simulate oil, and then the tubes were shaken in a vapor-bathing constant temperature vibrator at preset temperatures for predetermined time intervals, respectively. Concentrations of indole that remained in the supernatant were detected by GC after centrifugation.
2. Test of adsorption isotherms
To explore the effect of concentration on adsorption capacity and equilibrium constant, 10 mg of indole-MIP was added into test tubes containing 5 mL simulate oil solution with different initial concentrations (from 100 to 800 mg/L). Then the test tubes respectively were shaken in a vapor-bathing constant temperature vibrator at preset temperatures (298, 308, and 318 K) for 3 h. The concentrations of the remaining indole in the supernatant were detected in the same way as adsorption kinetics.
3. Test of selective and competitive adsorption
To study the selectivity of indole-MIP toward indole, the experiment was carried out in four different solutions of 300 mg/L, which respectively were indole, 3-methylindole, quinoline, and BT. However, the competitive adsorption test of the indole-MIP was conducted in a 300 mg/L mixture containing the above four kinds of substances. The operations of both parts were similar to that of adsorption isotherms, and the adsorption processes were allowed to conduct at 298 K for 3 h.
III. RESULTS AND DISCUSSION
A. Preparation of indole-MIP
The indole-MIP grafted on the SiO2 surface had a high adsorption capacity due to the large specific area. The SiO2 was modified by grafting MPS, so the polymerizable double bonds were introduced to carry out the polymerization reaction. The 4VP was chosen as the functional monomer based on the consideration that hydrogen bond was formed between 4VP and indole, and multiple hydrogen-binding sites could be provided. Furthermore, the mol ratio of functional monomer and template was 4:1. The EGDMA was chosen as cross-linker, and the polymerization was initiated by the reaction between the EBiB and transition metal complex (Cu+/PMDETA). In our experiment, the synthesis of indole-MIP by the ATREP was carried out in the water containing the surfactant Tween 60. The emulsion polymerization was adopted to prepare nanoparticles, which could be advantageous to mass transfer and enhance adsorption capacity. The schematic illustration of polymerization is shown in Fig. 2.
Schematic for the preparation of indole-MIP.

B. Structural characterization of indole-MIP and NIP
1. Nitrogen adsorption analysis
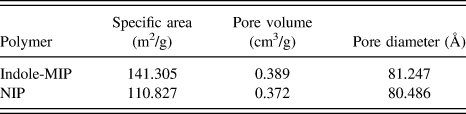
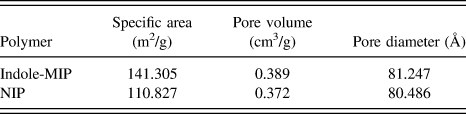
The Brunauer–Emmett–Teller (BET) equation was used to measure the specific area (m2/g ) of indole-MIP and NIP. The pore volume (cm3/g) and pore diameter (Å) were analyzed by the Barrett–Joyer–Halendal (BJH) model. The resulting data are shown in Table I. It is seen that the pore property values of indole-MIP were similar to those of NIP. However, the specific area of indole-MIP was larger than that of NIP. Therefore, compared with NIP, more pores on indole-MIP were shown to be present. It was attributed to the removal of template indole, and the imprinting sites were remained. Therefore, the indole-MIP had the favorable spaces for indole, and this could promote the interaction between indole-MIP and indole.
Pore properties of indole-MIP and NIP.
2. Infrared spectrum analysis
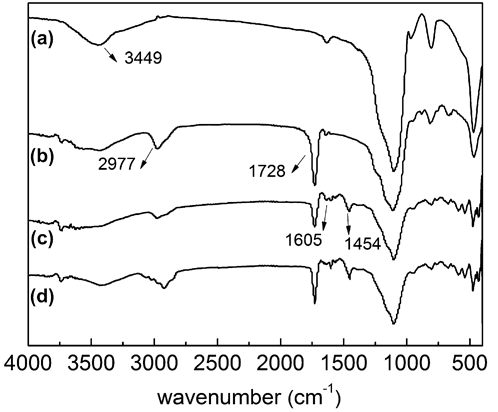
The FTIR spectra of the SiO2 particles, SiO2@MPS, and indole-MIP respectively are shown in Fig. 3. The main functional groups of each step in polymerization were confirmed by the corresponding infrared adsorption peaks. The presence of hydroxyl group was proven by characteristic adsorption peak of H–O at 3449 cm−1 in spectral line a. Both the stretching vibration absorption peaks of C=O and C=C respectively were displayed at around 2977 cm−1 and 1728 cm−1; it verifies that the SiO2 was modified by MPS via the covalent bond in spectral line b. In addition, from spectral line c, the deformation vibration peak of C=N found at 1605 cm−1 proves that 4VP was grafted successfully. All the above results reveal that the surface MIP was obtained by ATREP.
FTIR spectra of (a) SiO2, (b) MPS-SiO2, and (c) indole-MIP.
3. SEM analysis
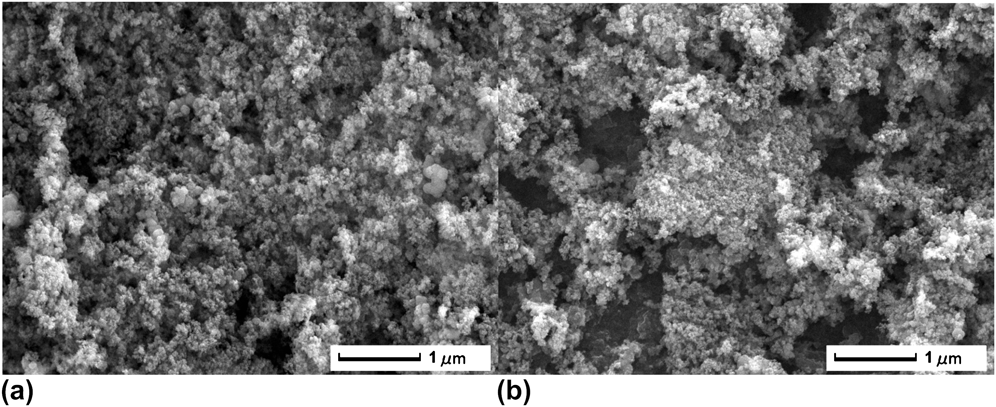
The morphology of indole-MIP and NIP is displayed in Fig. 4. Compared with NIP (b), the rougher surface, more pores, and larger surface area of indole-MIP (a) are displayed.
The SEM images of (a) indole-MIP and (b) NIP.
4. Thermogravimetric analysis
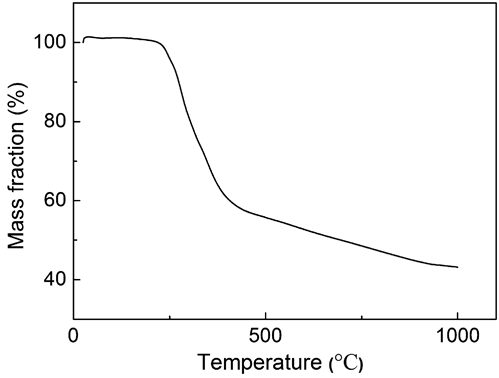
The TGA curve of indole-MIP is given in Fig. 5. The mass of SiO2 particles and the imprinting layer was measured by TGA. The indole-MIP almost had a constant weight when the temperature was increased from 25 °C to 100 °C. The result mainly suggests that the polymer was dried absolutely without moisture evaporation. A percent of 56.8 dropped in quality of indole-MIP when the temperature was rising and over 250 °C. The lost mass was identified as the polymer coating at the SiO2 particle surface. Thus, the rest of the substance was SiO2 particles, which could not be melted until the temperature reached 1670 °C, and it was about 43.2% of the total mass.
TGA curve of indole-MIP.
5. H1-NMR analysis
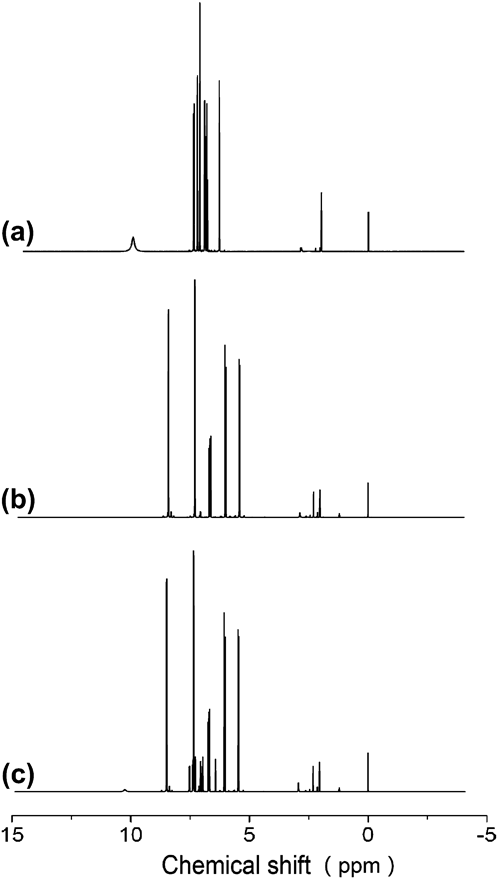
The H1-NMR lines of indole, 4VP, and the complex between indole and 4VP are represented in Fig. 6. The different line widths and chemical shifts indicated the presence of different types of hydrogen. For line a, a larger line width has been found at the chemical shift δ = 10.2 ppm for hydrogen engaged in nitrogen of indole, and the hydrogens located on aromatic heterocyclic rings and benzene ring of indole were shown approximately from 7.6 to 6.5 ppm. Furthermore, δ = 2.0 ppm represented the solvent peak of deuterated acetone. For spectral line b, the hydrogens engaged in double bond of 4VP were shown at chemical shifts δ = 6.8, 6.1, and 5.5 ppm. The peaks at δ = 8.5 and 7.4 ppm could be assigned to the hydrogens located on aromatic of 4VP. As is shown in spectral line c, the peak at chemical shift δ = 10.3 was low, a slight change has been shown. Meanwhile, the chemical shifts of other lines were almost maintained in the complex. The result shows that the chemical reaction was not carried out between template indole and functional monomer 4VP, and the interaction force could be hydrogen bond and intermolecular force, etc.
H1-NMR spectra of (a) indole, (b) 4VP, and (c) complex of indole and 4VP.
C. Adsorption performance of indole-MIP
1. Analysis of adsorption kinetics
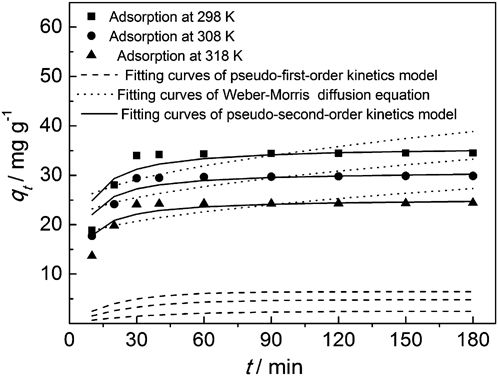
The fitting curves of Weber–Morris diffusion equation, pseudo-first-order and pseudo-second-order models are shown in Fig. 7. It is seen that the adsorption curves were steep in the initial phase and then got flattened after 30 min. An increase in adsorption rate of indole-MIP toward indole was shown during the first 30 min. As time progresses, the adsorption rate decreased slowly until the equilibrium was achieved. The result could be attributed to a large number of unoccupied sites on indole-MIP surface at the beginning of the adsorption process. A higher affinity, weaker steric hindrance, and less mass resistance for inodol-MIP toward indole were displayed. Subsequently, most of the binding sites were occupied by indole molecules so that the adsorption rate was decreased and the equilibrium was reached. Because of the hydrogen bond between the template and the functional monomer, the adsorption equilibrium was obtained in a short time even at different temperatures.
Kinetic adsorption and fitting curves of indole-MIP toward indole with 500 mg/L initial concentration at different temperatures.
The adsorption capacity was calculated according to Eq. (1).
 $${q_t} = \left( {{C_0} - {C_t}} \right)V/m\quad ,$$
where q t (mg/g) represents the amount of adsorbed indole at time t; C 0 and C t are the concentration of indole at initial and time t, respectively; V and m respectively are the volume of simulate oil and mass of indole-MIP.
The data obtained from adsorption experiments were fitted with the Weber–Morris diffusion equation, pseudo-first-order and pseudo-second-order equations to investigate the mechanism and interaction in the adsorption process. The Weber–Morris diffusion equation can be given by Eq. (2),
 $${q_t} = {k_{\rm{i}}} \,{t^{1/2}} + {k_{\rm{d}}}\quad ,$$
where k i and k d (mg/g/min) respectively stand for diffusion coefficient and diffusion boundary constant and can be calculated from the plot of q t versus t 1/2.
The pseudo-first-order modelReference Wood and Gladden33 can be expressed as follows:
 $${\rm{ln}}({q_{\rm{e}}} - {q_t}) = {\rm{ln}}({q_{\rm{e}}}) - {k_{\rm{1}}}t\quad {\rm{,}}$$
where the q e (mg/g) and q t (mg/g) are the adsorbed indole amount at equilibrium and time t, respectively; k 1 is the adsorption rate constant of pseudo-first-order.
The pseudo-second-order modelReference Ho and Ofomaja34 can be expressed as:
 $$t/{q_t} = {\rm{1}}/{k_2}q_t^2 + t/{q_{\rm{e}}}\quad ,$$
where k 2 is the adsorption rate constant of pseudo-second-order.
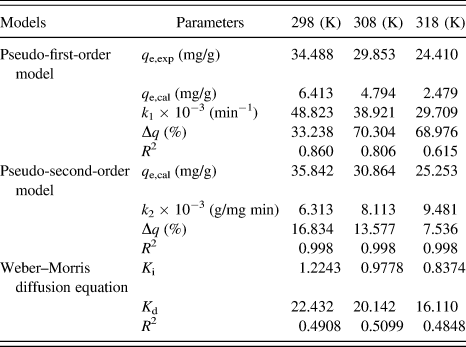
The adsorption rate constants and linear regression values of these models are summarized in Table II. It is obvious to find that the regression coefficient values (R 2) of the pseudo-second-order model were higher than those of the pseudo-first-order model and the Weber–Morris diffusion equation. The values of R 2 were all above 0.99 even at different temperatures, which suggested only a slight difference between the experimental and theoretical values of q e for the pseudo-second-order model. And compared with the other two models, the adsorption process of indole-MIP toward indole was more palatable to the pseudo-second-order model. The chemical adsorption was dominant and controlled the rate of interaction in the process of rebinding indole.
Kinetic parameters of the adsorption process of indole-MIP toward indole.
2. Analysis of adsorption isotherms
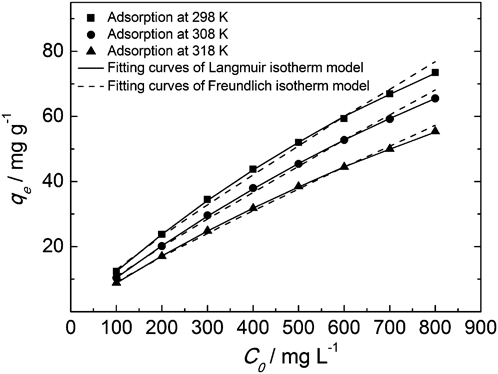
Adsorption isotherm experiments were performed at different temperatures (298, 308, and 318 K) with indole initial concentrations ranging from 100 to 800 mg/L. The fitting curves of experimental results are displayed in Fig. 8. As shown in Fig. 8, the adsorption capacity increased with increasing initial concentrations. It was due to the intensive indole molecules contained in unit volume, and it was easier to be combined with indole-MIP. However, with increasing temperatures, there was a decrease in the binding capacity. The reason for this phenomenon was the weak hydrogen bond force between 4VP and indole at a high temperature. Therefore, an appropriate low temperature could enhance the hydrogen bonding interaction and promote the adsorption of indole onto indole-MIP.
Adsorption isotherms and fitting curves of indole-MIP toward indole with different initial concentrations at different temperatures.
The equilibrium adsorption capacity was obtained according to the following equation:
 $${q_{\rm{e}}} = \left( {{C_0} - {C_{\rm{e}}}} \right)V/m\quad ,$$
where q e (mg/g) and C e respectively are the adsorption capacity of indole-MIP (mg/L) and concentration of indole at equilibrium.
Here, the experimental data were respectively analyzed by Langmuir isotherm model and Freundlich isotherm model. The nonlinear expression of the Langmuir modelReference Brocos, Gracia-Fadrique, Amigo and Piñeiro35 was given by the following Eq. (6):
 $${{C_{\rm{e}} } \mathord{\left/ {\vphantom {{C_{\rm{e}} } {q_{\rm{e}} }}} \right. \kern-\nulldelimiterspace} {q_{\rm{e}} }} = {{C_{\rm{e}} } \mathord{\left/ {\vphantom {{C_{\rm{e}} } {q_{\rm{m}} + {1 \mathord{\left/ {\vphantom {1 {\left( {q_{\rm{m}} K_{\rm{L}} } \right)}}} \right. \kern-\nulldelimiterspace} {\left( {q_{\rm{m}} K_{\rm{L}} } \right)}}}}} \right. \kern-\nulldelimiterspace} {q_{\rm{m}} + {1 \mathord{\left/ {\vphantom {1 {\left( {q_{\rm{m}} K_{\rm{L}} } \right)}}} \right. \kern-\nulldelimiterspace} {\left( {q_{\rm{m}} K_{\rm{L}} } \right)}}}}\quad ,$$
where q e is the equilibrium adsorption amount of indole-MIP (mg/g); C e is the equilibrium concentration of indole (mg/L); q m (mg/g) is the calculation of the saturation adsorption capacity of the indole-MIP; K L is the Langmuir constant representing the affinity constant.
The Freundlich isotherm modelReference Chilton, Losso, Marshall and Rao36 was displayed as Eq. (7):
 $$\log {q_{\rm{e}}} = \log {C_{\rm{e}}}/n + \log {K_{\rm{F}}}\quad ,$$
where K F is the Freundlich constant.
The correlation coefficients of both isotherm models are displayed in Table III. According to the high coefficient values (R 2), both Langmuir isotherm model and Freundlich isotherm model were relatively fitted with experimental values. Thus, the process of indole adsorbed onto indole-MIP obeyed these two isotherm models well. The monolayer adsorption for indole-MIP toward indole was proved, and the adsorption was nonuniform. Both the chemical adsorption and the physical adsorption were included in the interaction process. The chemical adsorption shows the special adsorption and recognition of imprinting sites toward indole.
Parameters of the Langmuir and Freundlich isothermal equations.
3. Adsorption thermodynamics
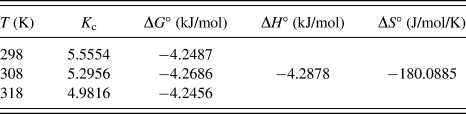
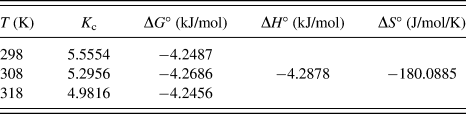
The standard enthalpy change (ΔH°),Reference Smirnov and Badelin37 the standard free energy change (ΔG°)Reference Demidov, Mishin and Mikhailov38 and the standard entropy change (ΔS°)Reference Song, Wang, Jiao, Si, Li, Liu, Liu, Jiang, Li, Zhang, Sun, Xu and Huang39 were chosen to describe the thermodynamic characteristics during the adsorption process. These parameters were calculated by following Eqs. (8) and (9):
 $${\rm{ln}} \,K_{\rm{c}} = - {{{\rm{\Delta }}H\circ } \mathord{/{ RT}} + {{{\rm{\Delta }}S\circ } \mathord{/ {{R}}\quad ,$$
 $$\Delta G = - RT\ln {K_{\rm{c}}}\quad ,$$
where K c is a distribution constant (mL/g) obtained by the intercept of the straight line, which plotting ln(q e/C e) versus q e and extrapolating q e to zero; T is the absolute temperature (K); R is the gas constant (8.3145 J/mol/K).
These thermodynamic parameters for the adsorption process of indole onto indole-MIP are displayed in Table IV. The adsorption process was spontaneous within the investigated temperatures by a negative ΔG° value. The adsorption process was exothermic; this could be confirmed by a negative value of ΔH°, and the weak adsorption capacity at a high temperature was further proven. The thermodynamic quotient reduction was shown in the interaction process by a negative ΔS°.
Thermodynamic parameters for the adsorption process of indole-MIP toward indole.
4. Selectivity and competitive adsorption of indole-MIP and NIP
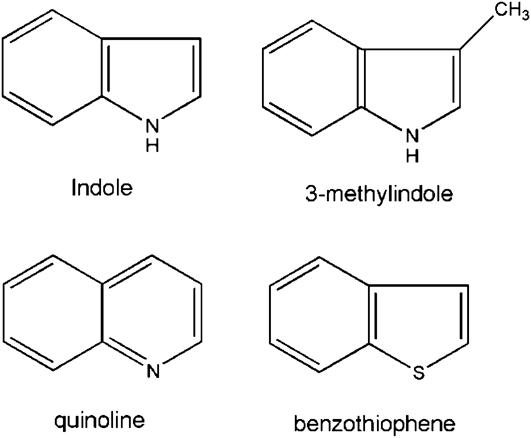
According to the similar size and functional group, reference substances of indole such as 3-methylindole, quinoline, and BT were chosen to explore the selective and competitive adsorption of indole-MIP and NIP toward indole. The chemical structures of the above-mentioned substances are shown in Fig. 9. Compared with template indole, BT has a similar size but the functional group is different. However, 3-methylindole and quinoline have identical functional groups to indole while having differences in size.
Chemical structures of the indole, 3-methylindole, quinoline, and BT.
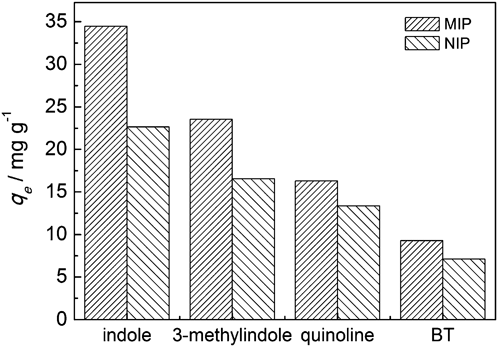
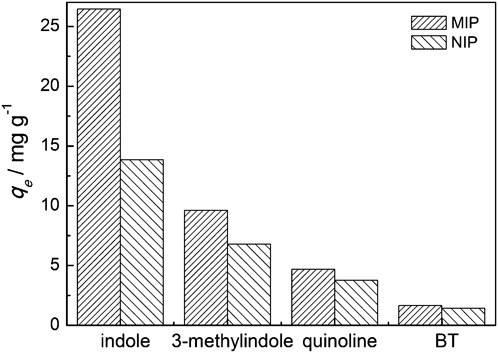
The selectivity adsorption experiment for each of adsorbates was carried out under identical conditions. The equilibrium adsorption capacity of indole-MIP and NIP toward indole and analogs is shown in Fig. 10. The results indicate that indole-MIP had a higher binding capacity toward indole than toward other analogs. It means that the indole-MIP had a better selectivity for indole. This phenomenon was attributed to the imprinting effect, which could recognize the molecular size, structure, and functional group by imprinting sites. In addition, the adsorption capacity of indole-MIP toward 3-methylindole was more than toward quinoline and BT due to the identical interaction of 3-methylindole and indole with 4VP. The indole-MIP toward BT had the minimum adsorption capacity, because the interaction between BT and 4VP is weak, even though BT has a similar size to indole. Meanwhile, it is seen that the binding capacity of indole-MIP toward indole and its analogs was higher than that of NIP because of the imprinted sites and pore structures on the indole-MIP surface. In the whole adsorption process, the hydrogen bond between nitrogen of 4VP and hydrogen of indole was the main driving force and plays an important role. However, the adsorption process was complex, besides the hydrogen bond interaction, the electrostatic interaction and other interactions such as the synergistic effect of shape complementarity were also involved in noncovalence interactions between the functional monomer and the target.
Selective adsorption capacity toward indole, 3-methylindole, quinoline, and BT of indole-MIP and NIP.
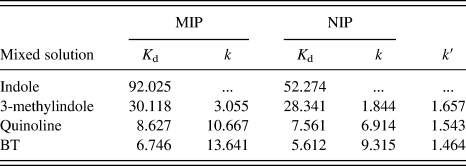
To further explore the rebinding capacity of the indole-MIP and NIP toward indole, the experiment was carried out in mixing solution containing indole and three kinds of analogs. The purpose of competitive adsorption was to test the interference of analogs to the adsorption of indole-MIP toward indole. The adsorption capacities of indole-MIP and NIP were evaluated by some parameters such as K d, k, and k′, which were calculated by equations as follows.
The distribution coefficients of the selectivity adsorption toward indole, 3-methylindole, quinoline, and BT were calculated according to Eq. (10):
 $${K_{\rm{d}}} = {q_{\rm{e}}}/{C_{\rm{s}}} \quad ,$$
where K d (mL/g) is the distribution coefficient, q e (mg/g)and C s (mg m/L) are the equilibrium adsorption capacity and the concentration of the adsorbate, respectively.
The selectivity coefficient of indole toward its competitor (marked as B) could be obtained by the following Eq. (11):
 $$k = {K_{\rm{d}}}({\rm{indole}})/ {K_{\rm{d}}}({\rm{B}})\quad ,$$
where k is the selectivity coefficient, B represents 3-methylindole, quinoline, and BT, respectively.
The relative selectivity coefficient k′ could be figured out with Eq. (12),
 $$k' = {k_{{\rm{MIP}}}}/{k_{{\rm{NIP}}}}\quad ,$$
where k′ is the relative selectivity coefficient.
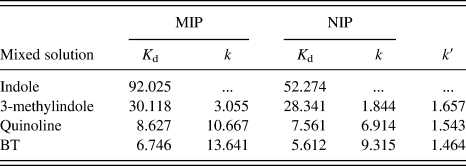
The resulting data are listed in Table V, and the illustration by comparison is shown in Fig. 11. The high adsorption capacity of indole onto indole-MIP even in the mixed solution is shown. The reason is that indole-MIP with a great deal of specific cavities had a specific molecular recognition ability and high binding affinity to indole. However, compared with Fig. 10, the rebinding capacity of indole-MIP to indole had a slight decrease, and it could be attributed to the competition between indole and its analogs on binding sites. Even in this situation, the adsorption capacity of indole onto indole-MIP was obviously higher than onto NIP. It indicated the high selectivity of indole-MIP and the significant effect of imprinting sites.
Selective recognition parameters of indole-MIP and NIP.
Competitive adsorption capacity toward indole, 3-methylindole, quinoline, and BT of indole-MIP and NIP.
The distribution coefficients, selectivity coefficients, and relative selectivity coefficients are shown in Table V. Both K d and k of indole-MIP were greater than those of NIP; this provides a further explanation to the selectivity of indole-MIP. Imprinting sites obtained onto indole-MIP were sufficient to illustrate the difference between indole-MIP and NIP in adsorption capacity. The k′(indole) was obviously finer than k′(3-methylindole, quinoline, and BT). All the results clearly reveal that indole-MIP with excellent recognition and binding affinity to template indole was achieved successfully by ATREP.
5. Regeneration of indole-MIP
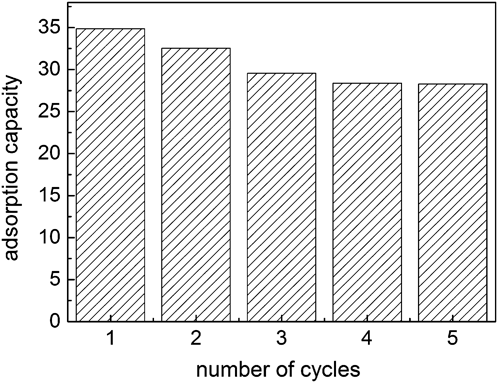
To study the regeneration and stability of indole-MIP, the cycling tests were carried out in the concentration of 300 mg/L of simulate oil.Reference Xu, Zhou, Xu, Pan, Wu and Yan40 The mixture of methanol and acetic acid (9/1, V/V) was selected as an eluent. The adsorption operation was conducted according to adsorption isotherm experiment at 298 K for 3 h. The results of five regeneration cycles are shown in Fig. 12. After five cycles of adsorption and elution, the adsorption capacity of indole-MIP dropped by 6.59 mg/g compared with initial adsorption capacity. It indicates that the indole-MIP prepared by ATREP had a perfect reusability.
Regeneration of adsorption indole onto indole-MIP.
IV. CONCLUSION
In our work, a novel surface MIP was synthesized by ATREP with 4VP as the functional monomer and SiO2@MPS as the matrix. Nitrogen adsorption, FTIR, and SEM were used to characterize the structures and morphology of indole-MIP and NIP. The results show that indole-MIP was provided with the rougher surface and more pores. Meanwhile, the thermostability of indole-MIP was explored from room temperature to 1000 °C by TGA, and the interaction between indole and 4VP was detected by H1-NMR. Adsorption experiment data show that the process of indole adsorbed onto indole-MIP was spontaneous, and the pseudo-second-order model was suitable to describe the adsorption performance. Both Langmuir and Freundlich isotherm models were obeyed by adsorption isotherm test. Furthermore, the adsorption equilibrium was reached in 30 min, and an appropriate low temperature could promote the rebinding capacity. This was attributed to the weak binding affinity of hydrogen bond between functional monomer and template at a high temperature. In addition, it could be seen that adsorption capacity increased with the increasing initial concentration. The adsorption property tests show that indole-MIP was able to selectively recognize and adsorb indole from simulate oil, and the reused performance was excellent. From the discussion, the preparation of indole-MIP for selective adsorption indole by ATREP was feasible and effective. And for all above, the combination of ATREP and surface imprinting technique could be used in the developed removal of a harmful substance from fuel oil and other fields.
ACKNOWLEDGMENTS
This work is subsidized by the National Natural Science Fund (Grant Nos. 21106056 and 21174057), Jiangsu Natural Science Fund of China (Grant No. BK2011512), a project funded by the Priority Academic Program Development of Jiangsu Higher Education Institutions (PAPD), Senior Talent Foundation of Jiangsu University (Grant No. 09JDG048), and Scientific Research Foundation of Jiangsu University (Grant Nos. Y11A133 and Y10A035).